

Abstract
Many “novel” osteoporosis candidate genes have been proposed in recent years. To advance our knowledge of their roles in osteoporosis, we screened 20 such genes using a set of high-density SNPs in a large family-based study. Our efforts led to the prioritization of those osteoporosis genes and the detection of gene–gene interactions.
Introduction
We performed large-scale family-based association analyses of 20 novel osteoporosis candidate genes using 277 single nucleotide polymorphisms (SNPs) for the quantitative trait BMD variation and the qualitative trait osteoporosis (OP) at three clinically important skeletal sites: spine, hip, and ultradistal radius (UD).
Materials and Methods
One thousand eight hundred seventy-three subjects from 405 white nuclear families were genotyped and analyzed with an average density of one SNP per 4 kb across the 20 genes. We conducted association analyses by SNP- and haplotype-based family-based association test (FBAT) and performed gene–gene interaction analyses using multianalytic approaches such as multifactor-dimensionality reduction (MDR) and conditional logistic regression.
Results and Conclusions
We detected four genes (DBP, LRP5, CYP17, and RANK) that showed highly suggestive associations (10,000-permutation derived empirical global p ≤ 0.01) with spine BMD/OP; four genes (CYP19, RANK, RANKL, and CYP17) highly suggestive for hip BMD/OP; and four genes (CYP19, BMP2, RANK, and TNFR2) highly suggestive for UD BMD/OP. The associations between BMP2 with UD BMD and those between RANK with OP at the spine, hip, and UD also met the experiment-wide stringent criterion (empirical global p ≤ 0.0007). Sex-stratified analyses further showed that some of the significant associations in the total sample were driven by either male or female subjects. In addition, we identified and validated a two-locus gene–gene interaction model involving GCR and ESR2, for which prior biological evidence exists. Our results suggested the prioritization of osteoporosis candidate genes from among the many proposed in recent years and revealed the significant gene–gene interaction effects influencing osteoporosis risk.
Keywords: osteoporosis, BMD, single nucleotide polymorphism, haplotype, association, gene-gene interaction
INTRODUCTION
Osteoporosis is characterized by low bone mass and deteriorated bone microarchitecture leading to the increase in bone brittleness and susceptibility to fractures. Its etiology is complex and involves a wide spectrum of endogenous (genetic and hormonal) and environmental factors. In osteoporosis genetics, BMD is the predominant study phenotype because it has a high heritability of ~70%,(1) and low BMD can serve as a good surrogate for osteoporosis and low/no-trauma fractures.(2) Linkage evidence for BMD loci has been detected across every human chromosome. However, no consensus stable BMD-linkage regions have been established. In addition, >50 candidate genes have been associated with various bone phenotypes—mainly BMD. However, similar to linkage studies, no conclusive consensus associations have been found until now, nor have any causal variants been identified definitely.
Factors that may significantly contribute to the inconsistencies in osteoporosis genetic studies include inadequate statistical power, population stratification, genetic heterogeneity, experimental errors, and limited coverage of candidate genes or genomic regions. Ignoring gene–gene interaction (i.e., epistasis) also can contribute to the failure of replicating single-locus findings. To minimize the above problems, we performed a large-scale family-based association study, in which 1873 whites from 405 nuclear families (Table 1) were genotyped and analyzed with a high-density set of single nucleotide polymorphisms (SNPs) across 20 osteoporosis (OP) candidate genes. We studied human OP at three clinically important skeletal sites, the spine, hip, and ultradistal radius (UD), either as a quantitative trait, BMD variation, or as a qualitative trait, OP. We exploited the advanced and more-affordable multiplex SNP genotyping technology (Illumina BeadArray system) and the greatly enriched public SNP information to achieve a more complete coverage of the genetic variation of the selected candidate genes to increase the relative power to detect associations. Gene–gene interactions were studied as well using multianalytic approaches for model selection and validation, with the aim of distinguishing true epistatic interactions from joint effects or chance findings. Our strategy yielded a number of interesting findings in the osteoporosis genetics field.
Table 1.
Basic Characteristics of the Study Subjects From the 405 Nuclear Families
| Trait | Sons (n = 359) | Daughters (n = 697) | Fathers (n = 308) | Mothers (n = 324) |
|---|---|---|---|---|
| Age (yr)* | 35.7 (10.7) | 37.6 (10.3) | 63.0 (10.7) | 62.5 (10.5) |
| Height (cm)* | 179.7 (6.9) | 165.3 (6.1) | 176.5 (6.7) | 161.9 (6.3) |
| Weight (kg)* | 86.8 (15.0) | 70.1 (6.0) | 90.2 (15.2) | 73.7 (15.4) |
| Spine BMD (g/cm2)* | 1.07 (0.13) | 1.05 (0.13) | 1.07 (0.18) | 0.99 (0.18) |
| Hip BMD (g/cm2)* | 1.08 (0.14) | 0.96 (0.13) | 1.02 (0.15) | 0.89 (0.16) |
| UD BMD (g/cm2)* | 0.53 (0.07) | 0.44 (0.06) | 0.50 (0.08) | 0.41 (0.08) |
| Menopause† | — | 5.9 (41) | — | 41.4 (133) |
Phenotypes are missing for 30 sons, 47 daughters, 52 fathers, and 56 mothers.
Data are unadjusted means (SD).
Data are the percentages of postmenopausal women (number of such women).
MATERIALS AND METHODS
Subjects
The study was approved by the Creighton University Institutional Review Board. Signed informed-consent documents were obtained from all study participants before they entered the study. People with chronic diseases and conditions that might potentially affect bone mass, structure, or metabolism were excluded as detailed before.(3) All of the 1873 participants from 405 nuclear families were U.S. whites of European origin and recruited for BMD study by advertising. The general related characteristics of them are listed in Table 1. The sample composition was the same as our previous study,(3) yielding 1512 sib pairs and 2266 parent-offspring pairs in total.
BMD values at spine, hip, and UD were measured using a Hologic QDR 2000 + or 4500 DXA (Hologic, Bedford, MA, USA). Both machines were calibrated daily. The CV values of the DXA measurements for BMD were 1.87% on Hologic 2000 + and 1.98% on Hologic 4500, respectively. At each skeletal site (spine, hip, or UD), the qualitative osteoporosis phenotype (denoted as “OP”) was defined by low BMD,(4) namely BMD Z scores (adjusted by significant covariates including age, sex, height, and weight) within the lowest 10% of the population distribution. We also defined OP at each site following the WHO criterion of BMD T score less than −2.5 to cross-validate the association results with those obtained from Z scores.
Gene and SNP selection
We determined our list of osteoporosis candidate genes for study on the basis of the following criteria: (1) evidence of significant linkage and/or association from recent studies of osteoporosis, (2) biological significance, namely the chosen genes are involved in osteoblast or osteoclast proliferation, differentiation, and activation in bone-related hormone (e.g., calcitonin, estrogen, steroid, vitamin D) metabolism or calcium homeostasis in vivo or in bone matrix formation or degradation in vivo, and (3) evidence of importance to bone suggested by the functional genomics or molecular genetic studies. The full names of the studied genes are tabulated in Table 2. They were located across 17 chromosomes in humans (Table 3).
Table 2.
Full Names of the 20 Studied Candidate Genes
| Gene symbol | Gene full name | Group* |
|---|---|---|
| ALOX12 | Arachidonate 12-Oxidoreductase | 5 |
| BMP2 | Bone morphogenetic protein 2 | 3 |
| CCR3 | Chemokine receptor 3 | 4 |
| CTR | Calcitonin receptor | 3 |
| CYP17 | 17-α-hydroxylase | 2 |
| CYP19 | Aromatase | 2 |
| DBP | Vitamin D–binding protein | 3 |
| ESR2 | Estrogen receptor-β | 2 |
| GCR | Glucocorticoid receptor | 4 |
| HDC | Histidine decarboxylase | 4 |
| IGF1 | Insulin-like growth factor I | 3 |
| LRP5 | Low-density lipoprotein receptor-related protein 5 | 3 |
| MTHFR | Methylene tetrahydrofolate reductase | 5 |
| OPG | Osteoprotegerin | 1 |
| RANK | Receptor activator of NF-κB | 1 |
| RANKL | Receptor activator of NF-κB ligand | 1 |
| SOST | Sclerostin | 5 |
| TGFB1 | Transforming growth factor β1 | 3 |
| TNF | Tumor necrosis factor α | 1 |
| TNFR2 | Tumor necrosis factor receptor 2 | 1 |
The candidate genes studied could be roughly grouped into five groups according to their roles in bone biology: (1) constituting or regulating RANKL/RANK/OPG signaling pathway, including OPG, RANK, RANKL, TNF, and TNFR2; (2) involved in estrogen metabolism and function, including CYP17, CYP19, and ESR2; (3) regulating calcium homeostasis, namely DBP; mediating the inhibitive effect of calcitonin on bone resorption, namely CTR; or promoting bone formation, including BMP2, IGF1, LRP5, and TGFB1; (4) implicated in a novel pathophysiological mechanism for osteoporosis by our functional genomics research,(42) including CCR3, GCR, and HDC; and (5) decreasing the structural integrity of bone, MTHFR, or negatively regulating bone mass, including ALOX12 and SOST.
Table 3.
Characteristics of 20 Candidate Genes and SNP and Haplotype Results for Spine, Hip, and UD BMD
| Gene symbol | Region | Length (kb) | Exons | SNPs intended | SNPs used | SNPs/kb | Median | D’| | Median r2 | LD blocks | Block coverage* | Highly suggestive† | Suggestive† |
|---|---|---|---|---|---|---|---|---|---|---|---|---|
| MTHFR | 1p36.3 | 21 | 12 | 11 | 5 | 4.7 | 0.99 | 0.05 | 2 | 1.33 | — | — |
| TNFR2 | 1p36.3-p36.2 | 42 | 10 | 16 | 12 | 4.6 | 0.48 | 0.02 | 7 | 1.42 | UD OP | Spine BMD, OP at spine and hip |
| CCR3 | 3p21.3 | 144 | 4 | 18 | 16 | 2.6 | 1.00 | 0.10 | 2 | 0.31 | — | — |
| DBP | 4q12-q13 | 64 | 13 | 15 | 12 | 4.0 | 0.95 | 0.06 | 3 | 0.81 | Spine BMD | BMD at hip and UD |
| GCR | 5q31.3 | 158 | 10 | 49 | 29 | 4.7 | 1.00 | 0.16 | 5 | 0.89 | — | — |
| TNF | 6p21.3 | 3 | 4 | 10 | 7 | 2.4 | 1.00 | 0.07 | 3 | 6.30 | — | — |
| CTR | 7q21.3 | 150 | 13 | 36 | 27 | 5.6 | 0.53 | 0.09 | 7 | 1.05 | — | BMD at hip and UD, spine OP |
| OPG | 8q24 | 29 | 5 | 11 | 9 | 3.9 | 0.94 | 0.20 | 2 | 1.35 | — | — |
| CYP17 | 10q24.3 | 7 | 8 | 7 | 7 | 3.0 | 1.00 | 0.64 | 1 | 3.38 | BMD at spine and hip | UD BMD, UD OP |
| LRP5 | 11q13.4 | 137 | 23 | 41 | 26 | 5.3 | 0.64 | 0.18 | 7 | 1.04 | Spine BMD, spine OP | Hip BMD, OP at hip and UD |
| IGF1 | 12q22-q23 | 85 | 4 | 27 | 19 | 5.1 | 0.98 | 0.16 | 4 | 1.20 | — | — |
| RANKL | 13q14 | 45 | 5 | 13 | 10 | 3.9 | 0.98 | 0.17 | 2 | 0.94 | Hip BMD | Spine BMD |
| ESR2 | 14q23.2 | 254 | 9 | 22 | 17 | 4.3 | 0.98 | 0.47 | 2 | 0.30 | — | — |
| CYP19 | 15q21.1 | 130 | 10 | 33 | 28 | 4.6 | 0.83 | 0.03 | 6 | 1.02 | OP at hip and UD | BMD at spine and UD, spine OP |
| HDC | 15q21-q22 | 24 | 12 | 23 | 11 | 3.6 | 0.68 | 0.12 | 5 | 1.79 | — | UD BMD, OP at spine, |
| hip, and UD | ||||||||||||
| ALOX12 | 17p13.1 | 15 | 14 | 9 | 7 | 1.9 | 1.00 | 0.06 | 1 | 1.00 | — | BMD at hip and UD |
| SOST | 17q12-q21 | 5 | 2 | 7 | 4 | 4.1 | 0.94 | 0.48 | 1 | 4.13 | — | — |
| RANK | 18q22.1 | 66 | 10 | 18 | 18 | 3.5 | 0.48 | 0.06 | 7 | 0.99 | UD BMD, OP at spine, hip, and UD | — |
| TGFB1 | 19q13.2 | 52 | 7 | 9 | 6 | 5.0 | 1.00 | 0.03 | 2 | 0.67 | — | — |
| BMP2 | 20p12.3 | 13 | 3 | 9 | 7 | 3.6 | 0.53 | 0.07 | 4 | 2.24 | UD BMD, UD OP | BMD at spine and hip, hip OP |
| Total or average | — | 1,444 | 8.95 | 384 | 277 | 4.0 | 0.85 | 0.16 | 3.65 | 1.61 | — | — |
Fraction of gene length covered by block defined by genotyped SNPs. Genes entirely within a larger block have block coverage > 1.
Genes were defined as highly suggestive or suggestive significant if any SNP or haplotype showed p ≤ 0.01 or 0.01 < p ≤ 0.05, respectively.
We selected SNPs mainly according to the public information available in dbSNP (genome build 34; http://www.ncbi.nlm.nih.gov/Omim/). An initial list of 384 SNPs in and around our candidate genes was determined on the basis of the following criteria: (1) validation status, especially in whites, (2) an average density of one SNP per 3 kb, (3) degree of heterozygosity (i.e., minor allele frequencies [MAF] > 0.05), (4) functional relevance and importance, and (5) reported to dbSNP by various sources of confirmation. Furthermore, Illumina (San Diego, CA, USA) helped us revise the list by screening all of the SNPs through a proprietary algorithm that predicts performance on the Illumina platform. Our final pre-experiment set of 384 SNPs contained 15 coding SNPs: 10 synonymous and 5 nonsynonymous changes.
Genotyping
Genomic DNA was extracted from whole blood using a commercial isolation kit (Gentra Systems, Minneapolis, MN, USA). DNA concentration was assessed by a DU530 UV/VIS Spectrophotometer (Beckman Coulter, Fullerton, CA, USA). We contracted the genotyping work to Illumina, which conducted high-throughput genotyping using their Integrated BeadArray System. We organized all of the 1932 DNA samples (including duplicates; each delivered for 4 μg with final concentration of 100 ng/μl) into 21 96-well barcoded DNA microtiter plates. Finally, we received 620,308 genotypes from Illumina, each with a quality metric “GC_Score” indicating reliability of genotypes called. The allele frequencies for each SNP were estimated in all the subjects of the nuclear families through a maximum likelihood method implemented in the program SOLAR (http://www.sfbr.org/sfbr/public/software/solar). Hardy-Weinberg equilibrium was tested using the PEDSTATS procedure embedded in Merlin (http://www.sph.umich.edu/csg/abecasis/Merlin/).
According to Illumina, the overall sample success rate, locus success rate, and genotype call rate were 98.24% (1898/1932), 85.16% (327/384), and 99.95% (620,308/620,646), respectively. The reproducibility rate as revealed through blind duplicating was 100%. Of the 327 successfully genotyped SNPs, 50 were discarded (12 were monomorphic, 10 significantly departed from Hardy-Weinberg equilibrium [HWE] at the p < 0.01 level among parents and 28 had MAF < 5%). The GC_Scores across all SNP genotypes ranged from 0.53 to 0.97, with a mean ± SD of 0.86 ± 0.08. Thus, we incorporated a total of 277 (84.7%) of the original 327 Illumina-produced SNPs into the final analyses. The detailed information of all the 277 SNPs is shown in Table A1 (available online at http://orclinux.creighton.edu/donghai.htm).
PedCheck(5) was used to check Mendelian consistency of SNP genotype data, and any inconsistent genotypes were removed. The error checking option embedded in Merlin(6) was run to identify and disregard the genotypes flanking excessive recombinants, further reducing genotyping errors. Less than 0.02% of the overall 525,483 genotypes analyzed (<105) were omitted because of the violation of any of the above two rules.
Statistical analysis
Population haplotypes and their frequencies were inferred for each of the 20 genes using PHASE v2.1.1 (http://www.stat.washington.edu/stephens/software.html) software among the group of 703 unrelated parents. Based on the inferred haplotype data, we used HaploBlockFinder (http://cgi.uc.edu/cgi-bin/kzhang/haploBlockFinder.cgi) to identify block structures and select haplotype-tagging SNPs (htSNPs) of each candidate gene.(7) To generate graphical representation of linkage disequilibrium (LD) structure as measured by |D’|, we adopted the program Haploview(8) (http://www.broad.mit.edu/mpg/haploview/index.php), which yielded similar haplotype block structures compared with HaploBlockFinder.
We conducted family-based association test (FBAT)(9,10) (http://biosun1.harvard.edu/~fbat/fbat.htm) for (1) the quantitative trait BMD residuals adjusted by significant covariates including age, sex, height, and weight and (2) the qualitative OP phenotypes defined by the criteria of Z or T scores. The reason of studying OP is that genes controlling low BMD in families that are significant enough to cause osteoporotic fracture may have no effect on normal BMD variation(11) and therefore will be missed if only BMD is studied. Simultaneously testing associations with both BMD and OP will thus deepen our understanding of the bone effects of the studied genes. The haplotype version of FBAT (HBAT)(12) was performed to obtain empirical global p values for single SNP and haplotype markers (with adjustment for all possible alleles or haplotypes) by means of the Monte-Carlo permutation procedures implemented in HBAT (10,000 permutations were conducted). Haplotype analyses were conducted in two ways: (1) using sliding windows defined by four SNPs consecutively across each gene and (2) using haplotypes constructed by htSNPs that are selected by HaploBlockFinder. Adopting both approaches may better exploit the information contained in haplotypes. In addition, we conducted the global association test between marker genotypes at each SNP locus with the studied phenotypes using the –g flag in FBAT. All of the above statistical procedures were also done in the male and female subsamples separately to detect the potential sex linked bone effects of the studied genes.
It is difficult to correct the complex multiple testing issues in this study because of the biological interdependence of the selected candidate genes and the various correlations (LD) over all the SNPs. Therefore, we chose to rank the results for each phenotype separately by empirical global p values following a recent study of the same nature.(13) The genes with any marker (SNP or haplotype) having empirical global p values in the range of (0.01, 0.05) or ≤0.01 were defined as “suggestive” or “highly suggestive,” respectively, for the corresponding phenotypes.
We used the multifactor dimensionality reduction (MDR; http://www.epistasis.org) method to test for potential high-order gene–gene interactions(14) influencing OP risk and thereby to provide specific interaction models for further confirmation. Briefly, MDR first pooled multilocus genotypes with high dimensions into only one dimension; it combined “cross-validation” and “permutation-testing” procedures to minimize false-positive results and evaluate the model fitness by multiple examination of the data.(14) Cross-validation consistency and prediction error were calculated for each combination of a pool of genetic polymorphisms. The final best model was selected as the one having the maximal cross-validation consistency and minimal prediction error. If the two criteria could not be met simultaneously, the model meeting any one of the criteria and involving the fewest loci/factors was chosen as the best. The statistical significance was assessed by comparing the average prediction error from the observed data with the distribution of average prediction errors under the null hypothesis of no associations derived empirically from 1000 permutations. The null hypothesis was rejected when the permutation-derived Monte Carlo p ≤ 0.05.
In this study, to generate a balanced case-control sample used in MDR, we selected 143 cases and 143 controls from the 405 families. All of the 286 subjects were independent in terms of family relatedness. Cases were the subjects having OP at any of the three studied skeletal sites (spine, hip, and UD). Here, cases were defined based on all the skeletal sites instead of separately at each site as in FBAT. Such an approach had the advantage of increasing the number of cases to improve the power of MDR while also being feasible in osteoporosis research. Controls were the subjects having no OP at any of the skeletal sites examined.
We applied 137 htSNPs representing the 20 genes (see Descriptive analyses) into the MDR analyses. Because true effects can be overwhelmed when many markers are analyzed, we adopted the staged approach to study the extremely large amount of combinations among the 137 loci. First we tested interactions using MDR within each of the five gene groups (Table 2) separately; the markers of the best model from each group were selected to build the final cross-group model. The much reduced number of markers for the final MDR analysis guarantees reasonable power to detect potential gene–gene interaction effects. To exclude the possibility that the significant final best models for each group identified by MDR represent only the gene–gene joint effects driven by the main effects from the component loci instead of the epistatic interactions, conditional logistic regression was performed using SPSS (version 13.0 for windows). If an interaction term is not significant (p > 0.05) by logistic regression, the corresponding significant MDR interaction model could be simply caused by the additive main effects from the component loci.
RESULTS
Descriptive analyses
Table 3 summarizes the characteristics of the 20 candidate genes. These genes range in size from 3 to 254 kb, and the range of the number of SNPs per gene was 4–29, with an average of 14 SNPs per gene and an average density of one SNP per 4.0 kb. We summarized the information for all of the 277 analyzed SNPs such as their names, cytogenetic position, locations on dbSNP build 34, and MAF into Table A1. The average heterozygosity across all the 277 SNPs was 0.37 and their MAFs were approximately uniformly distributed (see Figure A1, available online at http://orclinux.creighton.edu/donghai.htm), showing that our selected SNPs were informative.
We identified 137 htSNPs representing 73 blocks across the 20 genes in total. SNPs that could not be classified into any LD block containing more than one SNP were considered as a separate block of size 1 (there were 20 such “orphan” SNPs in our data set). The average length of the 53 blocks composed of more than one SNP was 18.1 kb, ranging from 2.5 to 106.4 kb. The average number of blocks per gene was 3.7, and the range was one to seven blocks per gene. We plotted graphs of pairwise LD values and haplotype block delineations for each gene in Figure A2 (available online at http://orclinux.creighton.edu/donghai.htm).
Association analyses in the total sample
Figures 1–3 show the empirical global p values for single SNP and haplotype sliding window (defined by four SNPs consecutively across each gene) analyses for all of the 277 SNPs for BMD variation at the three studied skeletal sites, respectively. For spine BMD, the highly suggestive genes were DBP and LRP5, whereas the suggestive genes were TNFR2, BMP2, CYP19, and RANKL (Table 3; Fig. 1). For hip BMD, RANKL was highly suggestive, whereas BMP2, LRP5, CTR, and DBP were suggestive (Table 3; Fig. 2). For UD BMD, the highly suggestive genes were BMP2 and RANK, whereas the suggestive genes were DBP, CYP19, HDC, ALOX12, CYP17, and CTR (Table 3; Fig. 3). Detailed illustrations of BMD associations with each of the above genes are presented in Fig. 4. Among the significant genes for BMD variations, association results of haplotype blocks defined by the LD structures were similar to those yielded by analyses of single SNPs and haplotype sliding windows (Fig. 4). Within each highly suggestive BMD genes, multiple markers showed empirical global p ≤ 0.05, with the most significant markers giving p ≤ 0.01. Specifically, in the DBP gene, the most significant p = 0.003 was for spine BMD; in LRP5, the most significant p = 0.005 was for spine BMD. In RANKL, the most significant p = 0.001 was for hip BMD. In BMP2, the most significant p = 0.0005 was for UD BMD; in RANK, the most significant p = 0.009 was for UD BMD (Fig. 4).
FIG. 1.

Association results for spine BMD using single SNP markers and haplotype windows. Empirical global p values from HBAT analyses are calculated after 10,000 permutations. Triangles, SNP results; bold lines, 4-SNP haplotype sliding window results. Any suggestive significant results (p ≤ 0.05) were marked with associated genes.
FIG. 3.
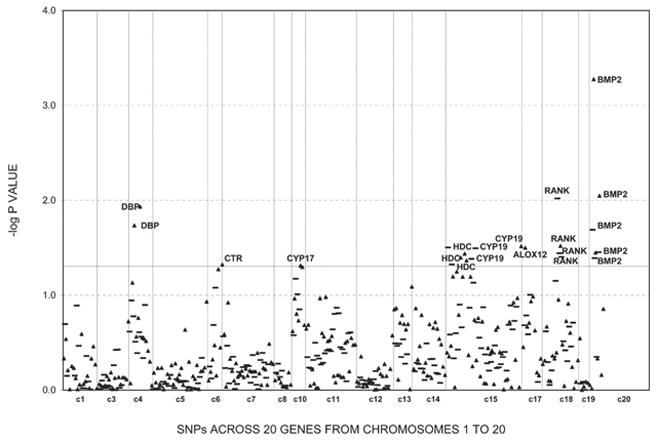
Association results for UD BMD using single SNP markers and haplotype windows. Empirical global p values from HBAT analyses are calculated after 10,000 permutations. Triangles, SNP results; bold lines, 4-SNP haplotype sliding window results. Any suggestive significant results (p ≤ 0.05) were marked with associated genes.
FIG. 2.
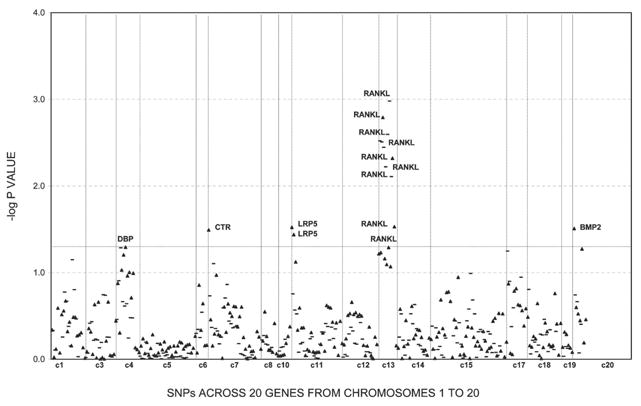
Association results for hip BMD using single SNP markers and haplotype windows. Empirical global p values from HBAT analyses are calculated after 10,000 permutations. Triangles, SNP results; bold lines, 4-SNP haplotype sliding window results. Any suggestive significant results (p ≤ 0.05) were marked with associated genes.
FIG. 4.
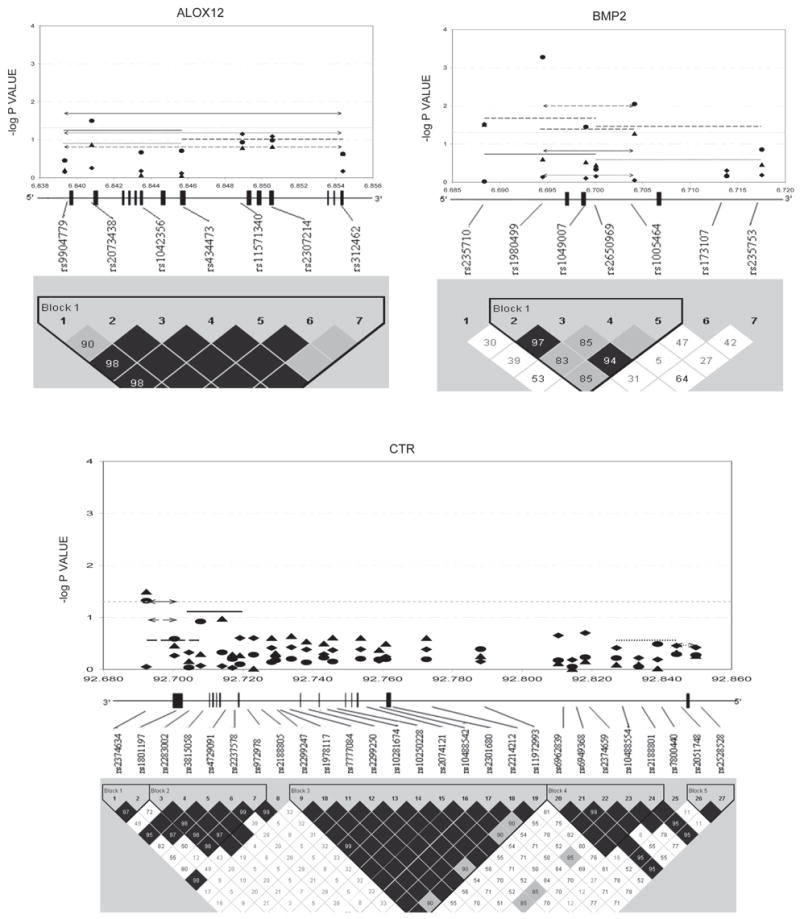
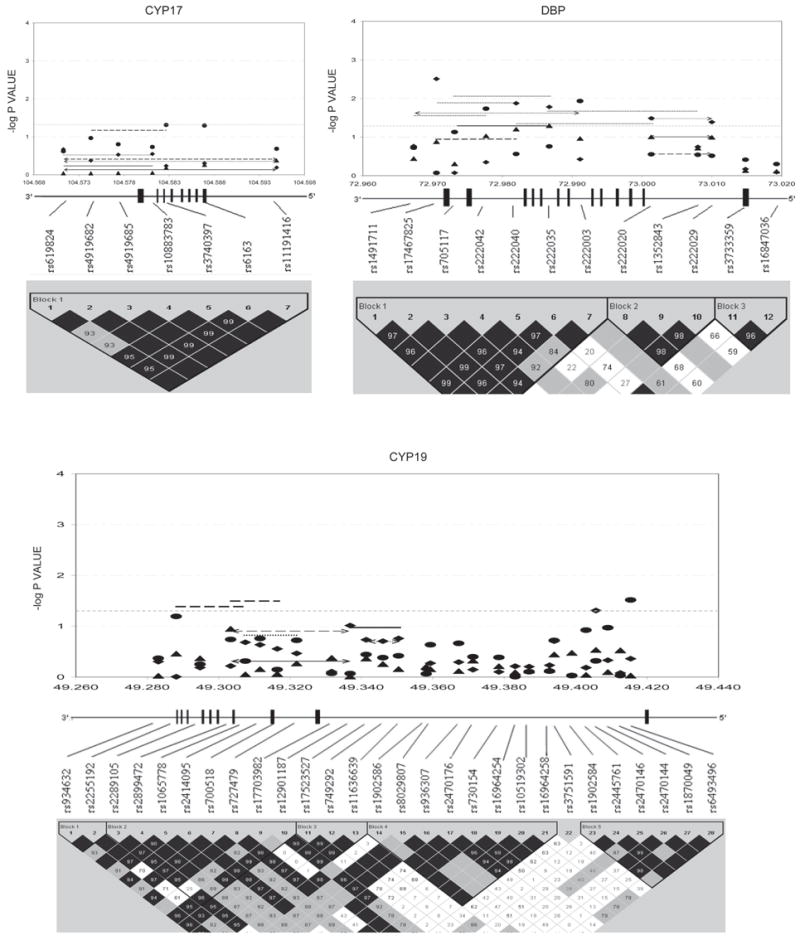

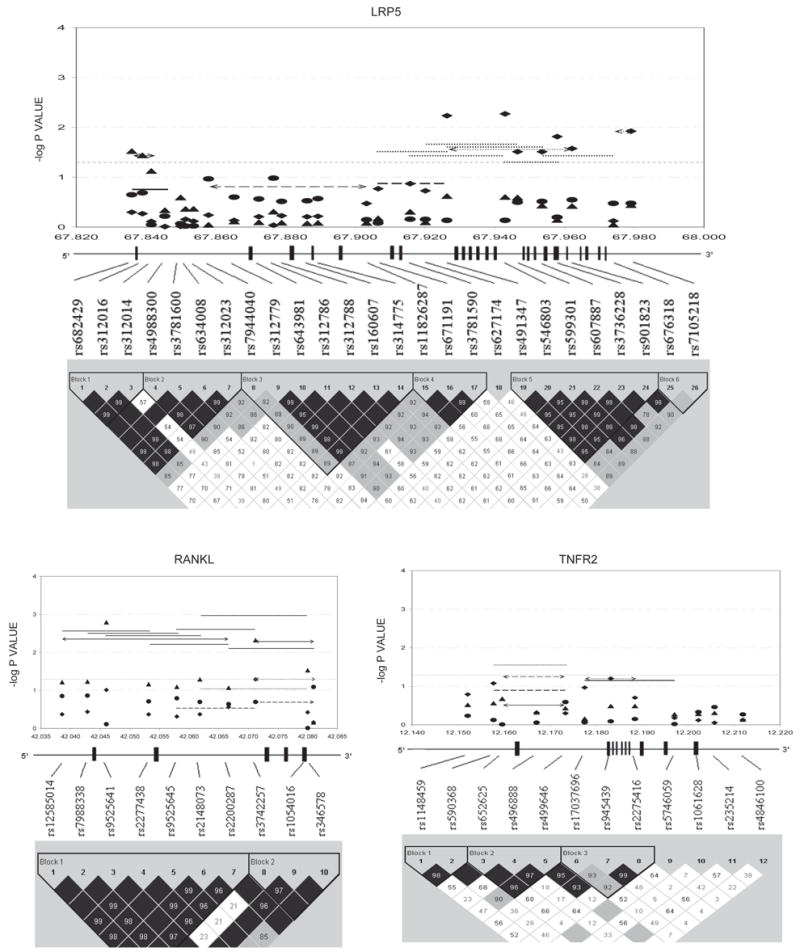
Gene-specific results for BMD variation. Empirical global p values are plotted. For spine BMD: SNP, diamond; haplotype window, dotted line; haplotype, dotted line with arrow. For hip BMD: SNP, triangle; haplotype window, solid line; haplotype, solid line with arrow. For UD BMD: SNP, circle; haplotype window, long-dashed line; haplotype, long-dashed line with arrow. Only haplotypes with suggestive evidence (−log p ≥ 1.3, i.e., p ≤ 0.05) or haplotypes showing best signals (if no significant haplotypes exist) were plotted. x-axes were in the unit of megabases; vertical bars represent exons.
Family-based association tests for the qualitative osteoporosis phenotype (OP) detected 8 significant genes (Table 4), which were among the list of 11 significant genes for BMD phenotypes. The association results for OP defined by either Z score or T score were the same. Briefly, for spine OP, LRP5 and RANK were highly suggestive, whereas CTR, CYP19, HDC, and TNFR2 were suggestive; for hip OP, CYP19 and RANK were highly suggestive, whereas BMP2, HDC, LRP5, and TNFR2 were suggestive; for UD OP, BMP2, CYP19, RANK, and TNFR2 were highly suggestive, whereas CYP17, HDC, and LRP5 were suggestive.
Table 4.
Association to OP as a Qualitative Trait at Spine, Hip, and UD in HBAT Analyses
| Empirical global p value† |
Empirical global p value
|
||||||||
|---|---|---|---|---|---|---|---|---|---|
| Marker ID | Component SNP(s)* | Spine OP | Hip OP | UD OP | Marker ID | Component SNP(s) | Spine OP | Hip OP | UD OP |
| BMP2_SNP7 | rs235753 | 0.130 | 0.050 | 0.005 | LRP5_SW4 | LRP5_4–7 | 0.018 | 0.092 | 0.096 |
| LRP5_SW5 | LRP5_5–8 | 0.015 | 0.056 | 0.050 | |||||
| CTR_SNP1 | rs2374634 | 0.050 | 0.183 | 0.086 | LRP5_SW6 | LRP5_6–9 | 0.010 | 0.032 | 0.053 |
| CTR_SNP2 | rs1801197 | 0.049 | 0.150 | 0.104 | LRP5_SW7 | LRP5_7–10 | 0.023 | 0.090 | 0.096 |
| CTR_SNP3 | rs2283002 | 0.034 | 0.118 | 0.096 | LRP5_Block2 | LRP5_4–7 | 0.050 | 0.163 | 0.216 |
| CYP17_SW1 | CYP17_1–4 | 0.068 | 0.061 | 0.032 | RANK_SNP1 | rs4941125 | 0.024 | 0.009 | 0.004 |
| RANK_SNP2 | rs7235803 | 0.131 | 0.049 | 0.025 | |||||
| CYP19_SNP2 | rs2255192 | 0.028 | 0.014 | 0.074 | RANK_SNP4 | rs8086340 | 0.001 | 0.00097 | 0.002 |
| CYP19_SNP3 | rs2289105 | 0.044 | 0.044 | 0.040 | RANK_SNP7 | rs11664594 | 0.00017‡ | 0.00014‡ | 0.00026‡ |
| CYP19_SNP10 | rs12901187 | 0.102 | 0.037 | 0.060 | RANK_SNP10 | rs4303637 | 0.086 | 0.106 | 0.022 |
| CYP19_SNP11 | rs17523527 | 0.033 | 0.007 | 0.010 | RANK_SNP15 | rs9646629 | 0.174 | 0.192 | 0.044 |
| CYP19_SNP12 | rs749292 | 0.047 | 0.015 | 0.020 | RANK_SNP16 | rs884205 | 0.092 | 0.094 | 0.016 |
| CYP19_SNP13 | rs11636639 | 0.045 | 0.018 | 0.019 | RANK_SNP17 | rs2957127 | 0.148 | 0.158 | 0.037 |
| CYP19_SNP24 | rs2445761 | 0.068 | 0.050 | 0.153 | RANK_SW1 | RANK_1–4 | 0.001 | 0.00033‡ | 0.00087 |
| CYP19_SNP26 | rs2470144 | 0.092 | 0.030 | 0.098 | RANK_SW2 | RANK_2–5 | 0.015 | 0.014 | 0.021 |
| CYP19_SW7 | CYP19_7–10 | 0.090 | 0.030 | 0.206 | RANK_SW3 | RANK_3–6 | 0.009 | 0.009 | 0.006 |
| CYP19_SW8 | CYP19_8–11 | 0.050 | 0.017 | 0.014 | RANK_SW4 | RANK_4–7 | 0.002 | 0.002 | 0.00035‡ |
| CYP19_SW9 | CYP19_9–12 | 0.011 | 0.003 | 0.006 | RANK_SW5 | RANK_5–8 | 0.001 | 0.00057‡ | 0.00032‡ |
| CYP19_SW10 | CYP19_10–13 | 0.022 | 0.007 | 0.006 | RANK_SW6 | RANK_6–9 | 0.00042‡ | 0.00031‡ | 0.00092 |
| CYP19_SW11 | CYP19_11–14 | 0.077 | 0.023 | 0.029 | RANK_SW7 | RANK_7–10 | 0.001 | 0.00030‡ | 0.00045‡ |
| CYP19_SW13 | CYP19_13–16 | 0.084 | 0.035 | 0.054 | RANK_SW9 | RANK_9–12 | 0.019 | 0.028 | 0.007 |
| RANK_SW10 | RANK_10–13 | 0.004 | 0.005 | 0.00093 | |||||
| HDC_SNP1 | rs10519263 | 0.064 | 0.030 | 0.044 | RANK_SW12 | RANK_12–15 | 0.010 | 0.019 | 0.012 |
| HDC_SNP2 | rs1802536 | 0.055 | 0.024 | 0.031 | RANK_SW13 | RANK_13–16 | 0.023 | 0.031 | 0.028 |
| HDC_SNP10 | rs12901373 | 0.024 | 0.015 | 0.016 | RANK_SW14 | RANK_14–17 | 0.016 | 0.025 | 0.016 |
| HDC_SNP11 | rs2114447 | 0.023 | 0.014 | 0.017 | RANK_Block1 | RANK_1–3 | 0.091 | 0.043 | 0.029 |
| RANK_Block2 | RANK_4–5 | 0.004 | 0.004 | 0.006 | |||||
| LRP5_SNP1 | rs682429 | 0.017 | 0.050 | 0.082 | RANK_Block3 | RANK_6–7 | 0.00009‡ | 0.00009‡ | 0.00004‡ |
| LRP5_SNP2 | rs312016 | 0.019 | 0.050 | 0.079 | RANK_Block5 | RANK_10–14 | 0.004 | 0.005 | 0.001 |
| LRP5_SNP4 | rs4988300 | 0.023 | 0.055 | 0.096 | |||||
| LRP5_SNP6 | rs634008 | 0.008 | 0.035 | 0.040 | TNFR2_SW5 | TNFR2_5–8 | 0.033 | 0.017 | 0.003 |
| LRP5_SNP7 | rs312023 | 0.008 | 0.027 | 0.034 | TNFR2_SW6 | TNFR2_6–9 | 0.085 | 0.046 | 0.053 |
Only those genes having markers suggestively significant for OP (10,000 permutation-derived empirical global p ≤ 0.05) in at least one skeletal site are listed.
For single SNPs, the corresponding cell in this column shows its dbSNP rs number; for haplotype sliding window (SW), the cell shows the component SNPs of the window (e.g., CYP17_1–4 means the window consists of SNP1,2,3,4 of CYP17); for haplotype block, the cell shows all the SNPs within the block.
p values are obtained by 10,000-time permutations. p ≤ 0.05 are in boldface italic.
p values significant after Bonferroni correction by the number of independent LD blocks (single-test threshold α = 0.0007).
Overlapping genes significant for both BMD and OP were also found at each skeletal site. In summary, at the spine, LRP5 was highly suggestive, whereas CYP19 and TNFR2 were suggestive for BMD and OP; at the hip, BMP2 and LRP5 met the suggestive criterion for BMD and OP; at the UD, BMP2 and RANK were highly suggestive, whereas CYP17, CYP19, and HDC were suggestive for both traits. Within the same genes, the SNPs that were associated with BMD were usually different from those associated with OP, with the exception of LRP5 (SNP1 and 2 were suggestive for both BMD and OP at hip) and HDC (SNP10 and 11 were suggestive for both BMD and OP at UD). However, when considering three kinds of markers together (SNPs, haplotype windows, and blocks), at each skeletal site, the BMD-associated and OP-associated regions overlap for most of the BMD- and OP-double significant genes (Table 4; Fig. 4).
For the three studied BMD phenotypes, the global genotypic association results at each SNP locus (data not shown) matched very well with nearly all the results of the global allelic association tests, with the exception of CYP17. In CYP17, its SNP1 to SNP5 were all significant for BMD variation at the spine and hip, with global genotypic p values ranging from 0.002 to 0.032 for spine and from 0.004 to 0.027 for hip. However, the corresponding global allelic p values were >0.05 for those marker–phenotype combinations (Fig. 4). For the OP phenotypes studied at the three skeletal sites, all of the global genotypic association results were consistent with the global allelic association results.
In total, we found four, four, and four genes that were highly suggestive for BMD and/or OP (BMD/OP) at the spine, hip, and UD, respectively. At the suggestive significance level, there were an additional six, seven, and six significant genes for BMD/OP at the spine, hip, and UD, respectively (Table 5). All of the 11 significant genes could play a role in BMD regulation and/or OP risk at multiple skeletal sites (Table 5). We also compared our candidate gene findings with previous reports in Table 5.
Table 5.
Candidate Gene Findings for BMD/OP at Spine, Hip, and UD in the Context of Previous Studies
| Highly suggestive (p ≤ 0.01)
|
No evidence (p > 0.10)
|
Suggestive (0.01 < p ≤ 0.05) |
||||||||||||
|---|---|---|---|---|---|---|---|---|---|---|---|---|---|---|
| Prior association supported
|
New report of association
|
Prior association not supported
|
Prior association supported
|
New report of association
|
||||||||||
| Spine | Hip | UD | Spine | Hip | UD | Spine | Hip | UD | Spine | Hip | UD | Spine | Hip | UD |
| DBP | CYP19 | CYP19 | RANK | — | BMP2 | TNF | MTHFR | — | BMP2 | BMP2 | DBP | HDC | ALOX12 | ALOX12 |
| LRP5 | RANK | RANK | TNF | CTR | CTR | LRP5 | RANKL | DBP | CTR | |||||
| CYP17 | RANKL | TNFR2 | CYP19 | LRP5 | HDC | CYP17 | ||||||||
| CYP17 | TNFR2 | TNFR2 | HDC | |||||||||||
Sex-stratified association analyses
The significant association results of the analyses in the male and female subsamples for BMD and OP were tabulated in Tables A2 and A3 separately (available online at http://orclinux.creighton.edu/donghai.htm) and summarized in Table 6. At the spine, the significant associations of CTR and RANKL with either BMD variation or OP phenotype observed in the total sample were mainly driven by the male subjects; the associations for ALOX12, BMP2, DBP, HDC, and TNFR2 were mainly driven by the female subjects; and the associations for CYP19, LRP5, and RANK were present in both male and female subsamples. At the hip, the associations of ALOX12, BMP2, CYP19, LRP5, and TNFR2 with BMD or OP phenotypes observed in the total sample were mainly driven by the female subjects, and the associations of CTR, HDC, RANK, and RANKL with hip phenotypes were present in both male and female subjects. At the UD, the associations of ALOX12, CTR, and RANKL with BMD or OP were mainly driven by the male subjects; the associations for CYP17, DBP, LRP5, and TNFR2 were mainly driven by the female subjects; and the associations for BMP2, CYP19, HDC, and RANK were observed in both males and females. In addition, IGF1 polymorphisms were significantly associated with BMD variations at the spine and hip only in men, whereas CCR3 polymorphisms were significantly associated with BMD variations at the spine, hip, and UD only in females. The associations of either IGF1 or CCR3 with bone phenotypes cannot be found in the total sample.
Table 6.
Candidate Gene Associations for BMD/OP at Spine, Hip, and UD in the Male and Female Subsamples Separately
| Category | Spine | Hip | UD |
|---|---|---|---|
| Male-specific | CTR* | IGF1†‡ | ALOX12† |
| IGF1†‡ | CTR* | ||
| RANKL*† | RANKL* | ||
| Female-specific | ALOX12† | ALOX12† | CCR3†‡ |
| BMP2† | BMP2† | CYP17† | |
| CCR3†‡ | CCR3†‡ | DBP† | |
| DBP† | CYP19* | LRP5*† | |
| HDC* | LRP5*† | TNFR2* | |
| TNFR2*† | TNFR2*† | ||
| Significant in both male and female subsamples | CYP19 | CTR | BMP2 |
| LRP5 | HDC | CYP19 | |
| RANK | RANK | HDC | |
| RANKL | RANK |
Significant for the OP phenotype at the corresponding skeletal site.
Significant for the BMD variation at the corresponding skeletal site.
Significant only in the sex-specific subsamples, not in the total sample.
Gene by gene interaction analyses
MDR was run to detect gene–gene effects influencing OP risk for both within- and cross-group models. All of the best models identified were significant (p ≤ 0.05 at least). The best within-group models were RANK4, TNFR2_10, and TNFR2_12; CYP17_1, ESR2_4, and ESR2_10; BMP2_7 and DBP3; GCR9, GCR29, and HDC10; and ALOX12_2 and SOST1 from groups 1–5, respectively. The final cross-group best model was GCR9 and ESR2_4 (Table 7). To evaluate whether the above gene–gene effects are caused by epistatic interactions, conditional logistic regression analyses were conducted. The results supported the significant gene–gene interactions for the best models in group 1 (i.e., RANK4, TNFR2_10, and TNFR2_12), group 4 (i.e., GCR9, GCR29, and HDC10), and the final group (i.e., GCR9 and ESR2_4); the p values for the interaction terms of the group 1, group 4, and the final group were 0.012, 0.022, and 0.047, respectively; the ORs (high risk versus low risk) for the corresponding models were 1.2, 1.1, and 1.3, respectively. The potential gene–gene interactions for the best models of groups 2, 3, and 5 were not supported by the conditional logistic regression analysis. Interestingly, the HBAT analysis among all of the 405 nuclear families for the interacting loci identified by MDR found the significant global association with OP risk for haplotypes reconstructed on the basis of the best cross-group model (GCR9 and ESR2_4; namely rs6188–rs1256061 combination, p = 0.021). Two individual haplotypes defined by these two loci were also associated with OP risk (p = 0.0026 and 0.050, respectively, for haplotype AA and CA of GCR9 and ESR2_4). Therefore, the gene–gene interaction of the best cross-group model suggested by MDR was supported by both conditional logistic regression and HBAT.
Table 7.
Within-Group and Cross-Group Best Gene–Gene Effect Models for OP Identified by MDR Method
| Loci number | Group | 1 | 2 | 3 | 4 | 5 | Final |
|---|---|---|---|---|---|---|---|
| 2-locus | Loci combination | TNF7, TNFR2_1 | CYP19_4, ESR2_6 | [BMP2_7, DBP3] | HDC7, HDC10 | [ALOX12_2, SOST1] | [GCR9, ESR2_4]* |
| CV consistency | 10 | 10 | 10 | 10 | 10 | 10 | |
| Prediction error (%) | 38.27† | 36.97‡ | 35.32‡ | 36.82‡ | 36.82‡ | 34.55‡ | |
| 3-locus | Loci combination | [RANK4, TNFR2_10 TNFR2_12]*, | [CYP17_1, ESR2_4, ESR2_10] | CALCR1, CALCR24, LRP5_4 | [GCR9, GCR29, HDC10]* | MTHFR3, MTHFR4, SOST1 | ALOX12_2, GCR29, HDC10 |
| CV consistency | 10 | 10 | 9 | 10 | 8 | 10 | |
| Prediction error (%) | 37.86‡ | 35.59§ | 35.17‡ | 33.68§ | 39.46‡ | 35.02§ | |
| 4-locus | Loci combination | RANK10, RANKL8, TNFR2_4, TNFR2_12 | CYP17_4, CYP19_10, CYP19_24, ESR2_6 | CALCR1, BMP2_1, BMP2_2, LRP5_4 | CCR3_2, CCR3_7, GCR1, GCR29 | ALOX12_1, ALOX12_2, MTHFR1, SOST1 | BMP2_7, CYP17_1, RANK4, TNFR2_12 |
| CV consistency | 9 | 9 | 9 | 9 | 9 | 10 | |
| Prediction error (%) | 36.1‡ | 36.76‡ | 34.13§ | 38.81‡ | 35.33§ | 35.48‡ |
In each group, the best gene–gene effect models regardless of the number of interacting loci are shown in brackets.
The best models that were validated for interaction effects by conditional logistic regression implemented in SPSS.
Empirical p > 0.05 on the basis of 1000 permutations.
Empirical p value in the range of (0.01, 0.05) on the basis of 1000 permutations.
Empirical p ≤ 0.01 on the basis of 1000 permutations.
DISCUSSION
To our best knowledge, this study is the first comprehensive study of the allelic, haplotypic, genotypic association, and gene–gene interaction of a large group of osteoporosis candidate genes. This study also had a number of strengths with regard to minimizing the limitations often afflicting association studies in osteoporosis. First, given the sample size adopted, this study has ~90% power to detect association assuming a marker is in strong LD (r2 > 0.8) with a functional mutation locus that accounts for ≥2% of phenotypic variation.(3) Second, we performed the family-based association study for both quantitative BMD measurements and dichotomous OP phenotypes at various skeletal sites. In the genetic research of either osteoporosis(4) or other complex diseases such as obesity and hypertension,(15) studying both the major predicative quantitative trait and its related dichotomous qualitative phenotype is gradually becoming common. Third, the experimental errors had been controlled to a very low level according to the Illumina report. Fourth, multianalytic approaches were adopted to facilitate interpreting our findings and comparing with previous work. Fifth, we achieved much greater coverage than previously reported for the majority of the studied candidate genes. Across the 20 genes, an average of ~14 SNPs were analyzed per gene; the average density of one SNP for 4 kb was achieved; almost every gene and its proximal regulatory regions (5′-promoter, 3′-untranslated region [3′-UTR]) were fully covered by LD blocks detectable with the studied SNPs. In addition, our LD findings provided valuable information about the LD structures across the 20 studied osteoporosis candidate genes for the white population of European origin. We found the mean block size to be 18.1 kb in our population with the working SNP density of 4 kb, which is smaller than the previous reported size of 22 kb in the European population.(16) This may be because of the more sparse SNP density of 7.8 kb genotyped in their study.(16) Finally, we studied the potential complex gene–gene interactions influencing OP using a large number of tagging SNPs. Additional significant insights were gained in such interaction analyses as shown.
Prioritization
There is currently no appropriate and established method to correct for the highly correlated tests in our study. One suggestion is to adjust for multiple testing by the number of LD blocks,(17) and this approach has been used in practice.(13) Given the assumption that 73 blocks identified for the 20 genes represent independent information, the corrected single-test threshold may be α = 0.05/73 = 0.0007 for experiment-wide significance at the α = 0.05 level. SNP2 in BMP2 (rs1980499) met this stringent criterion for UD BMD (Fig. 4); SNP7 in RANK (rs11664594) and its associated haplotype windows and block 3 reached this level for OP at the spine, hip, and UD simultaneously (Table 4). In addition, haplotype window 1 of RANK covering SNP1 to SNP4 reached the strict threshold for hip OP (RANK_SW1; Table 4). However, the above adjustment could be too strict to allow for the identification of significant association signals. To best present and explain our results, we ranked our findings according to the empirical global p values and focused on highly suggestive genes. Whereas there may still be false-positive results, our approaches provide a relatively comprehensive and reliable list of novel osteoporosis candidate genes prioritized by their significance levels for further replication and functionality studies.
Genes experiment-wide significant for BMD/OP phenotypes
We found that BMP2 block 1 was highly suggestive for UD BMD; particularly, the SNP2 of BMP2 reached the experiment-wide significance level (Fig. 4). BMP2 is biologically important to bone because of its crucial role in bone formation and osteoblast differentiation. It was reported as a susceptibility gene for osteoporotic fractures and low BMD in Icelandic and Danish populations.(11) Because SNP2 lies in the proximal promoter region of BMP2, its variants per se or highly correlated (i.e., in strong LD) functional variants could influence the mRNA transcription rate of BMP2, which may finally affect UD BMD variation in whites. In addition, we detected the highly suggestive association between SNP7 of BMP2 with UD OP (Table 4). Residing within 3′-UTR, SNP7 variants may directly or indirectly influence the mRNA stability of BMP2, similar to the role of 3′-UTR functional polymorphisms within the VDR gene.(18)
Another experiment-wide significant gene is RANK, which is the central regulator of osteoclast development and function, bone resorption, and calcium homeostasis. The unanimous experiment-wide significant associations of SNP7 and its related haplotypes with OP risk at the spine, hip, and UD strongly support the existence of nearby causal functional loci that may lie within the exon 3/intron 3 boundary or exon 3, whose causal alleles could result in abnormal RANK mRNA splicing or protein structure and ultimately lead to increased OP risk independent of skeletal sites. Taken together, it is clear that the surrounding areas of SNP7 should be thoroughly studied to dissect out the associated causal variants of RANK.
Genes highly suggestive for BMD/OP
Two genes important to estrogen biosynthesis, CYP17 and CYP19, were highly suggestive for BMD and OP at various skeletal sites. The CYP17 gene encodes cytochrome P450c17α—the enzyme with both 17α-hydroxylase and 17,20-lyase activities crucial for the biosynthesis of gonadal hormones like estrogens and androgens, which have beneficial effects on bone remodeling. Deleterious mutations in CYP17 can cause retarded skeletal growth and diffuse osteoporosis.(19) The genotypes of T27-C (also denoted as -34TC) in the 5′-UTR of CYP17 had been associated with BMD.(20,21) Although that SNP was not directly studied here, the highly suggestive associations between the genotypes of CYP17 SNPs 1–4 with spine and hip BMD (empirical global genotypic p values ranged from 0.002 to 0.004) still lent some support to the previous studies, because the entire CYP17 gene is actually in one block (Fig. 4). The data from ours and others all suggested that the genetic effects of CYP17 on BMD variations at spine and hip may be dominant or recessive instead of additive.
The CYP19 gene encodes the aromatase enzyme that converts androgens into estrogens and is crucial for normal bone development. Two commonly studied CYP19 polymorphisms are (1) the TTTA repeat polymorphism in intron 4 and (2) the silent polymorphism (GA at Val80) in exon 3. These two polymorphisms were in nearly complete LD (|D’| = 0.98)(22) and previously associated with osteoporosis risk(23) and BMD at the total hip, hip component sites, or radius.(22,24) The Val80 polymorphism was also analyzed in this study, which is SNP7 (rs700518) and suggestively significant for hip OP (CYP19_SW7; Table 4). The highly suggestive polymorphisms for OP at hip and UD in our study were SNP11 (rs17523527) and its associated haplotypes within the 5′-UTR. (The translation of CYP19 starts from exon 2. The CYP19 5′-UTR contains at least nine variants of exon 1 and spans the region from SNP9 to SNP28 in this study. For simplicity, we only showed the most distant exon 1 that is ~90 kb upstream from exon 2 in Fig. 4.) The association evidence of CYP19 5′-UTR polymorphisms with osteoporosis phenotypes has emerged recently.(22,25,26) The underlying mechanism could be related to the differences in CYP19 transcription rate caused by the hidden functional variants.
DBP and LRP5 met the highly suggestive criterion for spine BMD/OP in this study. DBP is a key factor for regulating calcium homeostasis. Interestingly, the highly suggestive DBP haplotype window 3 (DBP_SW3) in block 1 contains the (TAAA)(n)-Alu polymorphism that was previously associated with the same trait, spine BMD, in the same ethnic group, whites.(27,28) In addition, we detected a novel highly suggestive variant, SNP2 (rs17467825; Fig. 4), within the 3′-UTR of the DBP gene. This SNP could be in strong LD with causal functional variants (or be such variant per se) affecting the mRNA stability of DBP, similar to the recently identified role of VDR 3′-UTR polymorphisms in influencing both VDR mRNA stability and osteoporotic fracture risk.(18)
LRP5 encodes a transmembrane protein mediating WNT–β-catenin signaling pathway important in the regulation of bone metabolism. Its block 5 polymorphisms were highly suggestive for spine BMD variation (Fig. 4). The block 5 region ranged from intron 7 to intron 19 and contained a number of spine BMD–associated polymorphisms reported before.(29–33) We also identified a new 3′-UTR polymorphism (SNP26; rs7105218) of LRP5 that nearly reached the highly suggestive threshold for spine BMD (Fig. 4), the functionality of which may also resemble the VDR 3′-UTR polymorphisms.(18) In addition, two polymorphisms in intron 1, SNP6 (rs634008) and SNP7 (rs312023), showed highly suggestive association with spine OP (Table 4), which was partially supported by a previously study.(31)
RANKL is essential for osteoclastogenesis by binding and activating RANK. Highly suggestive associations with hip BMD were detected for two RANKL SNPs (SNP3 and 8, namely rs9525641 and rs3742257) and all of the RANKL haplotypes (Fig. 4). The recently reported SNP rs9594782 that was highly significant for extremely low hip BMD(4) was localized to the block 1 of RANKL and near SNP3—the most and highly significant SNP for hip BMD in this study. No prior reports studied RANKL block 2 region, whose polymorphisms were also highly suggestive for hip BMD as shown by us (Fig. 4). The ubiquitous highly suggestive associations of RANKL with hip BMD indicate that the gene-based replication and functional analysis is needed to unravel the causal variants within RANKL.
TNFR2 is critical for mediating the effect of TNF-α on osteoclastogenesis. In TNFR2, we detected a haplotype window, TNFR2_SW5, that was highly suggestive for UD OP (Table 4). This window included two BMD-associated variants reported by others: exon 6 T676G and intron 4 CA repeat polymorphisms.(34,35) It was also suggested that the haplotype containing the specific alleles of those two loci may define low BMD phenotype.(35) All of those lent support to our finding in TNFR2.
Other findings in relation to previous studies
In addition to the highly suggestive results, the suggestive findings, either replicating previous ones or being reported for the first time, were also tabulated in Table 5. For example, the prior associations of the BMP2 and CTR genes with BMD/OP phenotypes at spine and hip(11,36,37) were mainly supported by the BMP2 SNP1 (rs235710) within the 5′-promoter region and the CTR SNP1 (rs2374634) within the 3′-UTR (Table 4; Fig. 4); the significance of the LRP5 gene to BMD/OP phenotypes at hip and UD(32,33,38,39) was mainly supported by SNP6 (rs634008) and SNP7 (rs312023) of LRP5 (Table 4). Among the novel suggestive findings, the most notable ones were the associations of the HDC and ALOX12 genes with BMD/OP at multiple skeletal sites (Table 5). HDC is the only enzyme for the synthesis of human histamine,(40) which can stimulate osteoclastogenesis and osteoclast activity. A high level of circulating histamine was associated with osteoporosis and excessive bone resorption.(41) Our recent functional genomics study also showed that the expression of the HDC gene was significantly upregulated in subjects with low BMD.(42) Here we supported those findings by showing the polymorphisms of HDC, especially SNP10 (rs12901373) and SNP11 (rs2114447) in the promoter region that may influence HDC gene expression, were associated with OP risk at all of the three skeletal sites and BMD variation at UD. Another gene, ALOX12, in humans is functionally similar to the mouse ALOX15 gene because both encode the enzyme of 12/15-lipoxygenase (12/15-LO). ALOX15 has been established as an important regulator of peak bone mass in mice, suggesting the same bone effect of ALOX12 in human.(43) This study first reported the associations of ALOX12 markers with human BMD variations at hip and UD. Specifically, the haplotype block covering the entire ALOX12 gene was associated with hip BMD, whereas SNP2 (rs2073438) in the intron1/exon2 boundary of ALOX12 was associated with UD BMD. These results partially supported the speculation that ALOX12 may be a human BMD regulatory gene.(1,43)
Because associations with p values in the 0.05–0.10 range may reflect lack of power rather than lack of replication, no evidence of association was defined according to the criterion of p > 0.10 for all of the tests of a specific gene–phenotype combination. We found no support for two previous associations based on our data (Table 5). First, the significant associations between TNF polymorphisms with spine and hip BMD variations observed previously(44,45) were not supported. However, those studies had very small sample sizes and did not control for population stratification. In addition, their subjects were white women at specific physiological stages such as postmenopause and puberty. Therefore, the lack of replication may reflect that the prior associations were false positive or population specific. Second, the association between MTHFR with hip BMD in whites(46) was not observed. However, this discrepancy was easy to explain because the bone effects of MTHFR depend on folate status,(46) for which we did not measure. Ignoring such gene–environment interaction could cause lack of power to detect the effect of MTHFR on hip BMD variation.
Sex-specific associations
The best examples of sex-specific associations were the associations of IGF1 and CCR3 with BMD variations only in men and women, respectively. Interestingly, we previously showed that the gene expression of CCR3 was significantly upregulated in women with low BMD.(42) However, the male-specific association pattern of IGF1 with BMD is not supported by the previous literature because the IGF1 gene promoter CA repeat polymorphism has been associated with BMD in both men and women.(1) This may be because of the lack of strong correlation between our testing markers within IGF1 and the promoter CA repeat polymorphism. Because we only genotyped one IGF1 SNP in its ~10-kb promoter region, it is very likely that the CA repeat polymorphism was not captured in our marker set. This suggested that our sex-specific results have limitations and should be taken with caution.
Gene–gene interactions for OP
The most promising gene–gene interaction detected was that between GCR and ESR2. It was identified from the cross-group models and further confirmed by conditional logistic regression and HBAT. The accumulation of findings across all analyses indicated the existence of epistatic interaction between GCR and ESR2 influencing OP risk. Biological studies also shed some light on explaining this interaction model. In bone, glucocorticoids induce bone resorption, whereas estrogens inhibit it. Therefore, GCR and ESR2 play counteracting yet critical roles in bone metabolism. More interestingly, it has been shown that the molecular cross-talk between the GCR and ESR signaling pathways exists because the in vivo levels of GCR are downregulated by ESR-dependent proteasomal degradation.(47) Thus, the different genotype combinations from these two genes, if representing part of the GCR–ESR cross-talk, could result in different GCR regulation of downstream gene transcriptions associated with different bone effects. Taken together, the statistical and biological evidence all supported the existence of GCR–ESR2 epistatic interaction on OP risk.
The other two interactions, one between RANK and TNFR2 and the other between GCR and HDC, were the significant best models within their respective groups. The biological nature of these two gene–gene interactions that may influence OP risk is not clear and remains an interpretive challenge. Nevertheless, our data provided some clues for future studies.
Other pertinent issues
Several issues and limitations of this study should be considered. First, although the SNP density and block coverage are already very high (Table 3), we concede that not all of the genetic variants of the 20 selected genes were studied. An exhaustive representation of all the possible common variants within those genes will be feasible in the near future by the use of HapMap (http://www.hapmap.org) tag-SNPs.(48) Examining the HapMap tagSNPs that are not in strong LD with our studied SNPs and haplotypes (r2 < 0.8) can close the coverage gaps when conducting further studies on those genes among whites.
Second, similar to any other candidate gene studies on complex diseases/traits, this work only reveals part of the whole genetic architecture underlying the etiology of osteoporosis. With the nearly completion of the International HapMap Project and the rapid improvements in high-throughput SNP genotyping technology, the ultimate solution to completely understanding the genetic basis of osteoporosis may come from the genome-wide association approach in which a dense set of tagSNPs across the whole human genome is genotyped to survey the common genetic variation for a role in osteoporosis or the related heritable quantitative traits such as BMD. This study, however, represents a precursor to the genome-wide association studies of osteoporosis.
Third, despite the overlapping significant genes for both BMD and OP at each studied skeletal site, the association outcomes for BMD and OP did not completely match. For example, RANK was experiment-wide significant for OP at spine and hip but not significant for BMD at those two skeletal sites (Table 4, Fig. 4). On the other hand, RANKL was highly suggestive significant for hip BMD but not significant for hip OP (Table 4, Fig. 4). These results supported the recent notion that genes controlling low BMD in families that are significant enough to cause osteoporotic fracture (OF) are not necessarily the same as those that control the normal BMD variation in families.(11) Another prior notion—that there are common and specific genetic factors underlying determination of BMD or OP in various skeletal sites(49)—was also supported (Fig. 4). Both of these notions were also supported by the sex-stratified analyses (Tables A2 and A3), implying that (1) different association pattern of a given gene with BMD and OP may not be a function of sex and (2) genetic variants influencing BMD or OP at various distinct skeletal sites exist in both men and women.
Fourth, the best epistatic effect detected for OP is that between GCR and ESR2—two genes in different yet related signaling pathways and having no main effects individually as shown by FBAT and HBAT (p values for all the markers of GCR and ESR2 were > 0.05). This is not surprising because both theoretical and empirical studies showed the existence of epistasis without any independent main effects.(15) In the research of human diseases such as breast cancer, atrial fibrillation, type 2 diabetes, and hypertension, the statistically significant evidence for epistasis in the absence of detectable independent main effects of any one polymorphism was found.(15) Therefore, such a phenomenon does not seem to be exception in the genetic etiology of human complex diseases.(15) Our examples suggested that some candidate genes may exert their bone effects only through interactions with other genes in either the same or related molecular pathways.
The prioritized 11 genes, plus the gene–gene interactions detected in this study, deserve further study to confirm their importance to OP. In addition, the general importance of these genes to BMD variation and/or OP risk may need to be evaluated in other nonwhite populations. Other important topics such as gene–environment interactions and parent-of-origin effects regarding these genes are also worth pursuing. Eventually, functional genomics and molecular genetics approaches are needed to improve the understanding of the underlying mechanisms driving the statistically significant evidence from the epidemiological studies.
Acknowledgments
Investigators of this work were partially supported by grants from NIH (R01 AR050496, K01 AR02170-01, R01 AR45349-01, and R01 GM60402-01A1) and an LB595 grant from the State of Nebraska. The study also benefited from grants from National Science Foundation of China, Huo Ying Dong Education Foundation, HuNan Province, Xi’an Jiaotong University, and the Ministry of Education of China.
Footnotes
The authors state that they have no conflicts of interest.
References
- 1.Niu T, Rosen CJ. The insulin-like growth factor-I gene and osteoporosis: A critical appraisal. Gene. 2005;361:38–56. doi: 10.1016/j.gene.2005.07.016. [DOI] [PubMed] [Google Scholar]
- 2.Deng HW, Mahaney MC, Williams JT, Li J, Conway T, Davies KM, Li JL, Deng H, Recker RR. Relevance of the genes for bone mass variation to susceptibility to osteoporotic fractures and its implications to gene search for complex human diseases. Genet Epidemiol. 2002;22:12–25. doi: 10.1002/gepi.1040. [DOI] [PubMed] [Google Scholar]
- 3.Xiong DH, Liu YZ, Liu PY, Zhao LJ, Deng HW. Association analysis of estrogen receptor alpha gene polymorphisms with cross-sectional geometry of the femoral neck in Caucasian nuclear families. Osteoporos Int. 2005;16:2113–2122. doi: 10.1007/s00198-005-2011-4. [DOI] [PubMed] [Google Scholar]
- 4.Hsu YH, Niu T, Terwedow HA, Xu X, Feng Y, Li Z, Brain JD, Rosen CJ, Laird N, Xu X. Variation in genes involved in the RANKL/RANK/OPG bone remodeling pathway are associated with bone mineral density at different skeletal sites in men. Hum Genet. 2006;118:568–577. doi: 10.1007/s00439-005-0062-4. [DOI] [PubMed] [Google Scholar]
- 5.O’Connell JR, Weeks DE. PedCheck: A program for identification of genotype incompatibilities in linkage analysis. Am J Hum Genet. 1998;63:259–266. doi: 10.1086/301904. [DOI] [PMC free article] [PubMed] [Google Scholar]
- 6.Abecasis GR, Cherny SS, Cookson WO, Cardon LR. Merlin—rapid analysis of dense genetic maps using sparse gene flow trees. Nat Genet. 2002;30:97–101. doi: 10.1038/ng786. [DOI] [PubMed] [Google Scholar]
- 7.Zhang K, Jin L. HaploBlockFinder: Haplotype block analyses. Bioinformatics. 2003;19:1300–1301. doi: 10.1093/bioinformatics/btg142. [DOI] [PubMed] [Google Scholar]
- 8.Barrett JC, Fry B, Maller J, Daly MJ. Haploview: Analysis and visualization of LD and haplotype maps. Bioinformatics. 2005;21:263–265. doi: 10.1093/bioinformatics/bth457. [DOI] [PubMed] [Google Scholar]
- 9.Horvath S, Xu X, Laird NM. The family based association test method: Strategies for studying general genotype–phenotype associations. Eur J Hum Genet. 2001;9:301–306. doi: 10.1038/sj.ejhg.5200625. [DOI] [PubMed] [Google Scholar]
- 10.Laird NM, Horvath S, Xu X. Implementing a unified approach to family-based tests of association. Genet Epidemiol. 2000;19(Suppl 1):S36–S42. doi: 10.1002/1098-2272(2000)19:1+<::AID-GEPI6>3.0.CO;2-M. [DOI] [PubMed] [Google Scholar]
- 11.Styrkarsdottir U, Cazier JB, Kong A, Rolfsson O, Larsen H, Bjarnadottir E, Johannsdottir VD, Sigurdardottir MS, Bagger Y, Christiansen C, Reynisdottir I, Grant SF, Jonasson K, Frigge ML, Gulcher JR, Sigurdsson G, Stefansson K. Linkage of osteoporosis to chromosome 20p12 and association to BMP2. PLoS Biol. 2003;1:E69. doi: 10.1371/journal.pbio.0000069. [DOI] [PMC free article] [PubMed] [Google Scholar]
- 12.Horvath S, Xu X, Lake SL, Silverman EK, Weiss ST, Laird NM. Family-based tests for associating haplotypes with general phenotype data: Application to asthma genetics. Genet Epidemiol. 2004;26:61–69. doi: 10.1002/gepi.10295. [DOI] [PubMed] [Google Scholar]
- 13.Fallin MD, Lasseter VK, Avramopoulos D, Nicodemus KK, Wolyniec PS, McGrath JA, Steel G, Nestadt G, Liang KY, Huganir RL, Valle D, Pulver AE. Bipolar I Disorder and Schizophrenia: A 440-Single-Nucleotide Polymorphism Screen of 64 Candidate Genes among Ashkenazi Jewish Case-Parent Trios. Am J Hum Genet. 2005;77:918–936. doi: 10.1086/497703. [DOI] [PMC free article] [PubMed] [Google Scholar]
- 14.Ritchie MD, Hahn LW, Roodi N, Bailey LR, Dupont WD, Parl FF, Moore JH. Multifactor-dimensionality reduction reveals high-order interactions among estrogen-metabolism genes in sporadic breast cancer. Am J Hum Genet. 2001;69:138–147. doi: 10.1086/321276. [DOI] [PMC free article] [PubMed] [Google Scholar]
- 15.Moore JH. Computational analysis of gene-gene interactions using multifactor dimensionality reduction. Expert Rev Mol Diagn. 2004;4:795–803. doi: 10.1586/14737159.4.6.795. [DOI] [PubMed] [Google Scholar]
- 16.Gabriel SB, Schaffner SF, Nguyen H, Moore JM, Roy J, Blumenstiel B, Higgins J, DeFelice M, Lochner A, Faggart M, Liu-Cordero SN, Rotimi C, Adeyemo A, Cooper R, Ward R, Lander ES, Daly MJ, Altshuler D. The structure of haplotype blocks in the human genome. Science. 2002;296:2225–2229. doi: 10.1126/science.1069424. [DOI] [PubMed] [Google Scholar]
- 17.Nyholt DR. A simple correction for multiple testing for single-nucleotide polymorphisms in linkage disequilibrium with each other. Am J Hum Genet. 2004;74:765–769. doi: 10.1086/383251. [DOI] [PMC free article] [PubMed] [Google Scholar]
- 18.Fang Y, van Meurs JB, d’Alesio A, Jhamai M, Zhao H, Rivadeneira F, Hofman A, van Leeuwen JP, Jehan F, Pols HA, Uitterlinden AG. Promoter and 3′-untranslated-region haplotypes in the vitamin d receptor gene predispose to osteoporotic fracture: The rotterdam study. Am J Hum Genet. 2005;77:807–823. doi: 10.1086/497438. [DOI] [PMC free article] [PubMed] [Google Scholar]
- 19.Yanase T, Simpson ER, Waterman MR. 17 alpha-hydroxylase/17,20-lyase deficiency: From clinical investigation to molecular definition. Endocr Rev. 1991;12:91–108. doi: 10.1210/edrv-12-1-91. [DOI] [PubMed] [Google Scholar]
- 20.Yamada Y, Ando F, Shimokata H. Association of polymorphisms in CYP17A1, MTP, and VLDLR with bone mineral density in community-dwelling Japanese women and men. Genomics. 2005;86:76–85. doi: 10.1016/j.ygeno.2005.03.005. [DOI] [PubMed] [Google Scholar]
- 21.Tofteng CL, Abrahamsen B, Jensen JE, Petersen S, Teilmann J, Kindmark A, Vestergaard P, Gram J, Langdahl BL, Mosekilde L. Two single nucleotide polymorphisms in the CYP17 and COMT Genes–relation to bone mass and longitudinal bone changes in postmenopausal women with or without hormone replacement therapy. The Danish Osteoporosis Prevention Study. Calcif Tissue Int. 2004;75:123–132. doi: 10.1007/s00223-004-0176-z. [DOI] [PubMed] [Google Scholar]
- 22.Lorentzon M, Swanson C, Eriksson AL, Mellstrom D, Ohlsson C. Polymorphisms in the aromatase gene predict areal BMD as a result of affected cortical bone size: The GOOD Study. J Bone Miner Res. 2006;21:332–339. doi: 10.1359/JBMR.051026. [DOI] [PubMed] [Google Scholar]
- 23.Somner J, McLellan S, Cheung J, Mak YT, Frost ML, Knapp KM, Wierzbicki AS, Wheeler M, Fogelman I, Ralston SH, Hampson GN. Polymorphisms in the P450 c17 (17-hydroxylase/17,20-Lyase) and P450 c19 (aromatase) genes: Association with serum sex steroid concentrations and bone mineral density in postmenopausal women. J Clin Endocrinol Metab. 2004;89:344–351. doi: 10.1210/jc.2003-030164. [DOI] [PubMed] [Google Scholar]
- 24.Dick IM, Devine A, Prince RL. Association of an aromatase TTTA repeat polymorphism with circulating estrogen, bone structure, and biochemistry in older women. Am J Physiol Endocrinol Metab. 2005;288:E989–E995. doi: 10.1152/ajpendo.00550.2004. [DOI] [PubMed] [Google Scholar]
- 25.Zarrabeitia MT, Hernandez JL, Valero C, Zarrabeitia AL, Garcia-Unzueta M, Amado JA, Gonzalez-Macias J, Riancho JA. A common polymorphism in the 5′-untranslated region of the aromatase gene influences bone mass and fracture risk. Eur J Endocrinol. 2004;150:699–704. doi: 10.1530/eje.0.1500699. [DOI] [PubMed] [Google Scholar]
- 26.Riancho JA, Zarrabeitia MT, Valero C, Sanudo C, Hernandez JL, Amado JA, Zarrabeitia A, Gonzalez-Macias J. Aromatase gene and osteoporosis: Relationship of ten polymorphic loci with bone mineral density. Bone. 2005;36:917–925. doi: 10.1016/j.bone.2005.01.004. [DOI] [PubMed] [Google Scholar]
- 27.Al-oanzi ZH, Tuck SP, Varanasi SS, Raj N, Harrop JS, Summers GD, Cook DB, Francis RM, Datta HK. (TAAA)(n)-Alu element polymorphism in vitamin D binding protein gene and its association with bone density and osteoporosis in men. J Bone Miner Res. 2004;19:S249. [Google Scholar]
- 28.Papiha SS, Allcroft LC, Kanan RM, Francis RM, Datta HK. Vitamin D binding protein gene in male osteoporosis: Association of plasma DBP and bone mineral density with (TAAA)(n)-Alu polymorphism in DBP. Calcif Tissue Int. 1999;65:262–266. doi: 10.1007/s002239900695. [DOI] [PubMed] [Google Scholar]
- 29.Ferrari SL, Deutsch S, Choudhury U, Chevalley T, Bonjour JP, Dermitzakis ET, Rizzoli R, Antonarakis SE. Polymorphisms in the low-density lipoprotein receptor-related protein 5 (LRP5) gene are associated with variation in vertebral bone mass, vertebral bone size, and stature in whites. Am J Hum Genet. 2004;74:866–875. doi: 10.1086/420771. [DOI] [PMC free article] [PubMed] [Google Scholar]
- 30.Ferrari SL, Deutsch S, Baudoin C, Cohen-Solal M, Ostertag A, Antonarakis SE, Rizzoli R, de Vernejoul MC. LRP5 gene polymorphisms and idiopathic osteoporosis in men. Bone. 2005;37:770–775. doi: 10.1016/j.bone.2005.06.017. [DOI] [PubMed] [Google Scholar]
- 31.Koller DL, Ichikawa S, Johnson ML, Lai D, Xuei X, Edenberg HJ, Conneally PM, Hui SL, Johnston CC, Peacock M, Foroud T, Econs MJ. Contribution of the LRP5 gene to normal variation in peak BMD in women. J Bone Miner Res. 2005;20:75–80. doi: 10.1359/JBMR.041019. [DOI] [PubMed] [Google Scholar]
- 32.Koay MA, Woon PY, Zhang Y, Miles LJ, Duncan EL, Ralston SH, Compston JE, Cooper C, Keen R, Langdahl BL, MacLelland A, O’Riordan J, Pols HA, Reid DM, Uitterlinden AG, Wass JA, Brown MA. Influence of LRP5 polymorphisms on normal variation in BMD. J Bone Miner Res. 2004;19:1619–1627. doi: 10.1359/JBMR.040704. [DOI] [PubMed] [Google Scholar]
- 33.Bollerslev J, Wilson SG, Dick IM, Islam FM, Ueland T, Palmer L, Devine A, Prince RL. LRP5 gene polymorphisms predict bone mass and incident fractures in elderly Australian women. Bone. 2005;36:599–606. doi: 10.1016/j.bone.2005.01.006. [DOI] [PubMed] [Google Scholar]
- 34.Xu H, Zhao LJ, Lei SF, Li MX, Sun X, Deng FY, Jiang DK, Deng HW. The (CA)n polymorphism of the TNFR2 gene is associated with peak bone density in Chinese nuclear families. J Hum Genet. 2005;50:301–304. doi: 10.1007/s10038-005-0249-5. [DOI] [PubMed] [Google Scholar]
- 35.Spotila LD, Rodriguez H, Koch M, Tenenhouse HS, Tenenhouse A, Li H, Devoto M. Association analysis of bone mineral density and single nucleotide polymorphisms in two candidate genes on chromosome 1p36. Calcif Tissue Int. 2003;73:140–146. doi: 10.1007/s00223-002-2079-1. [DOI] [PubMed] [Google Scholar]
- 36.Tsai FJ, Chen WC, Chen HY, Tsai CH. The ALUI calcitonin receptor gene polymorphism (TT) is associated with low bone mineral density and susceptibility to osteoporosis in post-menopausal women. Gynecol Obstet Invest. 2003;55:82–87. doi: 10.1159/000070179. [DOI] [PubMed] [Google Scholar]
- 37.Braga V, Sangalli A, Malerba G, Mottes M, Mirandola S, Gatti D, Rossini M, Zamboni M, Adami S. Relationship among VDR (BsmI and FokI), COLIA1, and CTR polymorphisms with bone mass, bone turnover markers, and sex hormones in men. Calcif Tissue Int. 2002;70:457–462. doi: 10.1007/s00223-001-1088-9. [DOI] [PubMed] [Google Scholar]
- 38.Mizuguchi T, Furuta I, Watanabe Y, Tsukamoto K, Tomita H, Tsujihata M, Ohta T, Kishino T, Matsumoto N, Minakami H, Niikawa N, Yoshiura K. LRP5, low-density-lipoprotein-receptor-related protein 5, is a determinant for bone mineral density. J Hum Genet. 2004;49:80–86. doi: 10.1007/s10038-003-0111-6. [DOI] [PubMed] [Google Scholar]
- 39.Ezura Y, Urano T, Nakajima T, Sudo Y, Yoshida H, Suzuki T, Hosoi T, Inoue S, Shiraki M, Emi M. Association of single nucleotide polymorphisms in the low density lipoprotein receptor-related protein 5 gene (LRP5) with bone mineral density of adult women. J Bone Miner Res. 2004;19:S247. [Google Scholar]
- 40.Fitzpatrick LA, Buzas E, Gagne TJ, Nagy A, Horvath C, Ferencz V, Mester A, Kari B, Ruan M, Falus A, Barsony J. Targeted deletion of histidine decarboxylase gene in mice increases bone formation and protects against ovariectomy-induced bone loss. Proc Natl Acad Sci USA. 2003;100:6027–6032. doi: 10.1073/pnas.0934373100. [DOI] [PMC free article] [PubMed] [Google Scholar]
- 41.Graves L, III, Stechschulte DJ, Morris DC, Lukert BP. Inhibition of mediator release in systemic mastocytosis is associated with reversal of bone changes. J Bone Miner Res. 1990;5:1113–1119. doi: 10.1002/jbmr.5650051104. [DOI] [PubMed] [Google Scholar]
- 42.Liu YZ, Dvornyk V, Lu Y, Shen H, Lappe JM, Recker RR, Deng HW. A novel pathophysiological mechanism for osteoporosis suggested by an in vivo gene expression study of circulating monocytes. J Biol Chem. 2005;280:29011–29016. doi: 10.1074/jbc.M501164200. [DOI] [PubMed] [Google Scholar]
- 43.Klein RF, Allard J, Avnur Z, Nikolcheva T, Rotstein D, Carlos AS, Shea M, Waters RV, Belknap JK, Peltz G, Orwoll ES. Regulation of bone mass in mice by the lipoxygenase gene Alox15. Science. 2004;303:229–232. doi: 10.1126/science.1090985. [DOI] [PubMed] [Google Scholar]
- 44.Wennberg P, Nordstrom P, Lorentzon R, Lerner UH, Lorentzon M. TNF-alpha gene polymorphism and plasma TNF-alpha levels are related to lumbar spine bone area in healthy female Caucasian adolescents. Eur J Endocrinol. 2002;146:629–634. doi: 10.1530/eje.0.1460629. [DOI] [PubMed] [Google Scholar]
- 45.Fontova R, Gutierrez C, Vendrell J, Broch M, Vendrell I, Simon I, Fernandez-Real JM, Richart C. Bone mineral mass is associated with interleukin 1 receptor autoantigen and TNF-alpha gene polymorphisms in post-menopausal Mediterranean women. J Endocrinol Invest. 2002;25:684–690. doi: 10.1007/BF03345101. [DOI] [PubMed] [Google Scholar]
- 46.McLean RR, Karasik D, Selhub J, Tucker KL, Ordovas JM, Russo GT, Cupples LA, Jacques PF, Kiel DP. Association of a common polymorphism in the methylenetetrahydrofolate reductase (MTHFR) gene with bone phenotypes depends on plasma folate status. J Bone Miner Res. 2004;19:410–418. doi: 10.1359/JBMR.0301261. [DOI] [PubMed] [Google Scholar]
- 47.Kinyamu HK, Archer TK. Estrogen receptor-dependent proteasomal degradation of the glucocorticoid receptor is coupled to an increase in mdm2 protein expression. Mol Cell Biol. 2003;23:5867–5881. doi: 10.1128/MCB.23.16.5867-5881.2003. [DOI] [PMC free article] [PubMed] [Google Scholar]
- 48.de Bakker PI, Yelensky R, Pe’er I, Gabriel SB, Daly MJ, Altshuler D. Efficiency and power in genetic association studies. Nat Genet. 2005;37:1217–1223. doi: 10.1038/ng1669. [DOI] [PubMed] [Google Scholar]
- 49.Nguyen TV, Howard GM, Kelly PJ, Eisman JA. Bone mass, lean mass, and fat mass: Same genes or same environments? Am J Epidemiol. 1998;147:3–16. doi: 10.1093/oxfordjournals.aje.a009362. [DOI] [PubMed] [Google Scholar]