Abstract
Purpose
Clinical and 3D dosimetric parameters are associated with symptomatic radiation pneumonitis rates in retrospective studies. Such parameters include: mean lung dose (MLD), radiation (RT) dose to perfused lung (via SPECT), and pre-RT lung function. Based on prior publications, we defined pre-RT criteria hypothesized to be predictive for later development of pneumonitis. We herein prospectively test the predictive abilities of these dosimetric/functional parameters on two cohorts of patients from Duke and the Netherlands Cancer Institute (NKI).
Methods and Materials
For the Duke cohort, 55 eligible patients treated between 1999-2005 on a prospective IRB-approved study to monitor RT-induced lung injury were analyzed. A similar group of patients treated at the NKI between 1996-2002 were identified. Patients believed to be at high and low risk for pneumonitis were defined based on: a) MLD; b) OpRP (sum of predicted perfusion reduction based on regional dose response curve); and c) pre-RT DLCO. All doses reflected tissue density heterogeneity. The rates of grade ≥2 pneumonitis in the “presumed” high and low risk groups were compared using Fisher’s exact test.
Results
In the Duke group, pneumonitis rates in patients prospectively deemed to be at “high” vs. “low” risk are 7/20 and 9/35, respectively; p=0.33 one tailed Fisher’s. Similarly, comparable rates for the NKI group are 4/21 and 6/44, respectively, p=0.41 one-tailed Fisher’s.
Conclusion
The prospective model is unable to accurately segregate patients into high vs. low risk groups. However, considered retrospectively, these data are consistent with prior studies suggesting that dosimetric (e.g. MLD) and functional (e.g. PFTs or SPECT) parameters are predictive for RT-induced pneumonitis. Additional work is needed to better identify, and prospectively assess, predictors of RT-induced lung injury.
Keywords: Radiation pneumonitis, Predictive models, Dose-volume histogram, Function, Lung cancer
INTRODUCTION
Radiation (RT)-induced shortness of breath occurs in approximately 5-30% of patients receiving thoracic RT for lung cancer [1-8]. Despite the large number of patients receiving thoracic RT, there are currently no validated and standardized means of predicting an individual patient’s the risk of developing pulmonary toxicity. We and others have developed predictive models based primarily on dosimetric parameters such as the mean lung dose (MLD). Indeed, the rates of pneumonitis appear to increase with MLD in several, largely retrospective, trials [2-6, 8]. Further, our data suggest that predictive models are improved if they consider both the three-dimensional (3D) dose distribution plus the pre-RT functional state [9]. Based on this, we developed a physiologic-based method to identify patients who we believe are at relatively high risk of developing clinical relevant pulmonary symptoms, based on 3D dosimetric parameters and pre-RT pulmonary function.
It is the purpose of the current study to evaluate this physiologic-based method in patients with lung cancer. Therefore, we first derived a model using the same dataset and method as previously described by Lind, selecting only the lung cancer subset [9]. Subsequently, we prospectively tested this approach in a new cohort of patients treated at Duke as well as in a separate group of patients treated at the Netherlands Cancer Institute. The rate of symptoms in the groups considered being at high vs. low risk was compared in order to assess the accuracy of the predictive model. Further, alternative dosimetric-based models are considered.
METHODS AND MATERIALS
Eligibility and patient population
Between 1991 and 2005, 340 patients were enrolled into a prospective clinical study at Duke to assess RT-induced lung injury. Informed consent was obtained from all patients. Patients were eligible if they were about to receive thoracic RT for primary or metastatic disease to the thorax, with a minimum life expectancy of six months. Patients unable to give consent, with a history of prior RT, or who were planned to have thoracic surgery after RT, were not eligible. As part of this study, patients had pre- and post-RT assessments of lung function including symptom assessment, pulmonary function tests, computed tomography (CT) and single-photon emission computed tomography (SPECT) lung perfusion imaging.
In an analysis performed in 1999, based on 162 (62 had lung cancer and SPECT imaging) evaluable patients treated between 1991 and 1999, the risk of symptomatic radiation-induced lung injury appeared to be best predicted by a model considering the three-dimensional dose distribution and pre-RT pulmonary function tests [9]. Based on that analysis, and other published data [3-5, 8], we defined criteria to prospectively identify patients who were believed to be at increased risk for RP (criteria defined below).
Since that analysis, 94 additional patients have been enrolled onto our study. Fifty-five of these 94 patients with lung cancer are evaluable with a minimum of 6-month post-RT follow-up. Thirty-nine patients were excluded from the analysis for the following reasons: death within six months after RT-18, intrathoracic disease progression within six months after RT-8, pulmonary emboli-1, pleural effusion-1, post-RT surgery-3, hard to score patients-5 (tumor regrowth, exacerbation of preexisting lung disease, and infection), discontinued treatment due to the bilateral diaphragmatic nerve paralysis-1, and no SPECT imaging-2. In order to assess the utility of these predictive models, the previously retrospective-defined predictive factors were tested in the new 55 evaluable patients.
Further, the model was also tested in a separate group of 65 patients treated for lung cancer at the NKI. These patients had medically inoperable or locally advanced disease treated between 1996 and 2002. Other inclusion criteria were a minimum 6-month post-RT follow-up, good prognostic criteria (weight loss less than 10% and ECOG performance status ≤2), and availability of CT and SPECT data before RT.
The demographic information for the initial 62 patients who were treated at Duke, the second Duke cohort of 55 evaluable patients, and the NKI group are shown in Table 1.
Table 1.
Clinical characteristics for three groups: Initial patients treated at Duke (1991-1999) and the two newer groups from Duke (1999-2005), and the NKI (1996-2002)
| Characteristics | Duke (%) (n=55) 1999-2005 | NKI (%) (n=65) 1996-2002 | Duke (%) (n=62) 1991-1999 |
|---|---|---|---|
| Mean age (range) | 64 (46-81) | 72 (48-86) | 62 (40-87) |
| Gender (female/male) | 23/32 | 15/50 | 26/36 |
| Histology | |||
| Non-small cell | 45 (82) | 65 (100) | 57 (92) |
| Small cell | 10 (18) | - | 5 (8) |
| Stage | |||
| I-II | 2 (4) | 28 (43) | 16 (26) |
| III-IV | 48 (87) | 37 (57) | 41 (66) |
| Recurrent | 5 (9) | - | 5 (8) |
| Predicted baseline PFTs, % | |||
| Mean FEV1 (range) | 68 (21-127) | 63 (17-121) | 62 (17-121) |
| Mean DLCO (range) | 74 (28-129) | 70 (20-128) | 65 (23-114) |
Treatment and pre and post-RT evaluations
The treatment parameters for the three groups of patients are summarized in Table 2. At both Duke and the NKI, the patients underwent CT and SPECT imaging in the treatment position, and PFTs, before RT as previously described [10, 11]. Clinical evaluation to assess for RT-induced pulmonary symptoms was performed approximately 1.5, 3, 6, 9, and 12 months post-RT, then at 6-month intervals.
Table 2.
Treatment characteristics for three groups: Initials patients treated at Duke (1991-1999),and the two newer groups from Duke (1999-2005), and the NKI (1996-2002)
| Institution | Radiotherapy: dose/fraction (total dose in Gy) | No (%) | Chemotherapy | No (%) |
|---|---|---|---|---|
| Duke (n=55) | 1.5-1.6(45-86.4) | 9 (16) | Pre-RT ± concurrent ± post-RT | 31 (56) |
| (1999-2005) | 1.8-2.0(45-74) | 46 (84) | Concurrent ± post-RT | 19 (35) |
| No chemotherapy | 5 (9) | |||
| NKI (n=65) | 2.0 (70) | 34 (52) | No chemotherapy | 65 (100) |
| (1996-2002) | 2.25 (60.8-87.8) | 31 (48) | ||
| Duke (n=62) | 1.5-1.6 (54.6-74.2) | 16 (26) | Pre-RT ± concurrent ± post-RT | 22 (35) |
| (1991-1999) | 1.8-2.0 (24-80) | 45 (73) | Concurrent ± post-RT | 3 (5) |
| 2.5 (50-65) | 1 (2) | No chemotherapy | 37 (60) |
Pulmonary function tests (PFTs) and scoring pulmonary symptoms
PFTs included the forced expiratory volume (FEV1) and diffusion capacity for carbon monoxide (DLCO) tests and were measured as described previously [12, 13]. Both were expressed as the percent of predicted value based on age, height, and gender.
Pulmonary complications were scored based on the common toxicity criteria [14]. To minimize the subjectivity, both the treating and another physician scored patients with suspected complications. The endpoint in this study was the development of grade ≥2 pneumonitis, i.e., necessitating start of steroids (grade 2) and oxygen (grade 3). This same scoring system was used to evaluate the patients treated at both Duke and the NKI.
Treatment planning, dose calculation, and dose-volume histogram (DVH)
The pre-treatment CT scan was performed as previously described [10, 11]. At Duke, treatment planning was done using PLUNC (Plan University of North Carolina) to define the desired beams, per the treating radiation oncologist [15]. At NKI, treatment planning was performed by using U-M plan (University of Michigan) [16]. Radiation was typically delivered with 6-15 MV photon beams by linear accelerators.
The three-dimensional dose distributions were calculated with tissue density inhomogeneity corrections, using either an equivalent pathlength algorithm or the power law tissue-air ratio method. The dose-volume histograms were calculated based on the absolute total dose without adjustments for fraction size or overall treatment time in Duke. At NKI, all doses were corrected for fractionation. The local dose was converted to the normalized total dose, defined as the biologically equivalent dose delivered in 2 Gy/fraction. The linear quadratic model with an alpha/beta ratio of 3 Gy was used. The details of treatment planning, dose-volume histogram and calculations in both Duke and NKI were previously published [11, 17, 18].
Dose-function histogram (DFH) and overall perfusion weighted response parameter (OpRP)
SPECT images were obtained following intravenous injection of 99mTc-labeled macro aggregated albumin as previously described [13, 19]. 3D SPECT data were transferred electronically from Radiology to Radiation Oncology via an internal network, and stored on computer disk, for quantitative analysis. Software in PLUNC (X Fusion) was used to visually superimpose the SPECT images with pre-RT lung contours. After a SPECT scan was adequately registered with the CT data set, the SPECT image is resampled by tri-linear interpolation to match the spatial sampling of the CT data set. The entire 3D RT dose distribution was overlaid on to the SPECT scan. The percentage of SPECT counts in each dose bin was used to generate a “dose SPECT-count histogram”. As it is assumed that perfusion is proportional to function (10, 18), this histogram is termed a dose-function histogram [13, 20]. In general, the bin size used for the DFH calculation is equal to the maximum radiation dose divided by 100. From the dose-function histograms, the percent of lung perfusion receiving ≥25 Gy, the P25, and mean-perfused lung dose (MpLD) were obtained. A similar method was used at the NKI [10, 21].
A dose response curve (DRC) for regional lung injury has been presented [18]. Briefly, for the Duke patients, 0% effect was assumed for doses <15 Gy, and 100% effect for doses >60 Gy. For the NKI data, the dose-effect relationship was assumed to be sigmoid-shaped according to a logistic model with a D50 of 63 Gy and k of 1.7 [21]. For the purpose of this paper (a comparison of the Duke and NKI data), the NKI data were re-analyzed using the DRC curve from Duke. Based on the DFH and DRC, the sum of expected perfusion reduction, also termed the overall perfusion weighted response parameter (OpRP) or integrated injury, is calculated as OpRP = ∑(Pd x Rd), where Pd is the percent of perfused lung irradiated to dose d, and Rd is the expected reduction in regional perfusion at dose d (from the DRC).
Identifying patients predicted to be at “high risk”
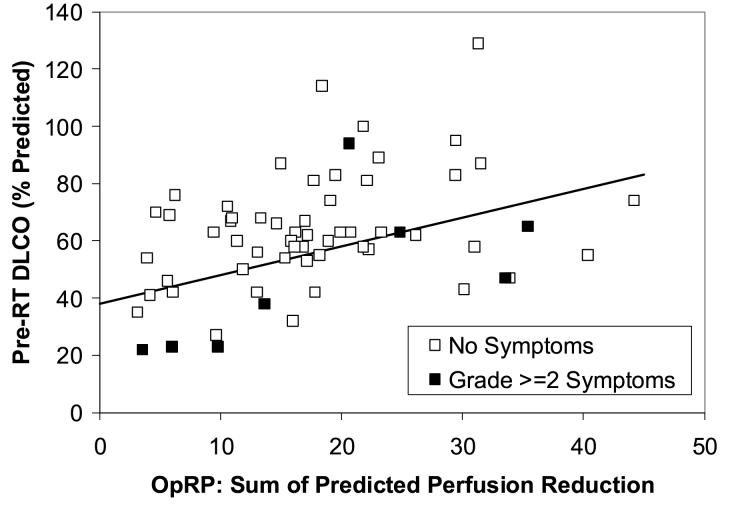
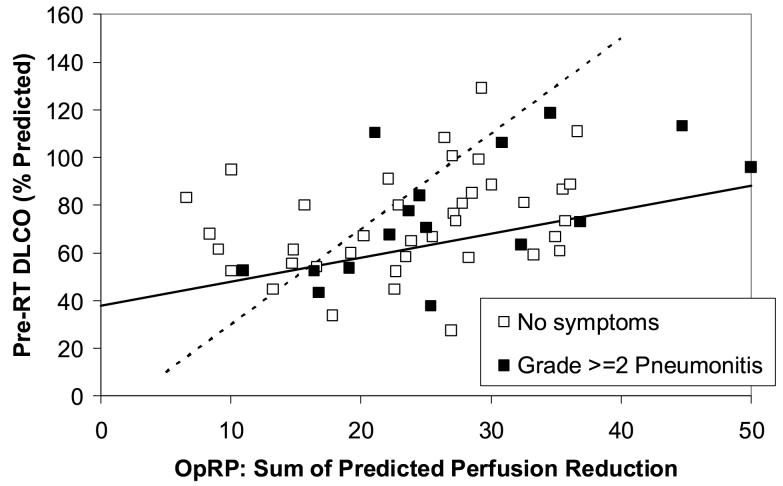
From an analysis performed in 1999, a subgroup of 62 patients with lung cancer and the SPECT-related parameter OpRP are identified and shown in Fig. 1 [9]. Using the same methods as the prior study (bi-dimensional modeling with discriminant analysis, i.e. the Mahalanobis distances), we derived a line that segregates this subgroup of lung cancer patients into high and low-risk for pneumonitis [22]. Subsequently, we prospectively tested this model for a new cohort of patients treated at Duke as well as in a separate group of patients treated at the Netherlands Cancer Institute. Each patient’s score (i.e. high vs low-risk for pneumonitis) was not computed during the planning/treatment process, and therefore patient management was not changed as a result of this study.
Figure 1.
The association between pre-RT PFTs (y axis) and the SPECT-based Overall Response Parameter (OpRP) (x axis) and the incidence of pneumonitis from the 62 evaluable patients with lung cancer and SPECT imaging in the 1999 analysis (8). The line represents the “optimal” segregation of the patients with and without pneumonitis and was derived retrospectively from the data.
Assessing the concordance of the predictive model for post-RT pulmonary symptoms
For the test patients treated at both Duke and the NKI, the rate of grade ≥2 radiation pneumonitis was determined in the patient groups that were predicted to be at high and low risk. The rates of radiation pneumonitis in the low risk and high-risk groups were compared to assess the accuracy of the model by using a one-tailed Fisher’s exact test (since we were explicitly predicting that one group would have a higher [not just a different] rate of pneumonits than the other group).
The predictive abilities of a variety of different dosimetric/functional parameters were also tested in the patients treated in Duke and NKI using receiver operating characteristic (ROC) curves.
RESULTS
Deriving a model for predicting risk of pneumonitis
The subgroup of 62 patients with lung cancer and the SPECT-related parameter OpRP treated from 1991-1999 is shown in Fig. 1 [9]. Based on this dataset and other published works [3-6, 9], patients are predicted to be at relatively “high risk” of post-RT pulmonary symptoms if they have:
An MLD of ≥ 25 Gy, or
A pre-RT percent predicted DLCO and OpRP that falls below the line shown in the Figure 1. Mathematically, these patients have a pre-RT DLCO that is less than (1.0 x OpRP + 38), derived with bi-dimensional discriminant analysis
When this model is used in the group of patients that the model is derived from, the dividing line is highly significant with p=0.03 in one-tailed Fisher’s exact test.
Comparing the different datasets
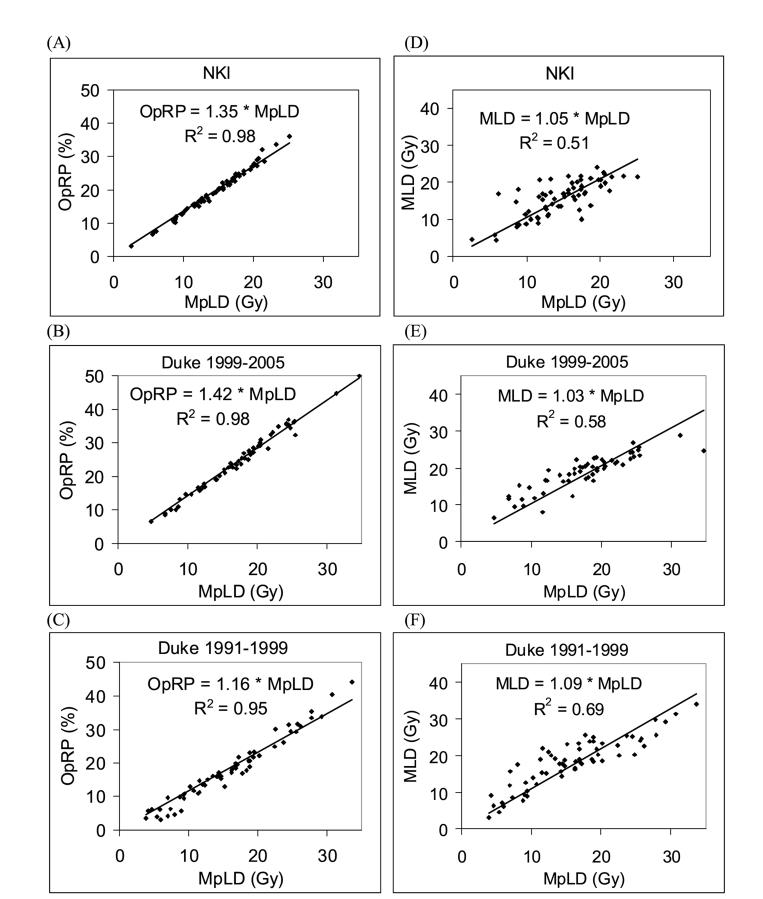
Prior to testing the model for predicting pneumonitis risk in a second cohort of Duke patients and in NKI patients, a comparison between the three datasets is made. First, the relationship between MLD and MpLD is examined (Fig. 2). The range of the MpLD and MLD for the two Duke datasets (1991-1999 and 1999-2005) are very similar. For the NKI data set, MpLD and MLD are restricted to values lower than 25 Gy. The correlation (R2) between MLD and MpLD ranges from 0.51to 0.69. The slopes of the regression lines through zero are very similar for the three datasets (1.09, 1.03, and 1.05 for Duke 91-99, Duke 99-05, and NKI datasets, respectively). The large spread of the data around these regression lines indicates the impact of perfusion weighting.
Figure 2.
Comparison between different patient groups as well as dosimetric and functional parameters. Patients are divided into three groups: Duke 1991-1999 patients used to derive the model for predicting high risk pneumonitis, and Duke 1999-2005 and NKI patients used to test the model prospectively. (A) through (C) compares mean perfused lung dose (MpLD) against the overall perfusion weighted response parameter (OpRP) for the three patient groups. (D) through (F) compares mean perfused lung dose (MpLD) against mean lung dose (MLD).
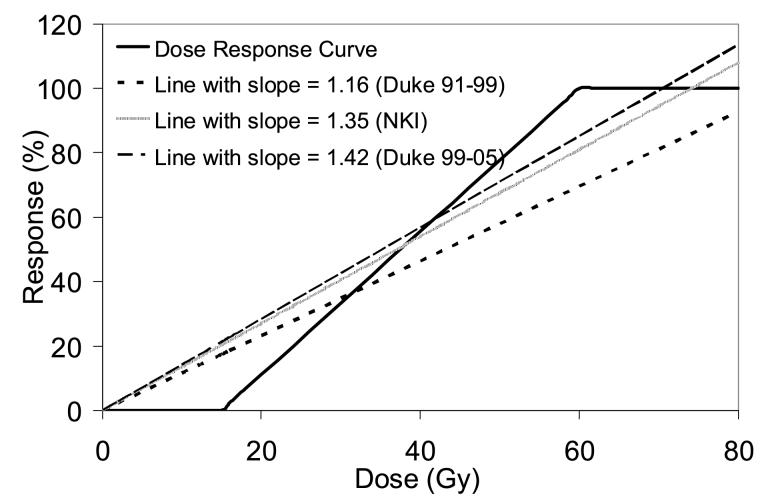
The relationship between the OpRPs and MpLD is also examined (Fig. 2). There is a very tight correlation between the two parameters with R2 ranging from 0.95 to 0.98. The slopes of the regression lines are 1.16, 1.42, and 1.35 for Duke 91-99, Duke 99-05 and NKI datasets, respectively. This means that the DRC used in the calculation of the OpRP could be well approximated by a DRC linearly dependent on the dose with a slope of 1.16, 1.42 and 1.35 for the three datasets, respectively.
Testing the model prospectively
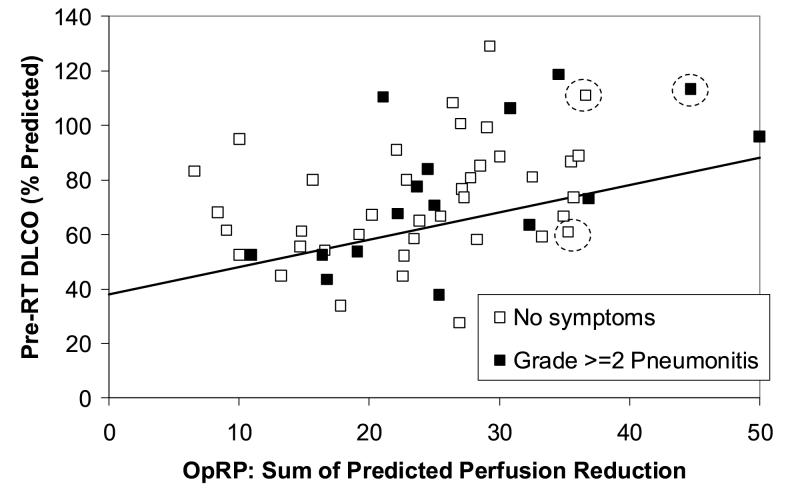
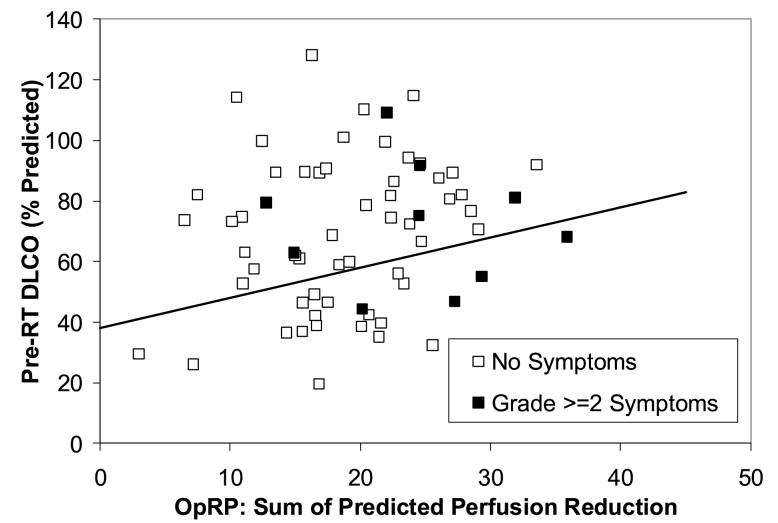
The incidence of pneumonitis in the second cohort of Duke patients is illustrated in Fig. 3. As shown using the line, 18/55 patients are prospectively considered high risk and 37/55 patients are low risk. In addition, applying the MLD>25 Gy criteria, 2 more patients from the low risk group move into the high risk group (shown by dashed circles in Figure 3). Therefore, 20/55 patients are high risk, and 35/55 patients are low risk. The rates of pneumonitis in the high and low risk groups are 7/20 and 9/35, respectively, p=0.33 one tailed Fisher’s. Similarly, the data for the Netherlands group is shown in Fig. 4. No patients have MLD>25 Gy in the Netherlands group. The comparable pneumonitis rates are 4/21 in the high risk group and 6/44 in the low risk group, p=0.41 one-tailed Fisher’s.
Figure 3.
The relationship between the pre-RT PFTs (y axis), OpRP (x axis) and pneumonitis in the new cohort of 55 patients treated at Duke between 1999 and 2005. The line derived from the data in Figure 1 is shown. Three patients with MLD>25 Gy are indicated with dashed circles. The rates of pneumonitis in the “high” vs. “low” risk patients (high risk = below the line or MLD>25 Gy) were 7/20 and 9/35, p=0.33.
Figure 4.
The relationship between the pre-RT PFTs (y axis), OpRP (x axis) and pneumonitis in the 65 patients from the NKI. The rates of pneumonitis in the “high” vs. “low” risk patients (ie. below and above the line, respectively) were 4/21 and 6/44, p=0.41.
The data form Duke, but not NKI, suggests that there is an interaction between pre-RT PFTs, OpRP, and subsequent risk of pneumonitis. This is illustrated in Fig. 3. The cases of pneumonitis within the low-OpRP patients tend to have lower pre-RT DLCO. If one limits the analysis to those patients with a pre-RT DLCO >60%, the rates of radiation pneumonitis in patients with an OpRP >20 vs. ≤20 are 11/31 and 0/7 (p=0. 07), respectively. The similar rates of pneumonitis in patients with an MLD >20 Gy vs. ≤20 Gy were 10/23 vs. 1/18 (p=0.007) for the Duke patients, and 2/12 vs. 5/29 (p=0.67) for the NKI patients.
The interaction between PFTs and OpRP is also seen in the ROC analysis (Table 3). In the Duke data, bi-parameter models considering both a dosimetric DVH/DFH-based parameter and the PFT parameter FEV1 tend to have higher ROC areas than the corresponding uni-parameter models (0.65-0.72 versus 0.56-0.62, respectively). However, bi-parameter models using DLCO does not perform better than uni-parameter models. For the NKI data, bi-parameter models have equivalent ROC areas as uni-parameter models, both for FEV1 and DLCO. In fact, bi-dimensional modeling with OpRP and DLCO leads to less significant results (p=0.04) compared to OpRP alone (p=0.01).
Table 3.
Area under the ROC curves for uni- and bi-parameters based models predicting radiation pneumonitis
| Parameter | Area under the ROC curve | |
|---|---|---|
| Duke (1999-2005) | NKI | |
| Pulmonary function tests (%) | ||
| Pre-RT DLCO | 0.53 | 0.52 |
| Pre-RT FEV1 | 0.61 | 0.53 |
| Single DVH-based parameters | ||
| V20 | 0.54 | - |
| V25 | 0.52 | - |
| V30 | 0.51 | - |
| MLD | 0.62 | 0.61 |
| Single SPECT-based parameters | ||
| P20 | 0.55 | - |
| P25 | 0.54 | - |
| P30 | 0.54 | - |
| MpLD | 0.59 | 0.71 |
| OpRP | 0.56 | 0.72 |
| Multiparameter-based models | ||
| MLD and DLCO | 0.62 | 0.60 |
| MLD and FEV1 | 0.72 | 0.62 |
| MpLD and DLCO | 0.59 | 0.71 |
| MpLD and FEV1 | 0.65 | 0.70 |
| OpRP and DLCO | 0.56 | 0.72 |
| OpRP and FEV1 | 0.65 | 0.72 |
Furthermore, in the Duke data, perfusion weighted parameters have lower ROC areas than non-perfusion weighted parameters (0.62-0.72 for MLD models, 0.56-0.65 for MpLD and OpRP models). This is in contrast to the NKI data, where models using MpLD and OpRP have higher ROC areas than models using MLD (0.70-0.72 versus 0.60-0.62, respectively). In the NKI data, OpRP and MpLD also appear as the most significant predictors in uni-dimensional modeling (p=0.01 and 0.03, respectively), better than the non-perfusion weighted parameters OpRP (p=0.3) and MLD (p=0.4).
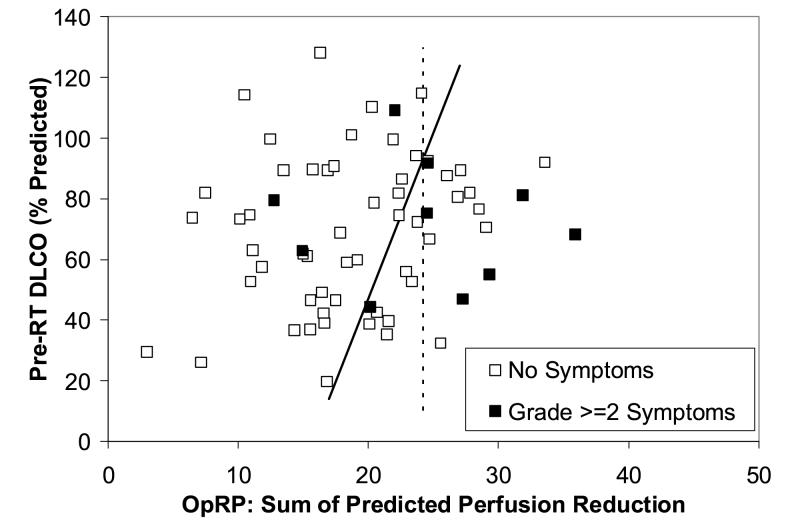
If the Duke 1999-2005 and NKI data are examined again retrospectively, new segregating lines that optimally divide patients into high and low risk for pneumonitis can be calculated. For the Duke data, the best discriminant line retrospectively is shown in Fig. 5 as the dashed line with equation DLCO = (4 * OpRP - 10). For the NKI dataset, a new discriminant line that uses both OpRP and DLCO could be drawn, but it is nearly vertical because only the OpRP contributes to the discriminant value (Fig. 6). The better predictive value of OpRP alone is also displayed in Fig. 6.
Figure 5.
The data shown in Fig. 3 is reproduced here. As noted, the solid line illustrates the challenges associated with prospectively identifying specific high and low risk groups of patients. If done retrospectively, one could define the dashed line as a “new” PFT/OpRP ratio that well segregates patients into high vs. low risk (DLCO = 4 * OpRP -10).
Figure 6.
The data shown in Fig. 4 is reproduced here, with retrospectively defined new segregations lines that are superior to the prospective line in Figure 4. The solid line (DLCO = 11 * OpRP - 173) considers both the OpRP and DLCO in segregating patients into high and low risk, the dashed line (OpRP = 24) uses only the OpRP.
DISCUSSION
The prospective identification of patients at relatively high risk for radiation pneumonitis is challenging since a variety of treatment/patient-related factors appear to influence this risk. In particular, dosimetric parameters, such as the mean lung dose, have been most consistently linked with the risk of pneumonitis in many studies [2-6, 8]. Furthermore, several studies suggest that patients with relatively poor pre-RT lung function are more likely to experience toxicity than are patients with better lung function [7, 9, 23, 24].
Based on a 1999 analysis of the patients treated at Duke [6, 9], and the data from others [3-5], we developed a functional/dosimetric model to attempt to prospectively segregate patients into high and low risk groups. The present report demonstrates that the model was unsuccessful when applied to a set of new patients treated at Duke, and a contemperaneous group from the NKI. The selection of the line in Figure 1 is central to the results. The line herein used was derived from bi-dimensional discriminant analysis using Mahalanobis distances. We recognize there are alternative methods to select an appropriate “division line”. Further, we have reassessed the 1991-1999 data and identified additional lines that might have been considered “optimal” based on visual inspection or ROC curves. The use of alternative discriminant lines was still unable to accurately segregate patient outcomes in the more recent dataset (2000-2005).
While unsuccessful, the Duke data shows that combining dosimetric parameters with FEV1 might improve outcome prediction than using dosimetric parameters alone, although this is not seen with DLCO. The NKI data shows no improvement when PFTs are combined with dosimetric parameters, although prediction does improve with the use of functional/perfusion imaging (vs. CT-based dosimetric parameters). The present analysis highlights the challenges of the prospective identification of high vs. low risk patients.
The present analysis is not contradictory with prior studies from our group and others. The patients with the highest MLD are at greater risk of pneumonitis than are patients with lower MLD. In the Duke data, patients with low pre-RT pulmonary function have a higher rate of pneumonitis at low lung doses than do patients with better pre-RT lung function. Thus, if we were to analyze these patients “retrospectively” the conclusions would be similar to what we and others have noted before. However, the present analysis demonstrates the challenges associated with prospectively identifying specific high and low risk groups of patients. Indeed, if done retrospectively, one could define the dashed line on Fig. 5 as a “new” PFT/OpRP ratio that well segregates Duke patients into high vs. low risk.
One factor that contributed to this present study’s inability to prospectively segregate patients into high and low risk groups is that we are underpowered. The prospective model is derived from the first group of Duke patients (1991-1999), where pneumonitis rates are 26% and 5% in the high and low risk groups, respectively. For a study to have 80% power to detect a 20% difference between the high and low risk groups, approximately 80 patients are needed for the two arms (assuming alpha=0.05 for one-sided test). The second group of Duke patients (2000-2005) has 20 high risk patients and 35 low risk patients, and the NKI group has 21 high risk patients and 44 low risk patients. The two groups each have approximately 70% power to detect a 20% difference. There is certainly a trend in both the Duke and NKI groups towards a higher pneumonitis rate in the high risk group compared to the low risk group, but the trend is not statistically significant.
A tool to prospectively identify patients at increased risk for pneumonitis would be extremely useful. Presently, there are interventions that may reduce patients risk for pneumonitis (e.g. Amifostine). However, the toxicity of such interventions has, at least in part, hindered its widespread use. If patients at particularly high risk for pneumonitis could be identified, such interventions might be effectively applied in particular patient subgroups. On the other hand, in patients who are deemed to be at a relatively low risk for pneumonitis, they might be candidates for dose escalation.
There have been very few attempts to prospectively identify patients risk for radiation-induced lung injury [2, 3]. The University of Michigan is performing a dose escalation study wherein the prescribed dose is dependent on the anticipated normal tissue complication probability (NTCP). In this study, the observed and predicted complication rates were fairly divergent [2]. Among patients with a predicted >95% risk for pneumonitis, only 5/13 developed clinical pneumonitis. Nevertheless, the patients that they deemed to be at “high risk” for pneumonitis did have a higher rate of pneumonitis than did the patients that they deemed to be at low risk. However, the absolute magnitude of the predicted vs. observed rates were different. Similarly, Oetzel et al noted the rates of pneumonitis to be 13% and 29% for patients with a calculated NTCP of <30% and ≥30%, respectively [3]. In this regard, these findings are similar to ours. On the other hand, in the dose escalation study by Belderbos et al, the observed incidence of radiation pneumonitis was not statistically different from the estimated probability using results from Kwa et al [4, 25]. However, the authors do comment that the observed data seemed to indicate a higher incidence of radiation pneumonitis than predicted, but the difference is not statistically significant due to the limited number of cases.
The model we used to identify patients at high vs. low risk for pneumonitis may seem cumbersome. We used a two-threshold approach. Patients were considered to be at high risk if their MLD exceeded 25 Gy. This threshold was selected based on studies from multiple institutions [3, 4]. Amongst patients who had MLD below 25 Gy, they were expected to be at high risk for pneumonitis if their pre-RT lung function was poor relative to the planned radiation dose distribution. In other words, patients were considered “high risk” if their PFTs were relatively low compared to the anticipated degree of lung injury (OpRP). This relationship between pre-RT lung function and expected lung injury is the second component of our prospective model, and is more difficult to explain and apply clinically than the MLD. Nevertheless, we believe that this second component is, in many ways, more physiologically sound than the MLD alone.
The MLD considers only the radiation dose distribution, and ignores the possible impact of pre- RT lung function distribution. Indeed, in our initial data set, from which the threshold PFT/OpRP ratio was defined (i.e. the line in Fig. 1), we did not observe a strong impact of MLD alone. The MLD threshold was included due to the number of studies that shows the importance of this parameter [2-6, 8]. Similarly, we elected to use the OpRP as our dosimetric parameter to compare to the PFTs since we believe that the OpRP provides a useful metric of anticipated global lung effects. However, the simpler parameter MpLD could probably have been used instead of the OpRP, given the very tight correlations between these two parameters (Fig. 2). Prior studies from Duke and the NKI have suggested that SPECT-based dosimetric parameters may predict RT-induced symptomatic lung injury better than CT-based dosimetric parameters that do not incorporate functional information. This trend continues to be seen in the NKI data in this study but not the Duke data [9, 21]. One could have defined similar ratios between the PFTs and other dosimetric parameters such as V20 or MLD.
To further test the applicability of such predictive models in another venue, we also studied patients irradiated at the NKI. Similar methods were used to compute radiation dose, define the overall response parameter, and assess pre-RT pulmonary function. As was the case with the Duke test set, the model was not able to accurately identify patients at high vs. low risk in the NKI data set. While it is clearly important to demonstrate the utility of a prognostic factor in diverse patient population, applying predictive model developed at one institution to a second institution is potentially problematic. For example, several studies demonstrated associated between a variety of dosimetric parameters and the incidence of pneumonitis. We and others have suggested that the precise dosimetric parameter selected is not critical as there is a strong correlation between the different dosimetric parameters. For example, in the study by Graham et al from Mallinckrodt, the correlation coefficient between V20 and MLD was 0.94 [5]. Correlation coefficients between other parameters were similarly high in the studies by Kwa (4) and Fan et al. [18]. These dosimetric parameters tend to be highly correlated with each as long as the radiation technique being used is relatively uniform across patients. However, the associations become less strong when a more varied radiation technique is used.
For example, most of the patients in the Duke series were treated with fairly conventional beams (e.g. AP/PA followed by off cord oblique opposed fields). Within that construct, there is a strong association between the different dosimetric parameters. When more varied beam arrangements are used, e.g. 5 or 7 not opposed beams, the V20 tends to decrease, but the MLD stays relatively constant. Thus the V5 and V10 tend to increase. It appears reasonable to consider the Netherlands data in this context since the radiation techniques used at the NKI and Duke are similar. An important difference in the two institutions is that 91% per cent of patients treated in Duke were given chemotherapy, but none in the NKI.
The dosimetric parameters for the initial 62 patients at Duke are somewhat different than for the subsequent group of Duke patients and the NKI patients. Our original prospective model used an MLD greater than 25 Gy to define high risk. In the subsequently treated patients, very few patients had this high dosimetric parameter (3/55 and 0/65 at Duke and NKI, respectively). This difference in the patient groups is also reflected in slopes of the OpRP versus MpLD plots (Fig. 2). The slopes of these plots are mathematically equal to the linear approximation of the DRC curve underlying the OpRP calculation. The linear approximation of the Duke DRC had a slope of 1.16 for the Duke 91-99 data, whereas the slopes for the Duke 99-05 and NKI data had steeper slopes (1.42 and 1.35, respectively). A flatter slope means more patients had a larger portion of the lung treated to a higher dose, because the DRC saturates at 100% when doses are >60 Gy. Therefore, the different DRC slopes for the three patient cohorts confirm that the two newer patient cohorts had lower MLDs than the original patient group. Figure 7 depicts the Duke DRC (0% response at <15 Gy, 100% response at >60 Gy, linear dose response between 15-60 Gy) and the 3 linear approximations for the DRC, derived from the 3 datasets in this study.
Figure 7.
The dose-response curve used in this study, compared against three linear approximations based on the three patient groups in this study (Duke 1991-1999, Duke 1999-2005, and NKI). The linear approximations are derived from the relationship between the OpRP and MpLD, shown in Figure 2. Line with smaller slope means more patients in that dataset were treated with higher doses, which flattens out the line since the DRC flattens out at >60 Gy.
One variable that may be predictive of radiation pneumonitis that was not taken into consideration in this study is the effect of the region of lung irradiated. A number of clinical studies, including Yorke et al from Memorial and Seppenwoolde et al from NKI, have shown that radiation dose to the lower lung may be more associated with lung injury than radiation dose to the upper lung[16, 26]. Other studies such as Hope et al from Washington University and Yamada et al from Japan have found that the incidence of pneumonitis is higher in patients with lower lobe tumors [27, 28]. Our group has also looked for this effect in our data and has not seen this [29]. We are uncertain why we achieve different results in this regard, and this is a topic of ongoing study. A number of other research groups also did not find different rates of pneumonitis based on tumor location [7, 30, 31]. The model tested in this study was DVH-based, which discards all spatial information. Alternative predictive models that consider such spatial information can certainly be developed and tested.
The diagnostic uncertainty of radiation pneumonitis may be a factor that makes the prediction of RT-induced lung injury difficult. In a study of 251 lung cancer patients treated with RT at Duke between 1991 and 2003, 47/251 (19%) were thought to have radiation pneumonitis and 13/47 (28%) had concurrent medical diagnoses (e.g possible infection, exacerbation of pre-existing lung disease, tumor regrowth/progression, and/or cardiac disease) that confounded the diagnosis [32].
In conclusion, the prospective model was unable to accurately segregate patients into high vs. low risk groups. However, the data continue to suggest that dosimetric (e.g. MLD) and functional (e.g. PFT) parameters are potentially important in the prospective identification of patients at high and low risk of RP. Additional work is needed to better identify, and prospectively assess, predictors of RT-induced lung injury.
Acknowledgments
Acknowledgments: Supported, in part, by NIH R01 Grant CA69579. Thanks to University of North Carolina for PLUNC planning software, and to Andrea Tisch, Robert Clough and Phil Antoine for data/computer management/support.
Presented at the 2005 meeting of the American Society for Therapeutic Radiology and Oncology, Colorado, Denver.
Footnotes
CONFLICT OF INTEREST
Duke investigators in the present study are supported in part by NIH R01 Grant CA69579 and Varian Medical Systems.
Publisher's Disclaimer: This is a PDF file of an unedited manuscript that has been accepted for publication. As a service to our customers we are providing this early version of the manuscript. The manuscript will undergo copyediting, typesetting, and review of the resulting proof before it is published in its final citable form. Please note that during the production process errorsmaybe discovered which could affect the content, and all legal disclaimers that apply to the journal pertain.
REFERENCES
- 1.McDonald S, et al. Injury to the lung from cancer therapy: clinical syndromes, measurable endpoints, and potential scoring systems. Int J Radiat Oncol Biol Phys. 1995;31(5):1187–203. doi: 10.1016/0360-3016(94)00429-O. [DOI] [PubMed] [Google Scholar]
- 2.Martel MK, et al. Dose-volume histogram and 3-D treatment planning evaluation of patients with pneumonitis. Int J Radiat Oncol Biol Phys. 1994;28(3):575–81. doi: 10.1016/0360-3016(94)90181-3. [DOI] [PubMed] [Google Scholar]
- 3.Oetzel D, et al. Estimation of pneumonitis risk in three-dimensional treatment planning using dose-volume histogram analysis. Int J Radiat Oncol Biol Phys. 1995;33(2):455–60. doi: 10.1016/0360-3016(95)00009-N. [DOI] [PubMed] [Google Scholar]
- 4.Kwa SL, et al. Radiation pneumonitis as a function of mean lung dose: an analysis of pooled data of 540 patients. Int J Radiat Oncol Biol Phys. 1998;42(1):1–9. doi: 10.1016/s0360-3016(98)00196-5. [DOI] [PubMed] [Google Scholar]
- 5.Graham MV, et al. Clinical dose-volume histogram analysis for pneumonitis after 3D treatment for non-small cell lung cancer (NSCLC). Int J Radiat Oncol Biol Phys. 1999;45(2):323–9. doi: 10.1016/s0360-3016(99)00183-2. [DOI] [PubMed] [Google Scholar]
- 6.Hernando ML, et al. Radiation-induced pulmonary toxicity: a dose-volume histogram analysis in 201 patients with lung cancer. Int J Radiat Oncol Biol Phys. 2001;51(3):650–9. doi: 10.1016/s0360-3016(01)01685-6. [DOI] [PubMed] [Google Scholar]
- 7.Robnett TJ, et al. Factors predicting severe radiation pneumonitis in patients receiving definitive chemoradiation for lung cancer. Int J Radiat Oncol Biol Phys. 2000;48(1):89–94. doi: 10.1016/s0360-3016(00)00648-9. [DOI] [PubMed] [Google Scholar]
- 8.Seppenwoolde Y, et al. Comparing different NTCP models that predict the incidence of radiation pneumonitis. Normal tissue complication probability. Int J Radiat Oncol Biol Phys. 2003;55(3):724–35. doi: 10.1016/s0360-3016(02)03986-x. [DOI] [PubMed] [Google Scholar]
- 9.Lind PA, et al. Receiver operating characteristic curves to assess predictors of radiation-induced symptomatic lung injury. Int J Radiat Oncol Biol Phys. 2002;54(2):340–7. doi: 10.1016/s0360-3016(02)02932-2. [DOI] [PubMed] [Google Scholar]
- 10.Boersma LJ, et al. A new method to determine dose-effect relations for local lung-function changes using correlated SPECT and CT data. Radiother Oncol. 1993;29(2):110–6. doi: 10.1016/0167-8140(93)90235-z. [DOI] [PubMed] [Google Scholar]
- 11.Marks LB, et al. The role of lung perfusion imaging in predicting the direction of radiation-induced changes in pulmonary function tests. Cancer. 2000;88(9):2135–41. [PubMed] [Google Scholar]
- 12.Borst GR, et al. Pulmonary function changes after radiotherapy in non-small-cell lung cancer patients with long-term disease-free survival. Int J Radiat Oncol Biol Phys. 2005;62(3):639–44. doi: 10.1016/j.ijrobp.2004.11.029. [DOI] [PubMed] [Google Scholar]
- 13.Marks LB, et al. Quantification of radiation-induced regional lung injury with perfusion imaging. Int J Radiat Oncol Biol Phys. 1997;38(2):399–409. doi: 10.1016/s0360-3016(97)00013-8. [DOI] [PubMed] [Google Scholar]
- 14.Common Toxicity Criteria Version 2.0, in Cancer Therapy Evaluation Program. National Cancer Institute; 1998. [Google Scholar]
- 15.Sailer SL, et al. Treatment Planning at the University of North Carolina at Chapel Hill. Semin Radiat Oncol. 1992;2(4):267–273. doi: 10.1053/SRAO00200267. [DOI] [PubMed] [Google Scholar]
- 16.Seppenwoolde Y, et al. Regional differences in lung radiosensitivity after radiotherapy for non-small-cell lung cancer. Int J Radiat Oncol Biol Phys. 2004;60(3):748–58. doi: 10.1016/j.ijrobp.2004.04.037. [DOI] [PubMed] [Google Scholar]
- 17.Lebesque JV, Keus RB. The simultaneous boost technique: the concept of relative normalized total dose. Radiother Oncol. 1991;22(1):45–55. doi: 10.1016/0167-8140(91)90068-r. [DOI] [PubMed] [Google Scholar]
- 18.Fan M, et al. Can we predict radiation-induced changes in pulmonary function based on the sum of predicted regional dysfunction? J Clin Oncol. 2001;19(2):543–50. doi: 10.1200/JCO.2001.19.2.543. [DOI] [PubMed] [Google Scholar]
- 19.Marks LB, et al. The utility of SPECT lung perfusion scans in minimizing and assessing the physiologic consequences of thoracic irradiation. Int J Radiat Oncol Biol Phys. 1993;26(4):659–68. doi: 10.1016/0360-3016(93)90285-4. [DOI] [PubMed] [Google Scholar]
- 20.Marks LB, et al. The role of three dimensional functional lung imaging in radiation treatment planning: the functional dose-volume histogram. Int J Radiat Oncol Biol Phys. 1995;33(1):65–75. doi: 10.1016/0360-3016(95)00091-C. [DOI] [PubMed] [Google Scholar]
- 21.De Jaeger K, et al. Pulmonary function following high-dose radiotherapy of non-small-cell lung cancer. Int J Radiat Oncol Biol Phys. 2003;55(5):1331–40. doi: 10.1016/s0360-3016(02)04389-4. [DOI] [PubMed] [Google Scholar]
- 22.Rao CR. Contributions to statistics. Presented to P.C. Mahalanobis on the occasion of his 70th birthday. Pergamon Press; New York: 1965. [Google Scholar]
- 23.Choi NC, Kanarek DJ, Kazemi H. Prospective study of pulmonary tolerance to radiotherapy or radiotherapy plus multidrug chemotherapy for loco-regional lung carcinoma. Antibiot Chemother. 1988;41:213–9. doi: 10.1159/000416207. [DOI] [PubMed] [Google Scholar]
- 24.Marks LB, et al. Physical and biological predictors of changes in whole-lung function following thoracic irradiation. Int J Radiat Oncol Biol Phys. 1997;39(3):563–70. doi: 10.1016/s0360-3016(97)00343-x. [DOI] [PubMed] [Google Scholar]
- 25.Belderbos JS, et al. First results of a phase I/II dose escalation trial in non-small cell lung cancer using three-dimensional conformal radiotherapy. Radiother Oncol. 2003;66(2):119–26. doi: 10.1016/s0167-8140(02)00377-8. [DOI] [PubMed] [Google Scholar]
- 26.Yorke ED, et al. Correlation of dosimetric factors and radiation pneumonitis for non-small-cell lung cancer patients in a recently completed dose escalation study. Int J Radiat Oncol Biol Phys. 2005;63(3):672–82. doi: 10.1016/j.ijrobp.2005.03.026. [DOI] [PubMed] [Google Scholar]
- 27.Hope AJ, et al. Modeling radiation pneumonitis risk with clinical, dosimetric, and spatial parameters. Int J Radiat Oncol Biol Phys. 2006;65(1):112–24. doi: 10.1016/j.ijrobp.2005.11.046. [DOI] [PubMed] [Google Scholar]
- 28.Yamada M, et al. Risk factors of pneumonitis following chemoradiotherapy for lung cancer. Eur J Cancer. 1998;34(1):71–5. doi: 10.1016/s0959-8049(97)00377-8. [DOI] [PubMed] [Google Scholar]
- 29.Yu X, et al. Relating RT-induced pulmonary symptoms based on the dose to the superior vs. inferior lung in patients irradiated for lung cancer. Int J Radiat Oncol Biol Phys. 2003;57(2S):S415. [Google Scholar]
- 30.Tsujino K, et al. Predictive value of dose-volume histogram parameters for predicting radiation pneumonitis after concurrent chemoradiation for lung cancer. Int J Radiat Oncol Biol Phys. 2003;55(1):110–5. doi: 10.1016/s0360-3016(02)03807-5. [DOI] [PubMed] [Google Scholar]
- 31.Fay M, et al. Dose-volume histogram analysis as predictor of radiation pneumonitis in primary lung cancer patients treated with radiotherapy. Int J Radiat Oncol Biol Phys. 2005;61(5):1355–63. doi: 10.1016/j.ijrobp.2004.08.025. [DOI] [PubMed] [Google Scholar]
- 32.Kocak Z, et al. Challenges in defining radiation pneumonitis in patients with lung cancer. Int J Radiat Oncol Biol Phys. 2005;62(3):635–8. doi: 10.1016/j.ijrobp.2004.12.023. [DOI] [PubMed] [Google Scholar]


