Abstract
Dendritic cells (DC) are produced continuously by a unique, long-term culture (LTC) system in which hemopoiesis is supported by a splenic stromal cell layer in the absence of added growth factors. Flow cytometric analysis reveals the production of two distinct cell subsets. The more predominant large-cell subset resembles highly endocytic DC that are large, granular, and possess membrane extensions. They also express high levels of the DC markers CD11c, CD11b, DEC-205, and CD80 on their cell surface. They do not resemble mature DC because they express low levels of MHC type II and CD86 molecules, as well as c-kit and Fc receptor (FcR). These are known characteristics of immature DC. Small cells are smaller and less granular than large cells, with negative to low expression of CD11c, DEC-205, and CD86. A majority of small cells express varying levels of CD11b and CD80. Subpopulations of small cells express low levels of c-kit, FcR, and MHC type II, and only a 20% subpopulation is weakly endocytic. Upon transfer to an irradiated stromal layer, cells within the small subset proliferate and differentiate to resemble the large cells in size, complexity, membrane extensions, and CD11c and CD86 expression. The two cell subsets produced in LTC are developmentally linked, with the heterogeneous small-cell subset containing progenitors of the larger homogeneous, immature DC subset. LTC represent a valuable model system for studying DC development from hemopoietic progenitors.
Dendritic cells (DC) are a minor but important population of hemopoietic cells. The primary function of DC is the capture and processing of antigen, followed by presentation of antigenic peptides during activation of T cells (1, 2). DC develop different characteristics to fulfill different roles in the stimulation of an immune response. Immature DC function in the uptake and processing of antigen by macropinocytosis (3), phagocytosis (4), and absorptive endocytosis mediated by receptors, including mannose receptors (3), DEC-205 (5), and Fc receptors (FcR) (6). These cells express only low levels of major histocompatibility complex class II (MHCII) molecules on their surface, whereas abundant intracellular MHCII is present within specialized endocytic compartments, as part of an efficient antigen-processing system (7, 8). Mature DC lose capacity for antigen capture and processing and function to present antigen to T cells. They possess long cytoplasmic processes for cell interaction (8) and have up-regulated expression of MHCII for peptide presentation (7, 8) and increased expression of the costimulatory molecules CD80 (9) and CD86 (10).
The study of DC development and function has been difficult because of the low numbers of DC present in vivo and the lack of DC-specific markers. A long-term culture (LTC) system that supports hemopoiesis has been developed from murine spleen that continuously produces nonadherent DC (LTC-DC), in the absence of exogenous growth factors, including granulocyte/macrophage colony-stimulating factor (11–13). The production of LTC-DC appears to depend on the maintenance of small progenitor cells carried through many passages of cultures. This process involves transfer of both stromal cells and nonadherent hemopoietic cells (14).
Expression of lineage-specific cell surface markers for myeloid cells, T and B lymphocytes, and granulocytes has been monitored as LTC develop. Established LTC do not produce lymphoid cells, granulocytes, or monocytes/macrophages (11–13). Production of cells expressing markers associated with DC, including CD11c, CD11b, DEC-205, and 33D1, has been shown to continue for up to 7 years for some LTC (14). The antigen-presenting capacity of cells produced in LTC has been confirmed at numerous time points (14). LTC-DC can stimulate both allogeneic and syngeneic naive T cells as well as present antigen to antigen-specific T helper cells (11, 15). In this report, surface marker expression, function, and differentiative capacity have been used to characterize two major DC subsets produced in LTC. Furthermore, the small subset contains progenitors that generate the large DC produced in LTC.
Materials and Methods
Animals.
B10.A(2R) (2R) and C57BL/6J (B6) mice were bred at the John Curtin School of Medical Research, Canberra, Australia, under specific pathogen-free conditions. 2R-derived LTC were used in most experiments.
Establishment of LTC from Murine Spleen.
Cultures were established and maintained in supplemented DMEM from 6- to 8-week-old female mice as described in detail previously (15). They contain a stromal cell layer of fibroblasts and endothelial cells. Foci of hemopoietic cells develop on the top of stromal cells. Nonadherent DC are shed from foci into the medium and can be collected for assay at medium change. Between 0.5 and 1.0 × 10⁶ nonadherent cells can be collected from each flask after 48 h of growth. LTC are passaged by transferring both stromal cells and nonadherent hemopoietic cells to a new flask every few months. It is essential to maintain a population of small cells after medium change to maintain production of hemopoietic cells in LTC.
Cells produced in LTC were routinely characterized by fluorescence-activated cell sorter (FACS) analysis by using forward light scatter (FSC) and side light scatter (SSC), reflecting cell size and cell complexity. These were recorded on linear and logarithmic scales, respectively. Flow cytometric analysis was performed on a FACSort (Becton Dickinson) by using cellquest software (Becton Dickinson).
Analysis of Cell Surface Marker Expression.
Primary antibodies used for FACS analysis included affinity-purified mAbs specific for CD16/32 (2.4G2; rat IgG2b), CD11c (HL3; biotinylated hamster IgG), CD11b (M170; biotinylated rat IgG2b), CD80 (1G10; biotinylated rat IgG2a), CD86 (GL1; biotinylated rat IgG2a), CD117 (c-kit receptor; 2B8; biotinylated rat IgG2b), and MHCII (AF6–120.1; FITC-conjugated mouse IgG2a), all of which were from PharMingen. Culture supernatant collected from hybridoma cells was used a source of antibody specific for DEC-205 (NLDC-145; rat IgG2a). Fluorescent conjugates included phycoerythrin-conjugated avidin from PharMingen, FITC-conjugated anti-rat Ig [goat F(ab′)2] from Southern Biotechnology Associates, FITC-conjugated anti-hamster Ig (goat IgG) from Kirkegaard and Perry Laboratories, and FITC-avidin from Becton Dickinson.
Before staining, LTC cells were incubated for 7 min on ice with crystal violet (2 mg/ml of saline) to quench background autofluorescence and then washed three times with 1.5 ml of PBS/0.1% NaN3. For staining, LTC-DC were incubated with 10 μl of FcR block (anti-CD16/32; 2.4G2, rat IgG2b; PharMingen) for 15 min on ice before the addition of antibody. FcR block was not used before treatment with fluorescent-labeled goat anti-rat or goat anti-hamster because of cross-reactivity. Specific antibody (or isotype control antibody) then was absorbed to cells in a 100-μl volume for 30 min on ice. Cells were washed once by using an underlay of 600 μl of FCS and centrifugation at 300 × g for 10 min and then twice more by resuspension in 1 ml of DMEM/1% FCS/0.1% NaN3 and centrifugation at 300 × g for 5 min. The same procedure was repeated for the addition of a labeled second-stage reagent. This was followed by a single wash with 1 ml of ice-cold PBS/0.1% NaN3, resuspension in 300–500 μl of PBS/0.1% NaN3, and immediate FACS analysis. For two-color staining, the same incubation and washing procedure was repeated for the addition of 100 μl of the second-stage specific antibody and fluorescent-labeled conjugate. Isotype control antibodies were used in all experiments. Cells labeled with fluorescent conjugate alone served as controls to delineate autofluorescence background.
Fluorescence analysis was performed on the FACSort by using cellquest software. Quadrants based on background controls were used to distinguish positive- from negative-staining cells.
Analysis of Endocytic Capacity of LTC-DC.
Protein uptake by nonadherent LTC-DC was assayed by using nonadherent cells pulsed with FITC-conjugated ovalbumin (OV-FITC; Sigma) at a final concentration of 100 μg/ml in 50% supplemented DMEM/50% LTC conditioned medium. Cells then were incubated at 37°C for various lengths of time up to 24 h. Control cells were incubated with OV-FITC at 4°C. At various times, protein uptake was halted by the addition of ice-cold PBS/0.1% NaN3. Cells then were washed three times with PBS/0.1% NaN3 and analyzed immediately by FACS. Untreated cells also were used as controls.
Stroma from LTC Supports Development of DC Progenitors.
Stromal cell cultures were established from LTC that no longer produce hemopoietic cells. These comprise a mixture of fibroblasts and endothelial cells and are passaged by scraping and transferring a section of stroma into a new flask containing fresh medium. When used to support hemopoietic cell growth, stromal LTC were washed three times with Puck's Ca- and Mg-free saline to remove any nonadherent cells, irradiated (20 Gy from a cesium-137 source), resuspended in supplemented DMEM, and incubated for 2 h at 37°C before FACS-sorted LTC-DC were transferred onto the stroma. Control flasks in which only medium was added to the irradiated stroma were checked for endogenous cell replication. They produced no LTC-DC over the course of experiments. Nonadherent LTC cells were sorted into small- and large-cell subsets on a FACStar (Becton Dickinson) by using gates based on FSC and SSC. Cultures established in this way were analyzed for changes in cell composition over time.
Results
Nonadherent Cells Produced in LTC Represent Two Major Subsets.
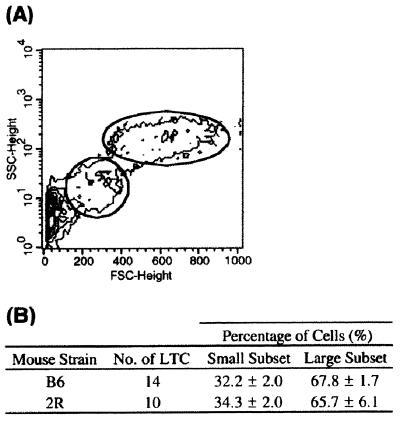
Nonadherent cells produced in many B6- and 2R-derived LTC maintain a constant light scatter profile by FACS analysis of FSC and SSC. By nature, LTC contain a small amount of debris because of cell turnover and death that can be removed at medium change. After exclusion of debris, two distinct cell populations are distinguishable by FSC and SSC (Fig. 1A). The large-cell population represents very large DC with cytoplasmic extensions. Cells are very complex, because of the nature of the membrane and the presence of lysosomes and endosomes in the cytoplasm. The small-cell population has a FSC that is approximately 3-fold lower and a SSC which is 8-fold lower than the large-cell population. In both B6- and 2R-derived LTC, the small-cell subset contributes approximately one-third of the total nonadherent cell population (Fig. 1B).
Figure 1.
Nonadherent cells produced in B6-derived LTC represent two major subpopulations based on FSC and SSC on the FACS. (A) The plot shown is representative of both B6- and 2R-derived LTC. (B) Data represent mean percentage ± SE of small vs. large cells in LTC after exclusion of debris.
Large Cells Produced in LTC Express DC Markers.
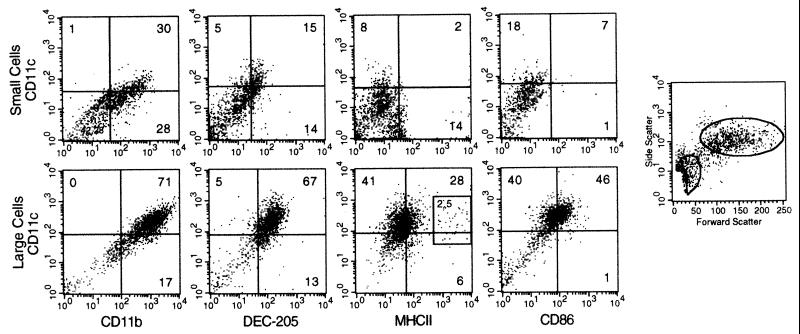
Two-color staining was used to identify differences in marker expression between cells of the small and large subsets. CD11c was used as the main DC marker, because it is strongly expressed by DC and particularly by splenic DC (16, 17). A majority of large LTC-DC express CD11c on their surface (70–80%) (Fig. 2). In addition, these large CD11c+ cells stain uniformly with antibody specific for CD11b (71%) and DEC-205 (67%), both well characterized DC markers (5, 18, 19) (Fig. 2). Many CD11c+ cells also express moderate levels of CD86 (46%), whereas a majority are negative or only weakly positive for MHCII (28%). A small subset (2.5%) expresses high levels of MHCII. Cells in the large LTC-DC subset resemble DC because cells are very large and complex and coexpress a number of DC cell surface markers including CD11c, CD11b, DEC-205, and CD86.
Figure 2.
Large, nonadherent LTC cells express DC markers. Cells were labeled with antibodies specific for DC markers by using an indirect, two-color staining technique. Data are representative of many separate experiments. Cells were separated into small- and large-cell subsets by using postaquisition gating. Quadrants that distinguish positively and negatively staining cells have been placed based on background staining of labeled conjugate only.
The small-cell subset is more heterogeneous with respect to DC marker expression. CD11c is weakly expressed and more variable on small compared with large LTC-DC (Fig. 2). CD11c and DEC-205 are expressed together on 15% of cells. Approximately 60% of small cells express CD11b, and half of these are CD11c+CD11b+ (30%). There is no coordinate expression of CD11c and MHCII; however, subpopulations of CD11clo and MHCIIlo cells can be detected on quadrant lines, demonstrating heterogeneity in the small-cell subset. CD86 is not expressed by small cells. The small LTC-DC subset does not show strong or homogeneous expression of DC markers, and many cells do not stain for the DC markers tested.
Cells in the Large Subset Represent Immature DC.
Maturation status of cells in the small- vs. large-cell subset was assessed by using antibodies specific for MHCII, CD80, and CD86 because these markers are known to be up-regulated on more mature DC at the antigen-presenting stage (6, 7, 9, 10). Expression of FcR was considered because it has been observed on immature, antigen-capturing DC (6). Cells also were stained for c-kit, a marker of early hemopoietic cells (20). Murine fetal liver-derived lin−c-kit+ hemopoietic progenitor cells have been shown to develop into DC (21).
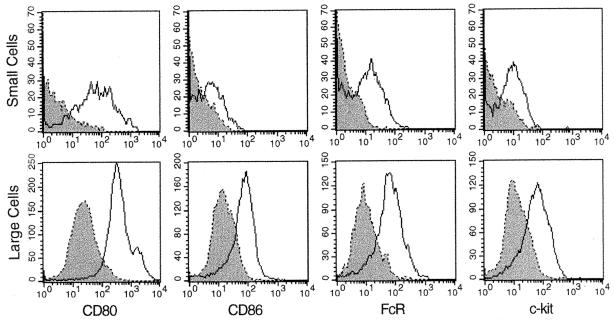
Cells of the large subset are clearly positive for CD80 and show moderate, but homogeneous, expression of CD86, FcR, and c-kit (Fig. 3). Most large cells show negative to low expression of MHCII; however, a small but consistent subpopulation (2.5%) expressing high levels could represent mature DC (Fig. 2). The small-cell subset uniformly expresses CD80 but not CD86 (Fig. 3). Subpopulations of small cells express low levels of MHCII, FcR, and c-kit. Large cells appear to represent immature DC because the majority show low to moderate expression of MHCII and CD86 and express FcR and c-kit. A high proportion of small cells lack each of the above markers. Only CD80 is expressed by most small cells.
Figure 3.
LTC-DC represent immature DC. Cells were incubated with specific antibody followed by a FITC- or phycoerythrin-conjugated second-stage reagent. Control cells were incubated with second-stage conjugate alone (dotted line). Cells were separated into small and large subsets by using postaquisition gating.
The endocytic capacity of small and large cells was compared to investigate further the maturity of cells in each subset, because endocytosis is associated with the immature DC stage of antigen capture (22). Antigen uptake was assayed by pulsing cells with OV-FITC for various lengths of time up to 24 h, followed by FACS analysis.
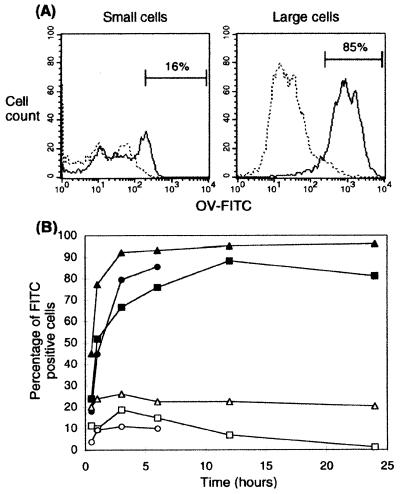
The large-cell subset represents a homogeneous population of cells with high endocytic capacity because approximately 85% of cells are OV-FITC+ by 6 h (Fig. 4A). The fluorescent intensity of FITC+ large cells is much greater than that of the few (16%) FITC+ cells of the small subset, indicating that the large cells are able to endocytose more of the labeled protein than small cells. In addition, uptake of OV-FITC by the small cells is due to the presence of a minor subset of endocytic cells rather than a lower endocytic capacity across the whole population. The number of OV-FITC+ large cells increases rapidly in the first 3 h and reaches a peak at 12 h, with an average of 92 ± 3% OV-FITC+ cells over three experiments (Fig. 4B). The large cells retain OV-FITC in their cytoplasm for at least 24 h. The percentage of FITC+ small cells peaks at 3 h, with an average of 19 ± 4% cells over three experiments. These results are consistent with marker analysis, which also identified the large cells as immature DC. The small-cell population is weakly endocytic, consistent with the presence of very few differentiated cells.
Figure 4.
Large LTC cells are highly endocytic. Protein uptake was measured by pulsing cells with OV-FITC. (A) Histograms represent FITC+ small vs. large cells at 6 h after incubation. At 6 h, 15.8 ± 3.7% (mean ± SE, where n = 3) of small cells were FITC+, whereas 84.8 ± 5.0% of large cells were FITC+. The protein uptake of cells kept on ice was taken as background (dotted line). (B) Data points represent the percentage of FITC+ cells at 0.5, 1, 3, 6, 12, and 24 h after incubation at 37°C in the presence of labeled protein for each of three replicate experiments (background control not shown). Open symbols represent small cells; closed symbols represent large cells.
Within LTC, Small DC Progenitors Generate Large, Immature DC.
Experiments were performed to test whether cells within the small-cell subset are progenitors of large cells within LTC. This model is consistent with observations on the need to maintain small cells at passage of cultures to maintain continuous DC production. Nonadherent LTC-DC were collected and sorted into small- and large-cell subsets by using flow cytometry. Separated small-cell (1.3 × 10⁵) or large-cell (2.2 × 10⁵) populations then were transferred with fresh medium onto irradiated LTC stromal monolayers. Irradiation of stromal monolayers has been used previously to ensure that endogenous cells are not produced during the experiment (23). The proliferation and differentiation of transferred cell subsets then was monitored over time by using light microscopy and FACS analysis.
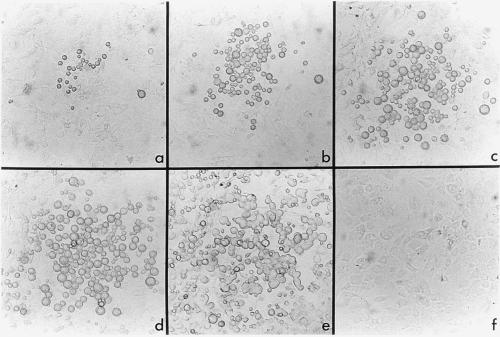
Over the first 4–5 days of culture no changes were observed in the number of small cells present on stromal layers. After 1 week, several colonies of cells were observed to form on stromal layers in flasks seeded with small cells. The development of one of these colonies was photographed over a period of 18 days, from day 8 to day 26 of culture (Fig. 5). By day 8, some small cells in the colony had adopted a size equivalent to that of large cells. An increase in the number of cells within colonies over time indicated that cells were proliferating. Some cells also had developed cytoplasmic extensions and increased cytoplasmic granularity. By 19 days, there was a dramatic increase in the number of cells produced in culture. This was associated with a more even distribution of DC-like cells over the stroma, rather than localization of cells in separate colonies as noted initially. Increase in cell number at day 19 coincided with release of nonadherent cells into the supernatant. The same developmental progression was observed in a repeat experiment, although cells were produced at a faster rate, with confluent DC growth occurring at 12–14 days after establishment. Throughout experimentation no cell growth was detected in control flasks replenished with supplemented DMEM only (Fig. 5f). However, after 2–3 weeks, some stromal cell death caused by irradiation was observed in all flasks and affected overall yields of nonadherent cells in LTC.
Figure 5.
LTC maintain a population of DC progenitors. At day 0, size-sorted small cells were transferred onto an irradiated, spleen-derived stromal monolayer. A selected colony derived from transferred cell(s) was photographed at 8 days (a), 13 days (b), 16 days (c), 19 days (d), and 26 days (e) after establishment (×200). By 19 days (f), no cell growth had occurred on the stromal monolayer of the control flask supplemented with medium only (×200).
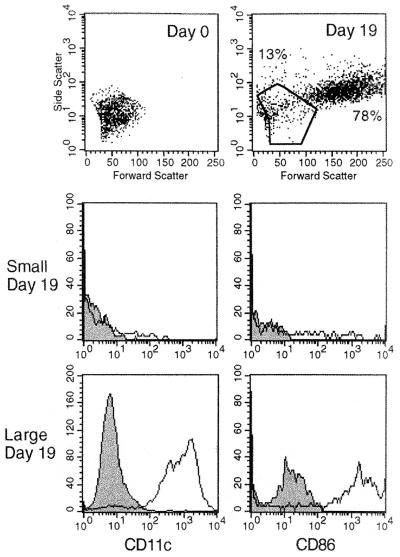
Fig. 6 compares the FSC and SSC of the original starting population of small cells at day 0, with nonadherent cells collected from the same culture at 19 days. By this time, the small-cell subset had developed into two populations of small and large cells as detected in primary LTC (Fig. 1). Small- and large-cell subsets also were analyzed for expression of CD11c and CD86. At day 19, large cells expressed high levels of both markers on their cell surface. Only a subpopulation of day 19 small cells expressed CD11c and CD86. The population generated resembled primary LTC with small- and large-cell subsets, except that large LTC-DC expressed higher levels of CD86 than observed in primary LTC (Fig. 3).
Figure 6.
Small cells up-regulate expression of CD11c and CD86 with increase in size. Nonadherent cells were collected at day 19 from a stromal LTC seeded with small cells. Cells were incubated with specific anti-CD11c or anti-CD86 antibody followed by avidin-phycoerythrin. Controls comprised cells incubated with second-stage conjugate alone (shaded area).
When nonadherent large LTC-DC were transferred to irradiated stroma, cells survived for at least 4 weeks and were observed to increase in size over that time (data not shown). Large LTC-DC maintained expression of CD11c and CD86. A small increase in cell number was noted, but there was no other evidence that large LTC-DC were replicating. After 3–4 weeks, the FSC and SSC profile indicated that cell death was occurring. This may be due to breakdown in stromal cells after radiation. There was no evidence of a small subset forming over the 3- to 4-week period of the experiment.
Discussion
The nonadherent cell population in established LTC comprises two major subpopulations that differ in size and complexity. The size of each subset has remained constant over time, between individual LTC and across different mouse strains. It has remained constant after establishment of multiple LTC by passage of a mixture of stromal and nonadherent cells. Previous studies have shown the importance of maintaining small hemopoietic cells in LTC to perpetuate LTC-DC production (11, 12). The constant presence of these two subsets within LTC suggests that they are integral to the structure and continuation of the LTC system and that the small subset may contain progenitors of the large-cell subset. Cell surface marker analysis and cell transfer experiments have been important in confirming this hypothesis. Previously, it has been difficult to quantitate expression of cell surface markers on LTC-DC because of the high autofluorescence associated with very large cells. Two-color FACS analysis of LTC cells is now possible because of the development of a quenching method to reduce background autofluorescence (24).
Small and large LTC-DC subsets have been examined for coexpression of DC markers. The majority of large LTC-DC express CD11c as well as CD11b and DEC-205. They express moderate levels of CD86 and negative to low levels of MHCII. The uniform expression of DC markers by the large-cell subset, in combination with their morphology and potent antigen-presenting capacity (14), confirms that LTC produce a homogeneous population of large DC. This has been demonstrated for many LTC and over a period of several years. In contrast, the small-cell subset is much more heterogeneous. Small cells do not morphologically represent typical DC, and at least 50% of cells in the small subset lack expression of two or more DC markers. Subpopulations of small cells express CD11c, CD11b, DEC-205, and MHCII, but at lower levels in comparison with large LTC-DC.
The functional capacity of DC has been well defined in terms of maturation. Immature DC possess characteristics, such as FcR expression (6) and high endocytic capacity (22, 25), which facilitate efficient antigen capture. Mature DC have high expression of MHCII (6–8) and the costimulatory molecules, CD80 (9) and CD86 (10), allowing them to successfully stimulate T cells. The LTC system produces cells that resemble immature DC, with functional capacity reflecting early stages in DC maturation. Large LTC cells consistently express moderate levels of FcR and the early hemopoietic marker, c-kit. CD80 expression is high, CD86 is uniformly expressed at relatively lower levels, and MHCII is present in low levels on a majority of cells. This is consistent with immature DC, which are not yet capable of optimal T cell stimulation. The high endocytic capacity of large LTC-DC is also consistent with an immature DC phenotype. The small subpopulation (2.5%) of CD11c+ large cells that express very high levels of MHCII could represent a terminally mature subset of cells produced within LTC that are less endocytic but more efficient in T cell activation via MHCII.
The small-cell subset is heterogeneous, comprising cells that differ in stage of development and/or maturation, as demonstrated by variable size and complexity, endocytic activity, and expression of markers. Cells of the small subset are less differentiated than large LTC-DC. The small-cell subset contains a DC progenitor population that can regenerate the population of large, immature DC. Upon transfer to an irradiated stromal layer, small cells proliferate and differentiate into cells resembling those of the large-cell population produced in LTC. Increases in cell number over time demonstrate the ability of cells in the small subset to divide. Differentiation is indicated by increases in size, acquisition of dendrites, and up-regulation of expression of CD11c and CD86 on cells that were CD11c−/lo, CD86− when transferred onto stromal layers. This result clearly demonstrates the existence of a DC progenitor population maintained in spleen stroma-dependent LTC. Previous studies have investigated the possibility that LTC support a multipotential hemopoietic stem cell (HSC) population (26). This does not appear to be the case, although the presence of a very small number of HSC cannot be ruled out. Any progenitors or precursors contained within LTC appear to be committed to the DC lineage (26). This was confirmed in colony assays using nonadherent cells produced in LTC.
The study described here indicates that DC progenitors present in LTC are small, rounded cells lacking dendrites and are poorly endocytic. They are CD80+, CD86− and may express low levels of CD11c, CD11b, FcR, or c-kit. It is likely that new markers will be needed to define the DC progenitor population produced in LTC, as well as the DC progenitor population maintained in bone marrow and perhaps other organs of animals. The presence of two developmentally linked subsets within spleen LTC represents an opportunity to study some aspects of the development of DC from progenitors within a controlled in vitro environment and in the absence of added growth factors.
Acknowledgments
This work was supported by grants to H.O. from the National Medical Research Council of Australia, the Australian Research Council, and the Clive and Vera Ramaciotti Foundation.
Abbreviations
- DC
dendritic cells
- FACS
fluorescence-activated cell sorter
- FcR
Fc receptor
- FSC
forward light scatter
- LTC
long-term culture
- LTC-DC
LTC-derived DC
- MHCII
major histocompatibility complex class II
- OV-FITC
FITC-conjugated ovalbumin
- SSC
side light scatter
Footnotes
This paper was submitted directly (Track II) to the PNAS office.
Article published online before print: Proc. Natl. Acad. Sci. USA, 10.1073/pnas.080278897.
Article and publication date are at www.pnas.org/cgi/doi/10.1073/pnas.080278897
References
- 1.Ingulli E, Mondino A, Khoruts A, Jenkins M K. J Exp Med. 1997;185:2133–2141. doi: 10.1084/jem.185.12.2133. [DOI] [PMC free article] [PubMed] [Google Scholar]
- 2.Levin D, Constant S, Pasqualini T, Flavell R, Bottomly K. J Immunol. 1993;151:6742–6750. [PubMed] [Google Scholar]
- 3.Sallusto F, Cella M, Danielli C, Lanzavecchia A. J Exp Med. 1995;182:389–400. doi: 10.1084/jem.182.2.389. [DOI] [PMC free article] [PubMed] [Google Scholar]
- 4.Kitajima T, Caceres-Dittmar G, Tapia F J, Jester J, Bergstresser P R, Takashima A. J Immunol. 1996;157:2340–2347. [PubMed] [Google Scholar]
- 5.Jiang W, Swiggard W J, Heufler C, Peng M, Mirza A, Steinman R M, Nussenzweig M C. Nature (London) 1995;375:151–155. doi: 10.1038/375151a0. [DOI] [PubMed] [Google Scholar]
- 6.Sallusto F, Lansavecchia A. J Exp Med. 1994;179:1109–1118. doi: 10.1084/jem.179.4.1109. [DOI] [PMC free article] [PubMed] [Google Scholar]
- 7.Pierre P, Turley S J, Gatti E, Hull M, Meltzer J, Mirza A, Inaba K, Steinman R M, Mellman I. Nature (London) 1997;388:787–792. doi: 10.1038/42039. [DOI] [PubMed] [Google Scholar]
- 8.Nijman H W, Kleijmeer M J, Ossevoort M A, Oorschot V M, Vierboom M P, van de Keur M, Kenemans P, Kast W M, Geuze H J, Melief C J. J Exp Med. 1995;182:163–174. doi: 10.1084/jem.182.1.163. [DOI] [PMC free article] [PubMed] [Google Scholar]
- 9.Larsen C P, Ritchie S C, Pearson T C, Linsley P S, Lowry R P. J Exp Med. 1992;176:1215–1220. doi: 10.1084/jem.176.4.1215. [DOI] [PMC free article] [PubMed] [Google Scholar]
- 10.Inaba K, Witmer-Pack M, Inaba M, Hathcock K S, Sakuta H, Azuma M, Yagita H, Okumura K, Linsley P S, Ikehara S, et al. J Exp Med. 1994;180:1849–1860. doi: 10.1084/jem.180.5.1849. [DOI] [PMC free article] [PubMed] [Google Scholar]
- 11.Ni K, O'Neill H. Br J Haematol. 1997;97:710–725. doi: 10.1046/j.1365-2141.1997.00135.x. [DOI] [PubMed] [Google Scholar]
- 12.Ni K, O'Neill H. In Vitro Cell Dev Biol. 1998;34:298–307. doi: 10.1007/s11626-998-0006-0. [DOI] [PubMed] [Google Scholar]
- 13.Ni K, O'Neill H. Br J Haematol. 1999;105:58–67. [PubMed] [Google Scholar]
- 14.O'Neill H C, Ni K, Wilson H. Immunol Cell Biol. 1999;77:434–441. doi: 10.1046/j.1440-1711.1999.00851.x. [DOI] [PubMed] [Google Scholar]
- 15.O'Neill H C, Jonas N, Wilson H, Ni K. Cancer Biother Radiopharm. 2000;14:263–276. doi: 10.1089/cbr.1999.14.263. [DOI] [PubMed] [Google Scholar]
- 16.Crowley M T, Inaba K, Witmer-Pack M D, Gezelter S, Steinman R M. J Immunol Methods. 1990;133:55–66. doi: 10.1016/0022-1759(90)90318-p. [DOI] [PubMed] [Google Scholar]
- 17.Metlay J P, Witmer-Pack M D, Agger R, Crowley M T, Lawless D, Steinman R M. J Exp Med. 1990;171:1753–1771. doi: 10.1084/jem.171.5.1753. [DOI] [PMC free article] [PubMed] [Google Scholar]
- 18.Inaba K, Steinman R M, Witmer Pack M, Aya H, Inaba M, Sudo T, Wolpe S, Schuler G. J Exp Med. 1992;175:1157–1167. doi: 10.1084/jem.175.5.1157. [DOI] [PMC free article] [PubMed] [Google Scholar]
- 19.Inaba K, Inaba M, Romani N, Aya H, Deguchi M, Ikehara S, Muramatsu S, Steinman R M. J Exp Med. 1992;176:1693–1702. doi: 10.1084/jem.176.6.1693. [DOI] [PMC free article] [PubMed] [Google Scholar]
- 20.Doi H, Inaba M, Yamamoto Y, Taketani S, Mori S I, Sugihara A, Ogata H, Toki J, Hisha H, Inaba K, et al. Proc Natl Acad Sci USA. 1997;94:2513–2517. doi: 10.1073/pnas.94.6.2513. [DOI] [PMC free article] [PubMed] [Google Scholar]
- 21.Zhang Y, Zhang Y, Wang Y, Ogata M, Hashimoto S, Onai N, Matsushima K. Blood. 2000;95:138–146. [PubMed] [Google Scholar]
- 22.Koch F, Trockenbacher B, Kampgen E, Grauer O, Stossel H, Livingstone A M, Schuler G, Romani N. J Immunol. 1995;155:93–100. [PubMed] [Google Scholar]
- 23.Verfaillie C, Blakolmer K, McGlave P. J Exp Med. 1990;172:509–520. doi: 10.1084/jem.172.2.509. [DOI] [PMC free article] [PubMed] [Google Scholar]
- 24.Ni, K. & O'Neill, H. C. (2000) Immunol. Cell Biol., in press. [DOI] [PubMed]
- 25.Levine T P, Chain B M. Proc Natl Acad Sci USA. 1992;89:8342–8346. doi: 10.1073/pnas.89.17.8342. [DOI] [PMC free article] [PubMed] [Google Scholar]
- 26.Wilson H L, Ni K, O'Neill H C. Exp Hematol (Charlottesville, VA) 2000;28:193–202. doi: 10.1016/s0301-472x(99)00146-0. [DOI] [PubMed] [Google Scholar]


