Abstract
Serotonin N-acetyltransferase (arylalkylamine N-acetyltransferase, AANAT) regulates the daily rhythm in the production of melatonin and is therefore an attractive target for pharmacologic modulation of the synthesis of this hormone. Previously prepared bisubstrate analogs show potent inhibition of AANAT but have unfavorable pharmacokinetic properties due to the presence of phosphate groups which prevents transfer across the plasma membrane. Here we examine a bis-pivaloyloxymethylene (POM)-tryptamine-phosphopantetheine prodrug (2) and its biotransformations in vitro by homogenates and pineal cells. Compound 2 is an efficient porcine liver esterase substrate for POM cleavage in vitro although cyclization of the phosphate moiety is a potential side product. Tryptamine phosphopantetheine (3) is converted to tryptamine-coenzyme A (CoA) bisubstrate analog (1) by human phosphoribosyl pyrophosphate amidotransferase (PPAT) and dephosphocoenzyme A kinase (DPCK) in vitro. Compound 2 was found to inhibit melatonin production in rat pineal cell culture. It was also found that the POM groups are readily removed to generate 3; however, further processing to tryptamine-CoA (1) is much slower in pineal extracts or cell culture. Implications for CoA prodrug development based on the strategy used here are discussed.
1. Introduction
Melatonin is a major hormonal mediator of light-induced changes in circadian biology and has been implicated in the regulation of sleep, mood, and many other physiologic conditions1,2 Circulating melatonin levels rise and fall in a diurnal pattern which reflects daily changes in synthesis in the pineal gland. The largest and most critical changes occur in the activity of the penultimate enzyme in melatonin synthesis, serotonin N-acetyltransferase (arylalkylamine N-acetyltransferase, AANAT).3 Accordingly, specific inhibitors of this enzyme have potential utility in studies of melatonin function and as lead agents for the development of drugs for sleep and mood disorders.4
AANAT catalyzes the acetyl transfer from acetyl-CoA to the amine of serotonin and other arylalyklamines including tryptamine (Fig. 1). AANAT belongs to the GCN5 acetyltransferase (GNAT) superfamily of acetyltransferases, which are found in all forms of life and are characterized by a common acetyl-CoA binding motif).5 Members of this superfamily acetylate a wide range of substrates ranging from proteins to small molecules. Approximately 50 GNAT superfamily members have been annotated in humans.5(a)
Figure 1.
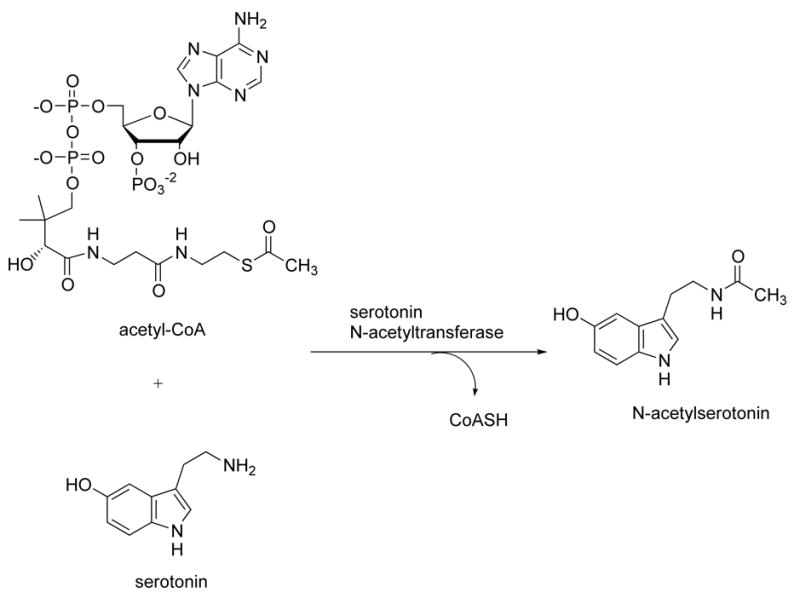
Serotonin acetyltransferase reaction catalyzed by AANAT.
Mechanistic studies on AANAT have revealed a sequential ordered BiBi kinetic pathway where acetyl-CoA binds to AANAT prior to tryptamine and the acetyl group is directly transferred without the involvement of a covalent acetyl-enzyme intermediate.6 Rather, a ternary arylalkylamine: acetyl-CoA complex is thought to form. Based on this, a bisubstrate analog (1) of the ternary complex was synthesized, which contains CoA linked to tryptamine via an acetyl bridge.4(i) This was found to bind to the active site of AANAT and to be a potent and selective AANAT inhibitor in vitro (Fig. 2). Compound 1 is not active in intact cells, which is expected for CoA-containing compounds because the multiple phosphate groups prevent membrane penetration.4(j) It was discovered that N-bromoacetyltryptamine and related compounds could serve as in vivo precursors to bisubstrate analogs such as 1 in an AANAT-catalyzed fashion. These compounds have been used to block melatonin production in cell culture and pineal explants.4 However, N-bromoacetyltryptamine and other halocarbonyl compounds also appear to interact directly with the melatonin receptor4(b) which erodes their potential as useful tools because this could lead to complex pharmacological effects. Moreover, α-halocarbonyl compounds are also intrinsically reactive as electrophiles, which further limits their utility. To our knowledge, no other line of investigation has yielded a small molecule inhibitor of AANAT with potential for in vivo use, leaving the field in need of novel approaches.
Figure 2.
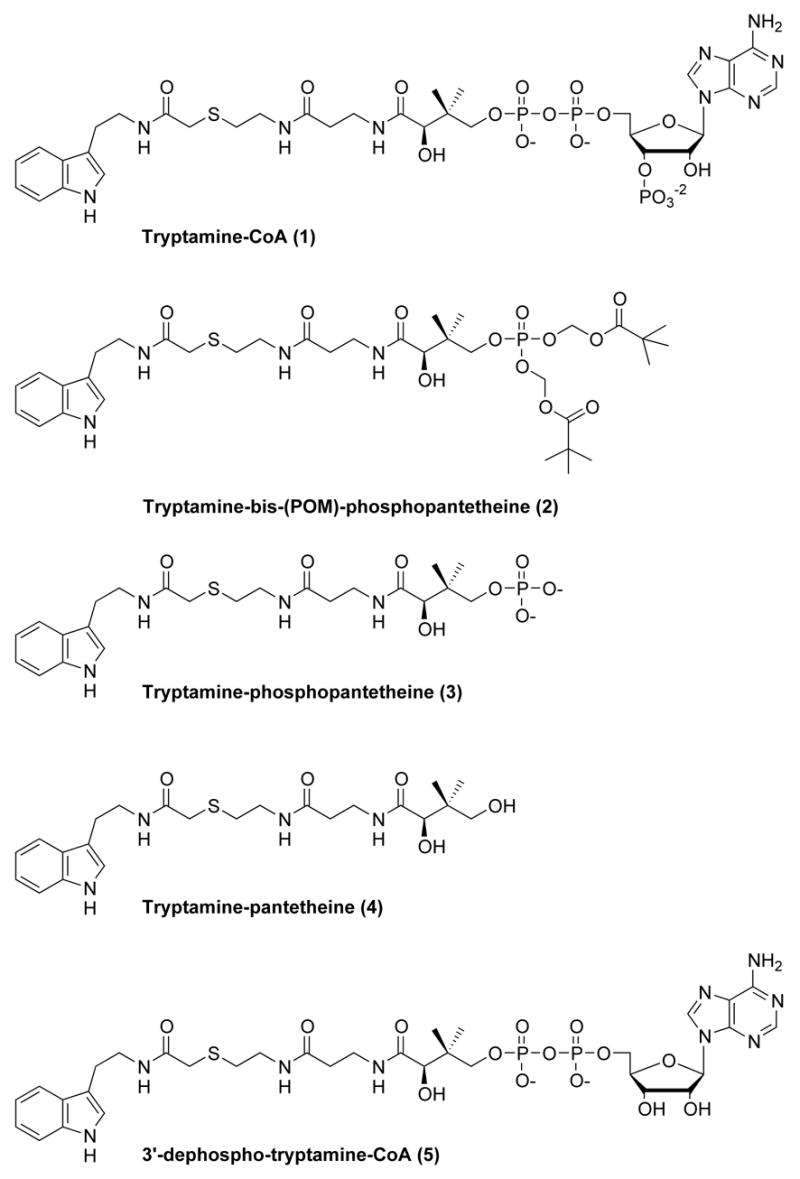
Tryptamine-CoA (1) and its analogs.
Towards this end, we have considered the possibility that the POM (pivaloyloxymethylene) phosphate protected compound 2 might serve as a cell active prodrug AANAT inhibitor (Fig. 3).7 Compound 2 could serve as a precursor of the phosphate compound 3. Compound 3 is a moderately potent inhibitor of AANAT with an apparent Ki of 6.5 μM, about 20-fold more potent than the corresponding non-phosphorylated analog 4.4(h) While 3 is not as potent as 1 (Ki ~50 nM), it is still attractive because intracellular concentrations that lead to inhibition of AANAT might be achieved. This could reflect both synthesis and accumulation secondary to the lower membrane permeability conferred by the phosphate group, which is likely to impede loss from the cytoplasm. Moreover, compound 3 can be viewed as a potential precursor of 3′-dephospho bisubstrate analog 5 via the action of phosphoribosyl pyrophosphate amidotransferase (PPAT).8 Compound 5 is an excellent AANAT inhibitor, with potency similar to 1.4(h) In addition, it is possible that compound 5 could be converted to 1 by cellular dephosphocoenzyme A kinase (DPCK).8 Here we have explored the properties of 2, 3, and 5 as metabolic precursors to 3, 5, and 1, respectively, in vitro. We also describe the inhibitory and metabolic properties of compound 2 in pinealocytes.
Figure 3.
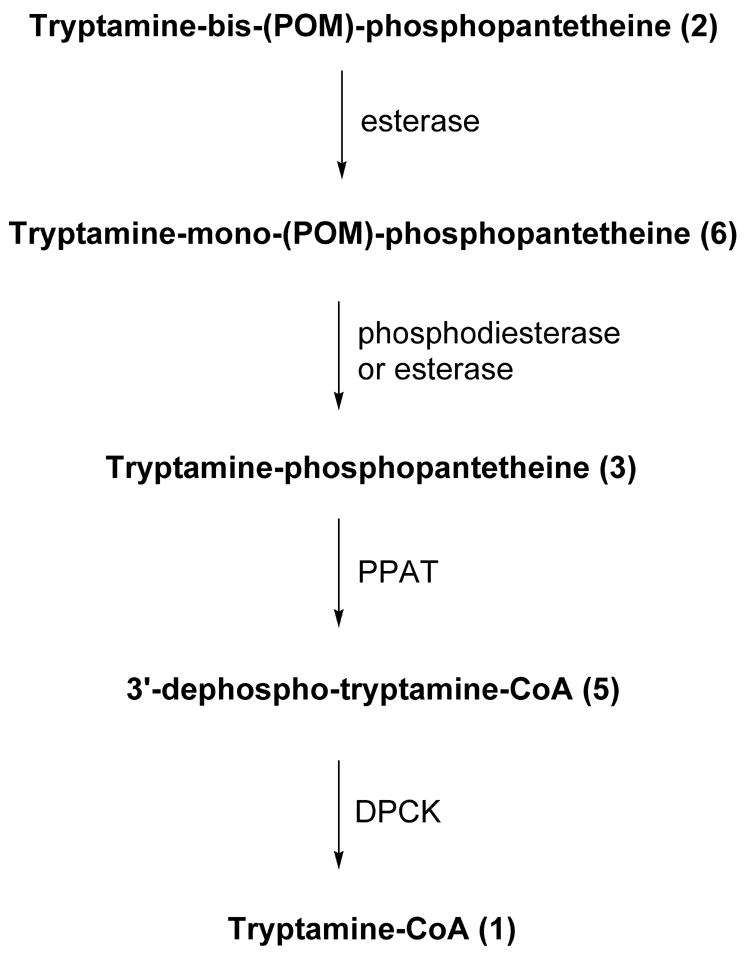
In vitro reconstitution of tryptamine-CoA.
2. Results
Compounds 1, 2, 3, and 5 were synthesized as reported.4(h), 9 To examine the ability of compound 2 to be hydrolytically processed, it was treated with porcine liver esterase.7(k) It was predicted that porcine liver esterase would likely liberate a single POM group in 2 to generate the tryptamine-mono(POM)-phosphopatetheine 6 (Fig. 4). Consistent with this prediction, treatment of 2 with porcine liver esterase generated 6 in a time-dependent manner. This was accompanied by formation of a side-product, as detected by HPLC. NMR and MS analysis revealed that this side-product had a structure consistent with 7 (two stereoisomers separable by chromatography), presumably resulting from intramolecular cyclization of 2. In separate experiments, formation of 7 from 2 was found to be non-enzymatic under identical buffer conditions (data not shown). Consistent with this observation, the ratio of 6:7 increased as a function of increasing concentrations of porcine liver esterase present in the reaction and independently, there was no direct conversion of 7 to 6. The ratio of enzymatic conversion of 2 to 6 versus nonenzymatic conversion of 2 to 7 is 4:1 when 1 unit/ml of porcine liver esterase was present. In analogy to related substrates,7(k) 6 was rather resistant to the action of porcine liver esterase, and we did not observe 6 to 3 conversion under these reaction conditions. However, it is likely that the 6 to 3 conversion would occur in cells, based on studies with related prodrugs in which a cellular phosphodiesterase catalyzed a similar conversion.
Figure 4.
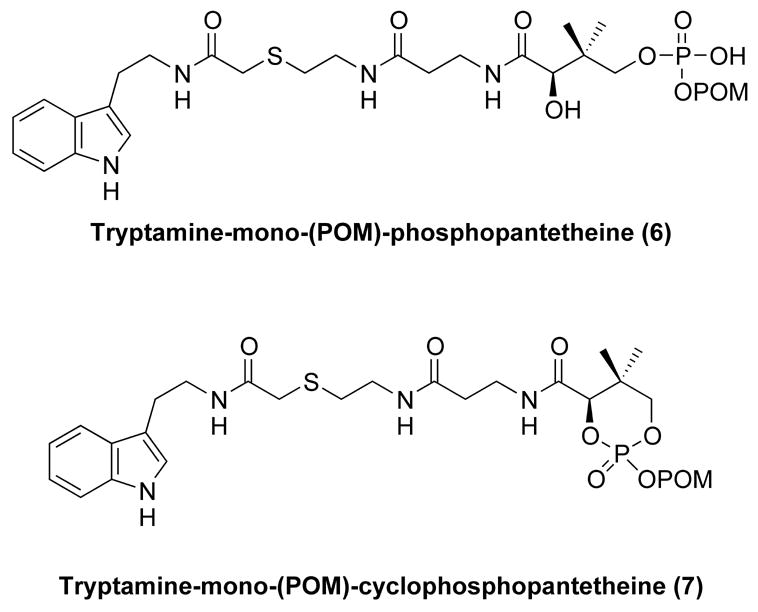
Intermediates generated during in vitro reconstitution.
We also studied the ability of compound 3 to be converted to 3′-dephospho bisubstrate analog 5 and/or 1 by treatment with recombinant bifunctional PPAT-DPCK. In humans, PPAT and DPCK are fused into a single polypeptide.8 Incubation of 3 with human recombinant PPAT-DPCK and ATP resulted in the formation of 5 (Fig. 5). Moreover, there was in situ 3′-phosphorylation of 3 by the action of DPCK, generating the potent AANAT bisubstrate inhibitor 1 (Fig. 5). It is noteworthy that the DPCK-catalyzed conversion of 3 to 1 appeared to be considerably more facile than observed previously for a similar S-alkyl-derivatized 3′-dephospho-CoA analog (a pseudo first-order rate constant 0.18 min−1, about 70-fold greater than the rate measured for conversion of 3′-dephopspho-Lys-CoA into Lys-CoA).7c These findings provide reason to suspect that the highly potent AANAT inhibitors 5 and 1 could be generated in cells from 3 if the relevant enzyme were present at sufficient concentrations.
Figure 5. HPLC analysis of in vitro reconstitution of tryptamine-CoA 1 from tryptamine-bis(POM)-phosphopantetheine 2.
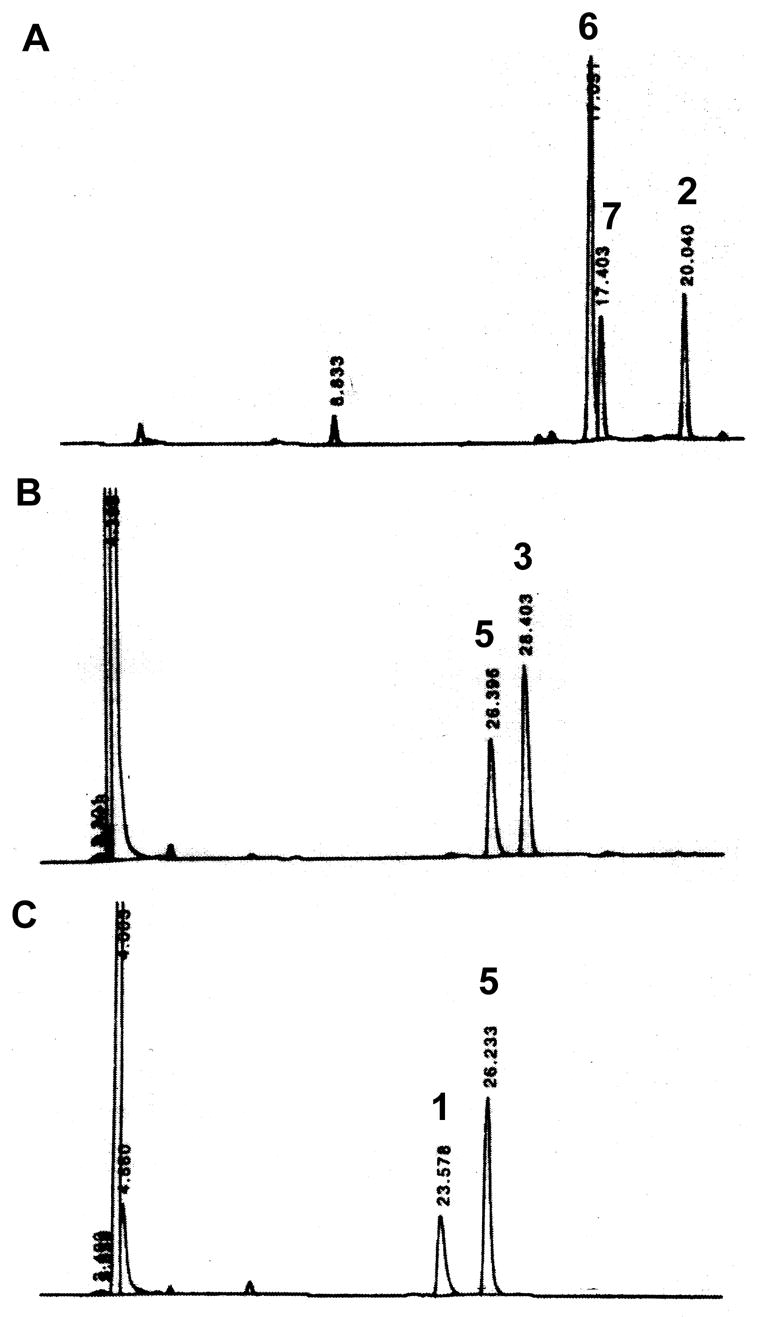
A. Conversion of tryptamine-bis (POM) phosphopantetheine 2 into tryptamine-mono(POM)-phosphopantetheine 6 by esterase hydrolysis. B. Conversion of tryptamine-phosphopantetheine 3 into 3′-phospho-tryptamine-CoA 5 by PPAT. C. 3′-Dephospho-tryptamine-CoA 5 into tryptamine-CoA 1 by DPCK. Products were separated on a RP-C18 column and monitored by UV absortion at 260 nm. Retention times are 20.0, 17.4, 17.0, 28.4, 26.3, 23.6 min for 2, 7, 6, 3, 5, 1, respectively.
Based on these encouraging findings, we examined the potential of compound 2 to block melatonin production in pinealocytes. In these experiments, cells are treated with norepinephrine (NE) to elevate AANAT activity, which in turn elevates melatonin production. Cells were treated with 0, 10, and 50 μM of 2 starting 90 min prior to NE treatment. Melatonin production was significantly inhibited (~50%) by 50 μM 2 (see Table 1). This effect did not appear to reflect cellular toxicity because the stimulation of AANAT activity by NE was not reduced; rather it appeared to be somewhat enhanced in the presence of 2 relative to NE alone. Together, these findings are consistent with the hypothesis the reduction in melatonin production by 2 is due to conversion to 3, 5, or 1.
Table 1.
Inhibitory properties of compound 2 in pineal cells.
| Treatment | Melatonin production (pmol/105 cells) | AANAT Activity (nmol/h/105 cells) |
|---|---|---|
| Control (N=6) | 0.3 ± 0.05 | not detected |
| NE (N=6)1 | 11.8 ± 1.25 | 1.2 ± 0.08 |
| NE + 2 (10 μM, ,N=6) | 9.0 ± 1.39 | 2.2 ± 0.12* |
| NE + 2 (50 μM, N=3) | 5.7 ± 0.18* | 1.6 ± 0.04* |
Cells were treated with 2 for 1.5 hours and then norepinephrine (NE) was added for the last 6 hours of culture. Significantly different from NE treatment group,
P<0.05.
To further investigate the possibility that compound 2 is being processed in the pineal gland, an LC/MS/MS method was developed to detect formation of compounds 3, 5, and 1. This revealed that pineal extracts catalyzed the conversion of 2 to 3 (Figure 6). As shown in Figure 6A, there was no detectable contaminant with spectral properties of compound 3 (shown in Fig. 6B) or evidence of buffer-catalyzed transformation of 2 to 3; in contrast, pineal extracts induced about 40% conversion (Fig. 6D).
Figure 6. Detection of compound 3 in pinealocyte extract.
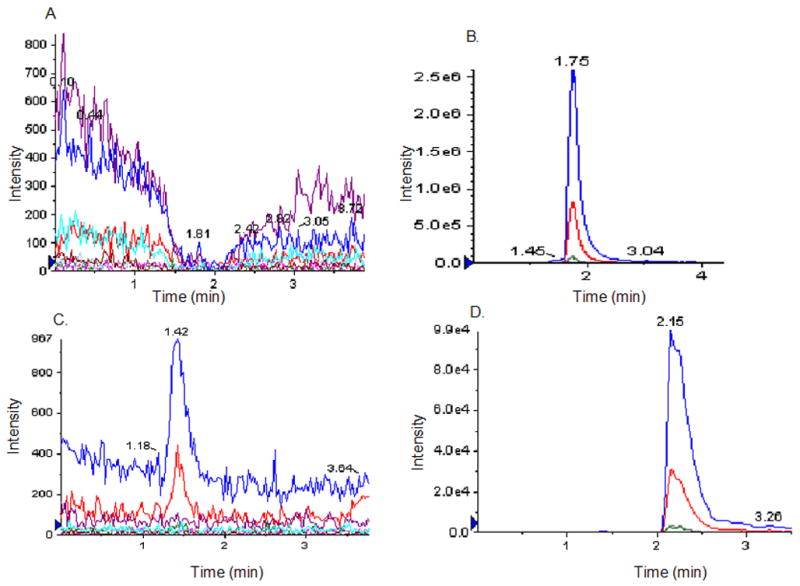
Compound 2 is processed by the pinealocyte extracts into compound 3. A, represents a typical elution profile of pinealocyte extract in Multiple Reaction Monitoring (MRM) mode developed to detect compounds 1, 3 and 5 simultaneously from samples as described in Experimental. B, Profile of 50 μM (30 μL injected volume) of compound 3 used as a standard. Product ions peaks, 79.1 (blue peak) and 97.0 (red peak) are generated from the target compound 3. C, control sample where Compound 2 was incubated in NH4-acetate buffer for 60 min. D, sample where Compound 2 was incubated in pinealocyte extract for 60 min at 37°C as described in Experimental. Intensity of signal represents 10% of the compound 3 formed in the extract. Compound 3 formation in C was estimated to be about 40% of the compound 2 input in 60 min, using the peak intensity of the standard in B. Compound 1 and 5 formation could not be detected in the pinealocyte extract under the conditions used.
Pinealocytes incubated with compound 2 converted ~15% to 3 (Figure 7) in a time-dependent manner (Figs. 7A-C); a signal corresponding to 3 was not detected in cells that were not incubated with 2 consistent with the conclusion that 3 was formed from 2 (Fig. 7D). In contrast, convincing evidence of formation of 5 or 1 was not obtained (<10% conversion, data not shown); this may reflect lack of sensitivity of the method. However, given the 100-fold enhanced potency of 5 and 1 relative to 3 for AANAT inhibition, we cannot rule out that small levels of 5 and 1, in addition to 3, contributed to melatonin blockade.
Figure 7. Cellular processing of compound 2. Ability of intact pinealocytes to take up and process compound 2.
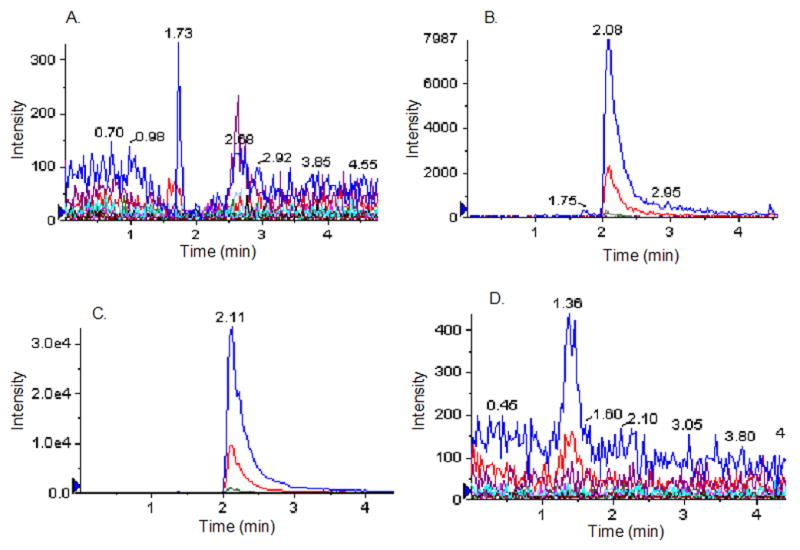
A. Zero time control. 50 μM of compound 2 incubated with intact pineal cells and immediately washed, lysed and deproteinated as described in Experimental. B. 20 min incubation of compound 2 in pinealocyte culture. The immediate product, compound 3 was detected in the cell extracts prepared from compound 2-treated pinealocyte culture. C. 60 min incubation of compound 2 in pinealocyte culture. D. control, represents the product ion profile of compound 3 in extracts of the untreated pinealocyte culture. The profiles shown are representatives of multiple experiments.
3. Discussion
Here we have investigated the in vitro properties of a phosphopantothenate-related prodrug 2 and its potential as an inhibitor of AANAT in pinealocytes. Compound 2 was effectively hydrolyzed in vitro and in cell culture, resulting in loss of POM groups. While the resultant phosphate 3 was an efficient substrate for PPAT, and subsequently DPCK, in homogenates, these transformations were not detected in cell culture, perhaps because of limited sensitivity.
The prodrug 2 was capable of blocking melatonin production in pinealocytes, which could be ascribed to the intracellular formation of 3 and possibly small amounts of 5 and 1. These studies suggest a new strategy to block melatonin production and outline an approach that may have utility for other coenzyme A utilizing enzymes. Importantly, this method avoids α-halocarbonyl electrophilic compound, which are unattractive because of their inherent reactivity and potential non-selectivity. The strategy used here does, however, have the potential disadvantage of formaldehyde formation from POM. Although formaldehyde is toxic, it is a common metabolite in cellular systems as a byproduct of demethylases10 among other enzymes; accordingly, it is clear that detoxifying mechanisms exist to prevent toxic effects of low levels of formaldehyde; such mechanisms might buffer formaldehyde formation from POM. Further optimization of the potency of 2 may be achieved by linker and aryl substitutions as described previously.4(g), 4(h)
The prediction of biotransformation of 2 in human cells is difficult, as is the case with all prodrugs that require endogenous enzymes, because this involves many factors. For example, while 3 was an efficient substrate for human recombinant PPAT and DPCK in vitro, this was apparently not the case in rat pinealocytes. Whether this is because of differences between the human and rat enzymes or low expression levels of PPAT/DPCK in rat pinealocytes is unknown; this issue is, however, of special importance for future investigations. It is possible that compound 3 was responsible for all of the melatonin inhibition observed in pineal cells because it is relatively potent (Ki 6.5 μM). It is not unreasonable that it could accumulate to these levels because once formed, because, as discussed above, 3 is unlikely to be able to exit cells.
While the studies done focused on AANAT, it should be noted that the approach might well be relevant to other CoA-dependent enzymes. It is likely that the phosphopantetheine moiety will show variable levels of inhibitory potency depending on the CoA target. These studies do favor the possibility that for phosphopanetheine derivatives that do not require further modification by PPAT, POM derivatization is a promising delivery vehicle. These POM-protected agents may show cellular selectivity of inhibition because of the diversity of strategies for recognition of the coenzyme A structure by different proteins.
4. Experimental
4.1. General
The bifunctional human PPAT/DPCK enzyme was prepared as a recombinant protein as described elsewhere.8 The esterase from porcine liver was purchased from Sigma-Aldrich (41unit/mg, one unit will hydrolyze 1.0 μmol of ethyl butyrate to butyric acid and ethanol per minute at pH 8.0 at 25°C). The synthesis of tryptamine-CoA (1), tryptamine-phosphopantetheine (3), tryptamine-pantetheine (4), and 3′-dephospho-tryptamine-CoA (5) are described elsewhere.4(h) All other reagents for chemical synthesis were purchased from Aldrich and used without further purification. Nuclear magnetic resonance spectra were obtained with a Varian Mercury 400 MHz instrument. Electrospray ionization mass (ESI-MS) spectra were obtained with API 150EX (PE Biosystems). FABHRMS was obtained at the UC Riverside MS facility.
4.2. In vitro esterase assay
Compounds (0.2 mM final concentration) were incubated with 1 to 4 unit(s) porcine liver esterase at 30°C for the times indicated in 50 mM NaH2PO4 buffer (pH 7.0). The progress of the assay was monitored by analytical reversed phase HPLC using 50 mM KH2PO4 (pH 4.5) in water (mobile phase A) and 80% aqueous acetonitrile (mobile phase B); flow rate =1 mL/min, a linear gradient from 0 to 100% B over 20 min. retention time: tryptamine-bis-(POM)-phosphopantetheine (2), 20.0 min, tryptamine-phosphopantetheine (3), 8.8 min, tryptamine-mono-(POM)-phosphopantetheine (6), 17.0 min and tryptamine-mono-(POM)-cyclophosphopantetheine (7), 17.4 min.
4.3. In vitro PPAT-DPCK assay
The reaction mixture contained 50 mM Tris (pH 8.0), 10 mM MgCl2, 20 mM KCl, 1 mM dithiothreitol, 50 μg/mL bovine serum albumin, 5 mM ATP, 0.5 mM the tested compound and 2 nM to 2 μM purified recombinant enzyme. Reaction mixtures were incubated at 37°C and samples were removed as required and quenched by the addition of 6 μL of 0.5 M EDTA. The quenched solutions were passed through Microncon filters (10kDa MW cutoff, Millipore Corp.) and analyzed by reversed phase HPLC using 50 mM KH2PO4 (pH 4.5) in water (mobile phase A) and 80% aqueous acetonitrile (mobile phase B); flow rate =1 mL/min, a linear gradient from 0 to 20% B over 40 min, retention time: tryptamine-CoA (1), 23.6 min, tryptamine-phosphopantetheine (3), 28.4 min and 3′-dephospho-tryptamine-CoA (5), 26.4 min, respectively.
4.4. Preparation of compounds 2, 6, 7
Tryptamine-bis-(POM)-phosphopantetheine (2)
To an ice cooled solution of chlorobis(POM)-phosphate9 (79 mg, 0.276 mmol) in methylene chloride (0.8 mL), tryptamine-pantetheine (4) (25 mg, 0.0522 mmol) and 2,6-lutidine (81 μl, 0.70 mmol) were added and stirred overnight slowly warming to rt. The reaction mixture was directly loaded onto silica gel column and eluted with ethyl acetate and methanol (v/v=10/1). The eluent was concentrated and further purified by preparative HPLC using water (mobile phase A) and acetonitrile (mobile phase B) with a linear gradient from 0 to 100%B for 60 min in a flow rate of 10 mL/min. The collected portion was lyophilized to give a give a foamy oil (17 mg, 41% yield).
FABHRMS (M+H+) calcd for C35H55N4O12NaPS 809.3167, found m/z 809.3132. 1H NMR (400 MHz, DMSO-d6) δ 8.10 (t, 1H), 8.02 (t, 1H), 7.77 (t, 1H), 7.51 (d, J=8.0Hz, 1H), 7.31 (d, J=8Hz, 1H), 7.13 (s, 1H), 7.04 (t, 1H, 7.2Hz), 6.96 (t, 1H, 6.8Hz), 5.57 (d, J=5.6Hz, 4H), 3.92 (dd, J1=4.8Hz, 9.6Hz, 1H), 3.82 (dd, J=4.4Hz, 9.6Hz, 1H), 3.63 (d, J=6.0Hz, 1H), 3.22-3.33 (m, 4H), 3.20 (m, 2H), 2.80 (t, J=7.2Hz, 2H), 2.57 (t, J=7.2Hz, 2H), 2.25 (t, J=6.8Hz, 2H), 1 .15 (s, 18H); 31P NMR (160MHz, DMSO-d6)–2.61(s)
Tryptamine-mono-(POM)-phosphopantetheine (6)
Tryptamine-bis-(POM)-phosphopantetheine (2) (0.5 mM, 10 mL) was incubated with PLE (5 unit/mL) in 50 mM NaH2PO4 buffer (pH 7.0) for 1 h at rt. The mixture was lyophilized, redissolved in 20% aqueous methanol and purified by semi-preparative HPLC using 50 mM KH2PO4 (pH 4.5) in water (mobile phase A) and 80% aqueous acetonitrile (mobile phase B); flow-rate 5 mL/min, a linear gradient from 0 to 100% B in 40 min. The compound thus collected was desalted by reinjection on the same HPLC column, washing with ddH2O for 10 min then eluting with 100% methanol.
ES-MS (M-H+) calcd for C29H44N4O10PS 671.25, found m/z 672.0; 1H NMR (400MHz, D2O) 7.51 (d, J=8.4Hz, 1H), 7.31 (d, J=7.6Hz, 1H), 6.97–7.07 (m, 3H), 5.31 (d, J=12.8Hz, 2H), 5.83 (s, 1H), 3.61 (m, 1H), 3.41–3.45 (m, 3H), 3.28 (t, J=6.80Hz), 2.97 (s, 2H), 2.84–2.91 (m, 4H), 2.23 (t, J=6.4Hz, 2H), 2.10 (t, J=6.80Hz, 2H), 1.03 (s, 9H), 0.78 (s, 3H), 0.69 (s, 3H); 31P NMR (160MHz, D2O)–0.180 (s)
Tryptamine-mono-(POM)-cyclophosphopantetheine (7)
Tryptamine-bis-(POM) phosphopantetheine (2) was incubated at rt for 30 h in 50 mM KH2PO4 (pH 7.4). The mixture was purified by preparative HPLC using water (mobile phase A) and acetonitrile (mobile phase B); flow rate 10 mL/min, a linear gradient from 0 to 100% B for 60 min. Fractions eluting at ~ 40 min were collected, lyophilized and further separated into two isomers by silica gel column chromatography by first eluting with ethyl acetate/methanol = 20/1(v/v) and then with 10/1(v/v).
Isomer 1: ES-MS (M-H+K+) calcd for C29H42KN4O9PS 692.20 found m/z 693.0; 1H-NMR 8.76 (bs, 1H), 7.60 (d, J=8.0Hz, 1H), 7.40 (d, J=8.0Hz, 1H), 7.21 (t, J=6.8Hz, 1H), 7.06–7.17 (m, 3H), 6.81 (br, 1H), 6.01 (br, 1H), 5.69 (dd, J=5.2Hz, 14.8Hz, 1H), 5.64 (dd, J=5.2Hz, 12.4Hz, 1H), 4.55 (s, 1H), 4.15 (d, J=11.2Hz, 1H), 3.83 (dd, J=11.2Hz, 24.8Hz, 1H), 3.65 (q, J=6.0Hz, 2H), 3.52 (m, 2H), 3.24 (q, J=6.8Hz, 2H), 3.15 (br, 2H), 3.03 (t, J=6.4Hz, 2H), 2.46 (br, 2H), 2.32 (t, J=6.0Hz, 2H), 1.21 (s, 9H), 1.12 (s, 3H), 1.11 (s, 3H); 31P-NMR–9.541 (s)
Isomer 2: ES-MS (M-H+K+) calcd for C29H42KN4O9PS 692.20 found m/z 693.0; 1H-NMR 8.61 (bs, 1H), 7.61 (d, J=7.6Hz, 1H), 7.37 (d, J=7.2Hz, 1H), 7.09–7.26 (m, 4H), 6.77 (br, 1H), 6.06 (br, 1H), 5.75 (dd, J=4.8Hz, 11.2Hz, 1H), 5.66 (dd, J=4.8Hz, 14.4Hz, 1H), 4.73 (s, 1H), 4.30 (dd, J=3.8Hz, 11.2Hz, 1H), 3.86 (dd, J=12.0Hz, 23.2Hz, 1H), 3.48–3.67 (m, 4H), 3.19–3.32 (m, 2H), 3.14 (s, 2H), 3.03 (t, J=6.0Hz, 2H), 3.45 (t, J=6.4Hz, 2H), 2.34–2.40 (m, 2H), 1.23 (s, 9H), 1.17 (s, 3H), 1.09 (s, 3H); 31P-NMR–5.716 (s)
4.5. Pineal cell metabolism studies using LC/MS/MS
LC/MS/MS method development
A liquid chromatography-quadrupole linear ion trap mass spectrometer system (Q TRAP® 2000, Applied Biosystems) was used. The system was connected on-line to SB-C18 column (Zorbax, 3.5 μm, Agilent) and the data was acquired by using Analyst 1.4 software. Q TRAP was operated in negative mode; with the curtain gas set to 35 (arbitrary Units) and the source temperature was 350°C. A multiple reaction monitoring (MRM) transitions for the compounds were selected from the list of parameters obtained after quantitative optimization of the compounds, infused separately. 50% aqueous methanol was used as the solvent and mobile phase. The detection method was developed by selecting parameters for two product ions for each compound with highest intensity values. Optimized values of parameters for each product ion chosen to detect compound 1 and 3 in MRM mode (negative) are shown in Table 2.
Table 2.
Mass spectrometric properties of compounds 3 and 1 optimized to detect the responses in Multiple Reaction Monitoring (MRM) mode.
| Compound | Precursor ion M/z –1 | Product ion mass | DP/EP/CEP (Volts) | CXP (Volts) |
|---|---|---|---|---|
| 3 | 557.158 | 79
97 |
−116/−7/−30
−116/−7/−30 |
−52
−2 |
| 1 | 443.6 (2 ‘-’ charges) | 79
134 |
−66/−12/−26
−66/−12/−26 |
0
−2 |
A triple quadrupole MS/MS system operated in MRM mode fragments an ion of given mass (Precursor ion) to produce product ions (two ions selected for each precursor) in order for a response to be detected. The product ion dependent parameters optimized in negative mode for the Q TRAP® 2000 are Declustering Potential (DP), Entrance Potential (EP), Collision cell Entrance Potential (CEP), and Collision cell Exit Potential (CXP). The instrument values for each product ion fragmented from respective precursor are listed.
Pinealocyte culture
Pinealocytes were prepared from rat pineal glands as described previously.11 Briefly, pineal glands were digested with 20 U−1ml papain (Worthington, NJ) and 200 U−1 ml DNase I (Worthington) in Earle’s balance salt solution for 1 h at 37°C. After digestion, glands were triturated to obtain single cell suspension and passed through a 40 μm cell strainer (BD Falcon, Bedford, MA). Cells were harvested, washed and suspended in Dulbecco’s modified Eagle’s media supplemented with 10% fetal calf serum.
Preparation of pinealocyte extract and treatment with compound 2
About 100,000 pinealocytes, prepared as above, were harvested and washed twice by combination of centrifugation (1000×g for 5 min) and suspension of the cell pellet in phosphate buffered saline (PBS). The washed cells were again collected by centrifugation (1000 × g for 5 min) and the pellets were rinsed once with 0.1 mM ammonium acetate (pH 6.8) and finally suspended in 50 μL of ammonium acetate buffer. The suspended cells were lysed by brief sonication and centrifuged (10000×g for 5 min) to remove debris. The supernatant was used as the extract to monitor the metabolites of compound 2. Compound 2 (50 μM) was added to the extract and incubated at 37°C for 60 min. The reaction was stopped by adding 50 μL of ice-cold methanol to precipitate proteins. The solution was clarified by centrifugation at 10000×g for 10 min and was analyzed by LC/MS/MS as described elsewhere.
Monitoring the cellular processing of compound 2
To identify metabolites of compound 2 in intact pineal cells, compound 2 (50 μM) was added to the pinealocyte culture (100,000 cells/0.25 mL). Following incubation (37°C; 20 or 60 min), the cells were harvested as described.11 The cell pellets were then washed twice with distilled water and re-suspended in 50 μL of 50% methanol and lysed by brief sonication. The samples were then clarified by centrifugation at 10000×g for 10 min and the supernatants were collected and injected into the C18 column using auto-sampler 1100 (Agilent), fractionated and finally analyzed by LC/MS/MS as described above. Sample (30 μL) was injected in each case and flow rate was maintained at 300 μL/min using 50% aqueous methanol as mobile phase.
4.6. Pineal cell melatonin production and AANAT activity studies
Rat pinealocytes were cultured as described previously.12 Cells were treated with the indicated concentrations of compound 2 90 min prior to stimulation with norepinephrine (NE) for 6 h. Melatonin levels were measured by radioimmunoassay and AANAT activity by radioactive assay as described.12
Acknowledgments
We thank the NIH for intramural (D.C.K.) and extramural (P.A.C.) financial support.
Footnotes
Publisher's Disclaimer: This is a PDF file of an unedited manuscript that has been accepted for publication. As a service to our customers we are providing this early version of the manuscript. The manuscript will undergo copyediting, typesetting, and review of the resulting proof before it is published in its final citable form. Please note that during the production process errors may be discovered which could affect the content, and all legal disclaimers that apply to the journal pertain.
References
- 1.Arendt J. Melatonin and the Mammalian Pineal Gland. Chapman & Hall; London: 1995. [Google Scholar]
- 2.(a) Maestromi GJ, Conti A, Pierpaoli W. Immunology. 1988;63:465. [PMC free article] [PubMed] [Google Scholar]; (b) Harlow HJ. J Pineal Res. 1987;4:147. doi: 10.1111/j.1600-079x.1987.tb00851.x. [DOI] [PubMed] [Google Scholar]; (c) Lewy AJ, Sack RL, Miller LS, Hoban TA. Science. 1987;235:352. doi: 10.1126/science.3798117. [DOI] [PubMed] [Google Scholar]; (d) Iguchi H, Kato K, Ibayashi H. J Clin Endocrin Metab. 1982;55:27. doi: 10.1210/jcem-54-5-1025. [DOI] [PubMed] [Google Scholar]; (e) Akerstedtn. 219;79(4) [Google Scholar]; (f) Cohen M, Chabner B. Lancet. 1978;ii:814. doi: 10.1016/s0140-6736(78)92591-6. [DOI] [PubMed] [Google Scholar]
- 3.(a) Klein DC, Weller JL. Science. 1970;169:1093. doi: 10.1126/science.169.3950.1093. [DOI] [PubMed] [Google Scholar]; (b) Coon SL, Roseboom PH, Baler R, Weller JL, Namboodiri MAA, Koonin EV, Klein DC. Science. 1995;270:1681. doi: 10.1126/science.270.5242.1681. [DOI] [PubMed] [Google Scholar]; (c) Borijin J, Wang MM, Snyder SH. Nature. 1995;378:783. doi: 10.1038/378783a0. [DOI] [PubMed] [Google Scholar]; (d) Klein DC, Roseboom PH, Coon SL. Trends Endocrinol Metab. 1996;7:106. doi: 10.1016/1043-2760(96)00033-1. [DOI] [PubMed] [Google Scholar]; (e) Klein DC, Coon SL, Roseboom PH, Weller JL, Bernard M, Gastel JA, Zatz M, Iuvone PM, Rodriquez IR, Begay V, Falcon J, Cahil GM, Cassone VM, Baler R. Recent Prog Hormone Res. 1997;52:307. [PubMed] [Google Scholar]
- 4.(a) Boutin JA, Audinot V, Ferry G, Delagrange P. Trends Pharmacol Sci. 2005;26:412. doi: 10.1016/j.tips.2005.06.006. [DOI] [PubMed] [Google Scholar]; (b) Ferry G, Ubeaud G, Mozo J, Pean C, Hennig P, Rodriguez M, Scoul C, Bonnaud A, Nosjean O, Galizzi JP, Delagrange P, Renard P, Volland JP, Yous S, Lesieur D, Boutin JA. Eur J Biochem. 2004;271:418. doi: 10.1046/j.1432-1033.2003.03942.x. [DOI] [PubMed] [Google Scholar]; (c) Zheng W, Cole PA. Bioorg Chem. 2003;31:398. doi: 10.1016/s0045-2068(03)00081-6. [DOI] [PubMed] [Google Scholar]; (d) Zheng W, Cole PA. Curr Med Chem. 2002;9:1187. doi: 10.2174/0929867023370013. [DOI] [PubMed] [Google Scholar]; (e) Beaurain N, Mesangeau C, Chavatte P, Ferry G, Audinot V, Boutin JA, Delagrange P, Bennejean C, Yous S. J Enzyme Inhib Med Chem. 2002;17:409. doi: 10.1080/1475636021000005721. [DOI] [PubMed] [Google Scholar]; (f) Ferry G, Loynel A, Kucharczyk N, Bertin S, Rodriguez M, Delagrange P, Galizzi JP, Jacoby E, Volland JP, Lesieur D, Renard P, Canet E, Fauchere JL, Boutin JA. J Biol Chem. 2000;275:8794. doi: 10.1074/jbc.275.12.8794. [DOI] [PubMed] [Google Scholar]; (g) Kim CM, Cole PA. J Med Chem. 2001;44:2479. doi: 10.1021/jm010049v. [DOI] [PubMed] [Google Scholar]; (h) Khalil EM, De Angelis J, Ishii M, Cole PA. Proc Natl Acad Sci USA. 1999;96:12418. doi: 10.1073/pnas.96.22.12418. [DOI] [PMC free article] [PubMed] [Google Scholar]; (i) Khalil EM, Cole PA. J Am Chem Soc. 1998;120:6195. [Google Scholar]; (j) Robisaw JD, Neely JR. Am J Physiol. 1985;248:E1. doi: 10.1152/ajpendo.1985.248.1.E1. [DOI] [PubMed] [Google Scholar]; (k) Lewczuk B, Zheng W, Prusik M, Cole PA, Przybylska-Gornowicz B. Neuro Endocrinol Lett. 2005;26:581. [PubMed] [Google Scholar]
- 5.(a) Vetting MW, S de Carvalho LP, Yu M, Hegde SS, Magnet S, Roderick SL, Blanchard JS. Arch Biochem Biophys. 2005;433:212. doi: 10.1016/j.abb.2004.09.003. [DOI] [PubMed] [Google Scholar]; (b) Marmorstein R. J Mol Biol. 2001;311:433. doi: 10.1006/jmbi.2001.4859. [DOI] [PubMed] [Google Scholar]; (c) Dyda F, Klein DC, Hickman AB. Annu Rev Biophys Biomol Struc. 2000;29:81. doi: 10.1146/annurev.biophys.29.1.81. [DOI] [PMC free article] [PubMed] [Google Scholar]; (a) Newald AF, Landsman D. Trends Biochem Sci. 1997;22:154. doi: 10.1016/s0968-0004(97)01034-7. [DOI] [PubMed] [Google Scholar]
- 6.De Angelis J, Gastel J, Klein DC, Cole PA. J Biol Chem. 1998;273:3045. doi: 10.1074/jbc.273.5.3045. [DOI] [PubMed] [Google Scholar]
- 7.(a) Khan SR, Nowak B, Plunkett W, Farquhar D. Biochem Pharmacol. 2005;69:1307. doi: 10.1016/j.bcp.2005.02.008. [DOI] [PubMed] [Google Scholar]; (b) Troutman JM, Chehade KA, Kiegiel K, Andres DA, Spielmann HP. Bioorg Med Chem Lett. 2004;14:4979. doi: 10.1016/j.bmcl.2004.07.017. [DOI] [PubMed] [Google Scholar]; (c) Cebrat M, Kim CM, Thompson PR, Daugherty M, Cole PA. Bioorg Med Chem. 2003;11:3307. doi: 10.1016/s0968-0896(03)00265-7. [DOI] [PubMed] [Google Scholar]; (d) Rutschow S, Thiem J, Kranz C, Marquardt T. Bioorg Med Chem. 2002;10:4043. doi: 10.1016/s0968-0896(02)00269-9. [DOI] [PubMed] [Google Scholar]; (e) Rose JD, Parker WB, Someya H, Shaddix SC, Montgomery JA, Secrist JA., III J Med Chem. 2002;45:4505. doi: 10.1021/jm020107s. [DOI] [PubMed] [Google Scholar]; (f) Kang SH, Sinhabadu AK, Cho MJ. Nucleosides Nucleotides. 1998;17:1089. doi: 10.1080/07328319808004222. [DOI] [PubMed] [Google Scholar]; (g) Kang SH, Sinhabadu AK, Cory JG, Mitchell BS, Thakker DR, Cho MJ. Pharm Res. 1997;14:706. doi: 10.1023/a:1012133902314. [DOI] [PubMed] [Google Scholar]; (h) Lefebvre I, Perigaud C, Pompon A, Aubertin AM, Girardet JL, Kirn A, Gosselin G, Imbach JL. J Med Chem. 1995;38:3941. doi: 10.1021/jm00020a007. [DOI] [PubMed] [Google Scholar]; (i) Farquhar D, Khan S, Srivasta DN, Saunders PP. J Med Chem. 1994;37:3902. doi: 10.1021/jm00049a009. [DOI] [PubMed] [Google Scholar]; (j) Sastry JK, Nehete PN, Khan S, Nowak BJ, Plunkett W, Arlinghaus RB, Fahrquhar D. Mol Pharmacol. 1991;41:441. [PubMed] [Google Scholar]; (k) Srivasta D, Fahrquhar D. Bioorg Chem. 1984;12:118. [Google Scholar]; (l) Farquhar D, Srivasta DN, Kuttesch NJ, Saunders PP. J Pharm Sci. 1983;72:324. doi: 10.1002/jps.2600720332. [DOI] [PubMed] [Google Scholar]
- 8.Daugherty M, Polanuyer B, Farrell M, Scholle M, Lykdis A, de Crecy-Lagard V, Osterman A. J Biol Chem. 2002;273:11017. doi: 10.1074/jbc.M201708200. [DOI] [PubMed] [Google Scholar]
- 9.Hwang Y, Cole PA. Org Lett. 2004;6:1555. doi: 10.1021/ol049714v. [DOI] [PubMed] [Google Scholar]
- 10.Shi Y, Lan F, Matson C, Mulligun P, Whestine JR, Cole PA, Casero RA, Shi Y. Cell. 2004;119:941. doi: 10.1016/j.cell.2004.12.012. [DOI] [PubMed] [Google Scholar]
- 11.Schaad NC, Parfitt A, Russell JT, Schaffner AE, Korf HW, Klein DC. Brain Res. 1993;614:251. doi: 10.1016/0006-8993(93)91042-q. [DOI] [PubMed] [Google Scholar]
- 12.Ho AK, Chik CL. Am J Phys. 1992;26:E481. doi: 10.1152/ajpendo.1992.263.3.E481. [DOI] [PubMed] [Google Scholar]


