Abstract
In this work, a number of important issues associated with fast spin echo (FSE) imaging of the human brain at 4.7 T are addressed. It is shown that FSE enables the acquisition of images with high resolution and good tissue contrast throughout the brain at high field strength. By employing an echo spacing (ES) of 22 ms, one can use large flip angle refocusing pulses (162°) and a low acquisition bandwidth (50 kHz) to maximize the signal-to-noise ratio (SNR). A new method of phase encode (PE) ordering (called “feathering”) designed to reduce image artifacts is described, and the contributions of RF (B1) inhomogeneity, different echo coherence pathways, and magnetization transfer (MT) to FSE signal intensity and contrast are investigated. B1 inhomogeneity is measured and its effect is shown to be relatively minor for high-field FSE, due to the self-compensating characteristics of the sequence. Thirty-four slice data sets (slice thickness = 2 mm; in-plane resolution = 0.469 mm; acquisition time = 11 min 20 s) from normal volunteers are presented, which allow visualization of brain anatomy in fine detail. This study demonstrates that high-field FSE produces images of the human brain with high spatial resolution, SNR, and tissue contrast, within currently prescribed power deposition guidelines. Magn Reson Med 51:1254-1264, 2004.
Keywords: high-field FSE, feathering, T2-weighted MRI, structural MRI, high-field MR
Over recent years, the use of high-field MR scanners for imaging the human body has become increasingly wide-spread, due to the improvements they offer in signal-to-noise ratio (SNR) and susceptibility contrast (1,2). These benefits can be exploited to allow 1) the acquisition of MR images with higher spatial resolution and thus greater anatomical detail, 2) more robust detection of susceptibility-related changes in signal intensity (e.g., BOLD contrast in functional MRI (fMRI)), and 3) easier discrimination of metabolite signals in MR spectra, due to increased dispersion as well as higher SNR.
Along with the advantages of high-field MR systems, there are also associated problems, ranging from technical challenges to safety concerns. At higher fields, the wavelength of the RF excitation pulses approaches the dimensions of the object being imaged, causing inhomogeneities in the RF (B1) field via RF focusing effects (3). As a result, the RF flip angle varies over the imaging field of view (FOV), potentially leading to variations in both signal intensity and contrast across images. In addition, the RF power required for spin excitation increases with the magnetic field strength. This means, for some RF-intensive pulse sequences, that the power deposition may exceed permissible specific absorption rate (SAR) safety limits.
In this work, we describe the implementation and application of a standard clinical MRI pulse sequence on a high-field 4.7-T whole-body system. The pulse sequence we implemented is fast spin echo (FSE) (4,5). FSE is used clinically as an efficient method for obtaining high-quality T2-weighted images. However, the extension to high field is not necessarily straightforward, due to the aforementioned issues of B1 inhomogeneity and SAR power restrictions. In a recent study, we presented our initial results concerning FSE imaging at 4.7 T (6). Here we investigate in more detail the factors involved in using FSE as a technique for imaging the human brain at 4.7 T. To do this, we assess the extent of B1 variation within the brain and its effect on image signal intensity, implement and develop acquisition methods that minimize B1 sensitivity and ghost artifacts, and examine the various factors that determine the tissue contrast in FSE images at high field. High-spatial-resolution FSE images (469 μm × 469 μm × 2000 μm) of normal volunteers are presented that display excellent SNR and anatomical detail.
MATERIALS AND METHODS
All imaging was performed with the use of a 4.7 Tesla, 90-cm-diameter bore magnet (Magnex Scientific Ltd., Oxford, UK) controlled by a console supplied by Philips Medical Systems (Eindhoven, Holland), based on an MR5000 design by SMIS Ltd. A shielded head gradient coil was used (Magnex Scientific Ltd., Oxford, UK), which provided gradient fields of up to 36 mT/m with a maximum slew rate of 195 mT/m/ms. Images were acquired by means of a transmit/receive four-port drive birdcage RF coil (7) with an internal diameter of 28 cm. Normal, healthy volunteers were scanned after they provided informed consent, and the protocol was approved by the University College London Hospital Ethics Committee.
FSE Pulse Sequence
The FSE pulse sequence was implemented in the standard way, with phase encode (PE) gradient rewinding and slice select and read gradients arranged to allow coherent superposition of SE and stimulated-echo coherence pathways. The echo train length (ETL) was eight echoes, and the RF pulses were applied with the Carr-Purcell-Meiboom-Gill (CPMG) phase modulation scheme (i.e., αx – [βy]n, where α is the excitation pulse, β is the refocusing pulse, and N = 8). The echo time (TE) of the first echo was 22 ms, and the echo spacing (ES) was 22 ms. Conventional sinc RF pulses were used for both signal excitation and refocusing, with relative amplitudes of 1:1.8 (see Results for an explanation of this choice). Image data sets were acquired with a slice thickness of 2 mm and an in-plane resolution of 0.469 mm (FOV = 240 mm × 180 mm [read × PE]; image resolution = 512 × 384 [50 kHz sampling bandwidth, PE oversampled by a factor of 2]). At the beginning of the scan, a non-phase-encoded echo train was acquired and used for phase correction of the imaging data. Thirty-four slices were acquired with a repetition time (TR) of 7 s, which resulted in a total scan time of 11 min 20 s. The SAR for the sequence with the above parameters was calculated to be below current safety guidelines of 4 W/kg for short exposure times for the head (8).
k-Space Coverage: PE Scheme
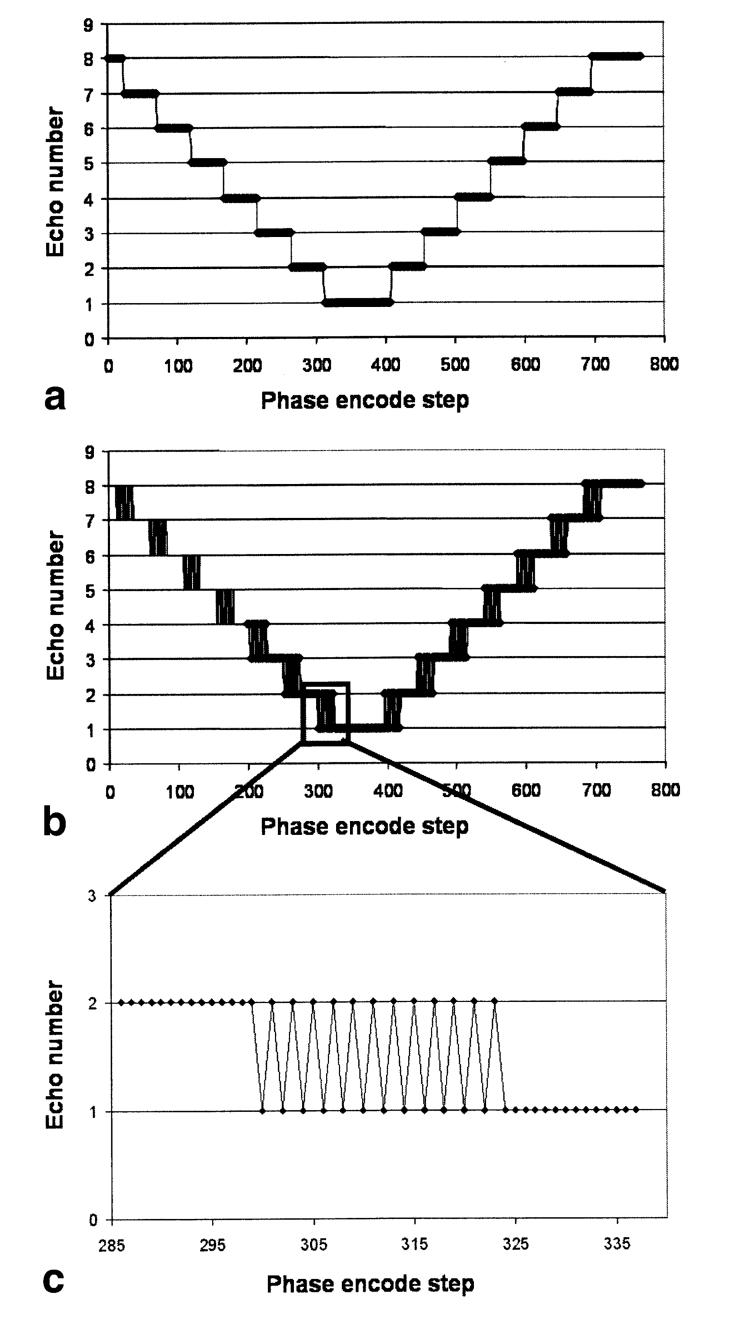
An important factor that determines FSE image quality is the phase-encode k-space sampling scheme (9). In general, echoes with the same amplitude (i.e., echoes at the same position in the echo train from different acquisitions) are assigned to the same region of k-space, in order to minimize the number of amplitude discontinuities in the k-space data (9). However, when the interecho spacing is not negligible compared to the T2 value of the object being imaged (which is the case for brain tissue at 4.7 T with the FSE sequence described above), significant steps in signal amplitude will still occur between adjacent points in k-space with different TEs. This will lead to degradation of the point spread function (PSF) and image artifacts. To reduce this problem, we introduced a modification to the PE scheme, as shown in Fig. 1. In this method, which we call “feathering”, the sudden step between one signal amplitude and the next is modified so that the signal oscillates between the two levels over a certain region of k-space, similar to the “chopping” (10) and Nyquist modulated echo-to-view mapping (11) schemes previously proposed for artifact reduction in FSE imaging. The period of oscillation is twice the distance between k-space sample points (see Fig. 1c). Thus, the odd sidebands of the PSF are reduced and the main source of image artifact is relegated to the edges of the FOV in the PE direction. When oversampling is performed in this direction, these artifacts do not interfere with the main image.
FIG. 1.
Comparison of PE schemes for FSE imaging. a: The standard method groups together echoes of equal amplitude in k-space to make the signal behavior in k-space as smooth as possible. However, due to the decay of signal between echoes, steps in amplitude occur at the edges of the groupings, which cause image artifacts. b and c: With the “feathering” technique, the sudden steps are modified so that over a certain number of points in k-space, the signal amplitude alternates between one level and the next. This is done to shift the image artifacts outside of the imaging region, and hence reduce the amount of signal interference and image degradation (see Fig. 2).
We performed computer simulations to investigate the effect of the different PE schemes on the PSF of the image. For simplicity, the echo amplitudes were assumed to follow a monoexponential T2 decay along the echo train (i.e., assuming perfect 180° refocusing pulses), with a T2 of 50 ms (corresponding approximately to that of WM at 4.7 T) and ES = 22 ms. To directly visualize the effect on image quality, FSE images were acquired with the standard PE scheme (9) and the feathering modification on a single subject in the same scanning session. In both cases, oversampling by a factor of 2 was performed in the PE direction.
B1 Field Mapping
To assess the extent of B1 inhomogeneity likely to be present in a typical study, we obtained B1 field maps in human heads. Previous experiments with a uniform paraffin oil phantom had shown the B1 homogeneity of the birdcage RF coil to be good (using the convention of Alecci et al. (12), the B1 field was within 10% of its peak value over approximately 14 cm in the sagittal (x) direction, and 8 cm in the axial (z) direction). We performed B1 mapping using single-shot echo-planar imaging (EPI) preceded by a hard RF pulse of variable duration. By changing the duration of the hard RF prepulse, the spin magnetization is made to precess by different amounts depending on the local B1 field. The transverse magnetization generated by the prepulse is eliminated by the use of spoiler gradients, leaving only the longitudinal component available to be sampled by the subsequent EPI acquisition. Examination of the EPI pixel signal intensities as a function of RF prepulse duration shows a cosinusoidal oscillation, the frequency of which is proportional to local B1 intensity. Thus, B1 field strength can be calculated on a pixel-by-pixel basis by Fourier transformation (FT) of the complex signal as a function of prepulse duration. A range of prepulse durations from 0 ms to 5 ms, varied in steps of 0.1 ms, was used. The data were zero-filled to 512 points prior to FT, resulting in a ν1 resolution of approximately 20 Hz (where ν1(Hz) = (γ/2π) · B1(T), or effectively the B1 field expressed in units of Hz).
Sensitivity of the Echo Amplitude to the RF Flip Angle (I): Simulations
We performed computer simulations to compare the behavior of the echo train signal amplitude for a range of different excitation/refocusing flip angles, and to investigate the effect of B1 inhomogeneity on image signal uniformity in the FSE sequence. The simulations were based on Hennig’s extended phase graph algorithm description of the behavior of spin magnetization in the presence of multiple RF pulses (13). In the case of perfect refocusing pulses (β= 180°), only SEs are generated and the extended phase graph simplifies to a sawtooth pattern around the central axis. As the refocusing pulses deviate from 180°, the outer sections of the phase diagram become important in determining the amplitudes of later echoes. The first echo always remains an SE. Stimulated echoes are here described by transverse magnetization that is stored along the z-axis following a refocusing pulse and is subsequently recalled by a later refocusing pulse. The recalled magnetization rephases during the read gradient and thus contributes to the signal. Careful arrangement of the spatial encoding gradients is essential to ensure that the stimulated echoes combine coherently with the SEs. To quantify the importance of the stimulated-echo signal to the total echo amplitude, the full simulated FSE signal was compared with the signal obtained from only the SE component. This allowed us to evaluate the compensation of SE signal loss due to imperfect refocusing pulses by the stimulated-echo contribution. These simulations were performed in two ways: 1) the excitation pulse was assumed to be 90° and the refocusing pulse amplitudes were varied (to examine exclusively the signal dependence on the refocusing pulse flip angle), and 2) all pulses were varied in the same manner (to simulate a variation in the overall B1 field). In the former case, relaxation effects were ignored. In the latter case, the ratio of the excitation and refocusing pulse amplitudes was 1:1.8, and relaxation times of 1800 ms and 200 ms were assumed for T1 and T2, respectively, to match the phantom relaxation times (see below).
Sensitivity of the Echo Amplitude to the RF Flip Angle (II): Experiment
A glass vial (5 cm long, 1.6 mm internal diameter) was filled with 1.5% agar gel doped with copper sulphate (37.5 mg/100 ml) and sodium chloride (870 mg/100 ml). The relaxation times of this phantom were T1 = 1800 ± 50 ms and T2 = 200 ± 10 ms. B1 maps of the phantom were acquired as described above. The resulting B1 maps were reasonably homogenous, with a region of interest (ROI) covering 95% of the phantom showing a variation of 98-102% of the mean B1 value.
Single-slice FSE echo trains of the phantom were acquired with the PE gradient turned off. The amplitude of the excitation pulse was varied between 75% and 125% of its calibrated 90° value, while the ratio of 1:1.8 was maintained between the excitation and refocusing pulses. This range matches the measured variation of B1 over the head (see Results). FSE acquisition was performed exclusively on a single slice to avoid the confounding effects of magnetization transfer (MT), direct saturation, and slice overlap.
Effect of TE and Slice Acquisition Order on SNR and Contrast
To investigate differences in apparent T2 weighting, we acquired images with effective TEs (TEeff) of 22, 44, and 66 ms (where TEeff is defined as the TE of the echo that covers the central region of k-space). Since MT is expected to play a large role in determining the contrast of FSE (9,14), the change in contrast with TE is not necessarily straightforward to predict. We assessed the magnitude of the MT effect in the multislice FSE sequence used in this study by acquiring image data sets with reversed slice order (i.e., the same axial slices acquired in both the inferior-superior direction and the superior-inferior direction). This affects the MT weighting of the lowest and highest slices, since for one acquisition mode the excitation of neighboring slices immediately before slice acquisition will cause a significant amount of MT weighting, whereas for the other acquisition mode most (or, for the outermost slice, all) of the neighboring slices are excited after slice acquisition, resulting in a minimal MT effect.
Active RF Power Modulation for Axial Scans
The B1 homogeneity of a birdcage RF coil is known to be worst along the axial direction (12). It has been suggested that active RF transmit power modulation compensates for this effect in images acquired with axial orientation (15), and this approach was implemented in the FSE sequence described here. Based on the B1 field map measurements, the parabolic dependence of B1 on position along the axial direction was calculated for a range of subjects, and an average value was determined. However, because of the increased importance of RF focusing effects at 4.7 T, the profile of the B1 field variation is highly dependent on head position within the RF coil, which varies between subjects (and potentially between different scans on the same subject). It was found that although the overall shape of the B1 profile was consistent between subjects, the location of the peak B1 amplitude depended on head position, with the B1 “hotspot” always occurring at same location within the brain (approximately at the level of the third ventricle), rather than at the same position relative to the RF coil. Therefore, a look-up table was generated based on the inverse of the average measured parabolic coefficient of the B1(z) profile (az, where and z0 is the position of maximum B1 in the brain), and the center was offset by a distance determined from a sagittal B1 contour image, which allowed identification of the position of the B1 hotspot (as discussed by Deichmann et al. (16)). The RF transmit amplitude was calibrated on a single slice at position z0, and then varied on a slice-by-slice basis according to slice offset and the corresponding scaling factors in the look-up table. To verify the efficacy of this approach, we acquired a 17-slice axial image data set with a large slice thickness (8 mm) in order to achieve continuous whole-brain coverage within a reasonable scan time.
Image Reconstruction
For image reconstruction, a Hanning filter was applied to the raw 512 × 768 data matrix for each slice (to the first and last one-eighth of the data). Zero-filling was then performed along the PE direction to produce a 512 × 1024 matrix, to which a 2D-FT was applied. The central 512 × 512 portion of the resulting images were filtered by means of SharpView™ (17) for noise reduction and structure enhancement.
RESULTS
Feathering vs. Standard PE Approach
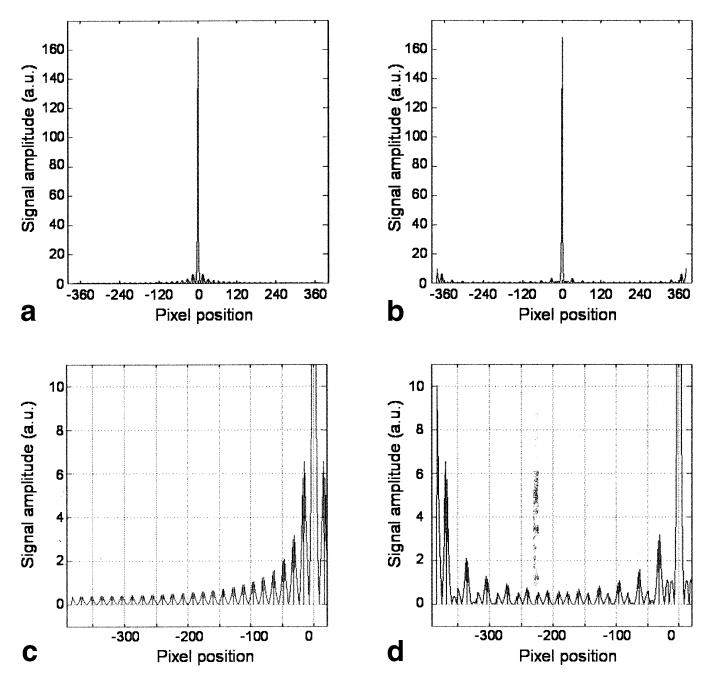
Figure 2 shows a comparison of the PSFs associated with the standard PE scheme and the new feathering approach. The central peak has the same value for the two schemes, but when feathering is used, the odd side-lobes are moved to the edges of the image. Since the first side-lobes on either side of the main peak are the largest, they are likely to be the main source of PSF-based image artifact.
FIG. 2.
Comparison of the PSF of FSE using (a) conventional and (b) feathering PE schemes. The amplitude of the central peak is the same in both cases, but the behavior of the side-lobes differs. c and d: Magnified sections of a and b, respectively. For the feathering approach, the main side-lobes (which appear on either side of the main peak in the conventional approach) are shifted to the edge of the FOV. If oversampling is performed in the PE direction, these side-lobes will not appear in the image, thus eliminating this source of image artifact.
The effect of feathering on image quality is demonstrated directly in Fig. 3. Figure 3a shows an image acquired with the standard PE scheme, and Fig. 3b shows the same imaging slice acquired with feathering. A slight reduction in the level of artifactual signal intensity oscillation on either side of the interhemispheric fissure is observed. This is most easily seen by plotting the profiles of pixel intensity along the PE direction from both images (Fig. 3c) and the difference between these profiles (Fig. 3d). The oscillatory behavior of signal intensity when feathering is not employed is apparent. Using the feathering approach with 2× oversampling in the PE direction eliminates this source of artifact and correspondingly improves the overall image quality.
FIG. 3.
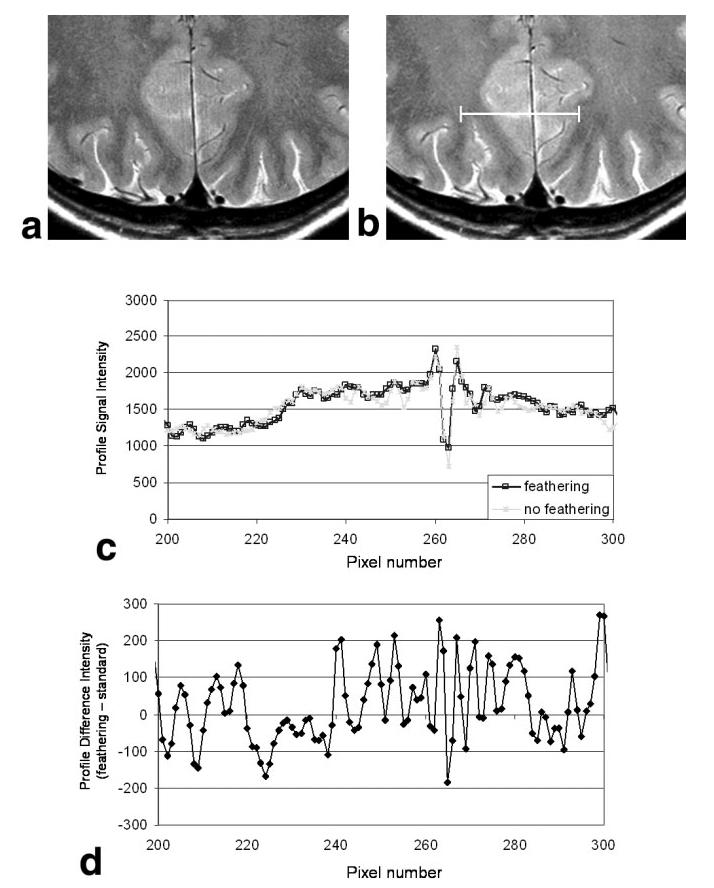
Comparison of image artifacts in FSE images acquired with (a) the standard PE scheme and (b) the feathering approach. c: Profiles of pixel intensity from two images shown in a and b, measured along the white line shown in b. The oscillations associated with the side-lobes of the PSF when feathering is not used can be seen, and are more apparent when the difference between these two profiles (feathering-standard) is plotted, as in d. These oscillatory artifacts are removed to outside the imaging FOV when feathering is used.
B1 Field Maps
With a dielectric constant (εr) of approximately 55 (18), the human head has comparable dimensions to the radiation wavelength at 200 MHz , where c is the speed of light, μr is the relative permeability of the head (assumed to be one), and ν0 is the Larmor frequency of 200 MHz). Therefore, wave superposition effects are expected to contribute to the B1 field distribution, as has been observed previously at high field (18,19). The distribution of the B1 field in the human head at 4.7 T is shown in Fig. 4. The RF pulse amplitude (ν1) was intended to be 500 Hz, based on a calibration with hard pulses according to the method of van der Meulen and van Yperen (20). However, it can be seen that the actual ν1 values vary between approximately 400 Hz and 700 Hz in the displayed slices. The B1 hotspot is located in the posterior section of the corpus callosum and has a value of ν1 = 680 Hz (N.B., the resolution of the ν1 measurement is 20 Hz). B1 maps acquired after the subjects were repositioned showed that the hotspot remained in the same brain location, reflecting the dominance of RF focusing effects on the B1 distribution (data not shown). As described above, this is important to consider when implementing B1 compensation schemes.
FIG. 4.

ν1 Field maps of the human head at 4.7 T (where ν1 = (γ/2π) · B1). The maps were acquired in the (a) axial, (b) coronal, and (c) sagittal planes, with the dotted lines on each image indicating the locations of the other images. The resolution of the maps is approximately 20 Hz. Although the nominal calibrated ν1 was 500 Hz, the maximum value in the head is ∼680 Hz. The numbers superimposed on the maps show local ν1 expressed as a percentage of this highest value.
Sensitivity of the Echo Amplitude to the RF Flip Angle
Figure 5 shows the simulated theoretical signal amplitude for the echoes of an FSE echo train (ETL = 8) as a function of refocusing pulse flip angle (a) without and (b) with contributions from stimulated echoes. Relaxation was ignored in these simulations (to isolate the effect of varying the refocusing flip angle), and so in both cases the echo amplitude is constant and maximum (normalized to one) when the refocusing flip angle is 180° (corresponding to perfect SEs). As the refocusing flip angle decreases, the decrease in the amplitude of the SE signal along the echo trains rapidly becomes significant (Fig. 5a; e.g., for a 165° refocusing pulse, the eighth echo has the minimum amplitude of 0.8716, and for 90° the eighth echo is also the minimum echo with an amplitude of 0.0039). Conversely, when the stimulated echo signal also contributes (Fig. 5b), the echo train amplitude is relatively constant, with an asymptotic value that is slightly higher than the amplitude of the first echo (the first echo amplitude is proportional to sin2[β/2], whereas the asymptote is proportional to sin [β/2] (13)). Therefore, with the combination of SE and stimulated-echo coherence pathways, the echo amplitude weighting of k-space is reasonably uniform across the sample, even in the presence of B1 inhomogeneity (e.g., for a 165° refocusing pulse, the first echo has the minimum amplitude of 0.983, and for a 90° pulse the first echo is also the minimum, with a value of 0.5). Additionally, Fig. 5b demonstrates the reason for the choice of an excitation: refocusing pulse ratio of 1:1.8, which corresponds to pulse flip angles of 90° and 162°, respectively. From the graph, it is apparent that the difference in echo amplitude between a refocusing pulse of 180° and 165° is negligible, but the reduction in RF power is significant (∼16%). However, the choice of refocusing pulse flip angle made here was arbitrary, and could be reduced further to decrease power deposition without significantly compromising the SNR of the images.
FIG. 5.
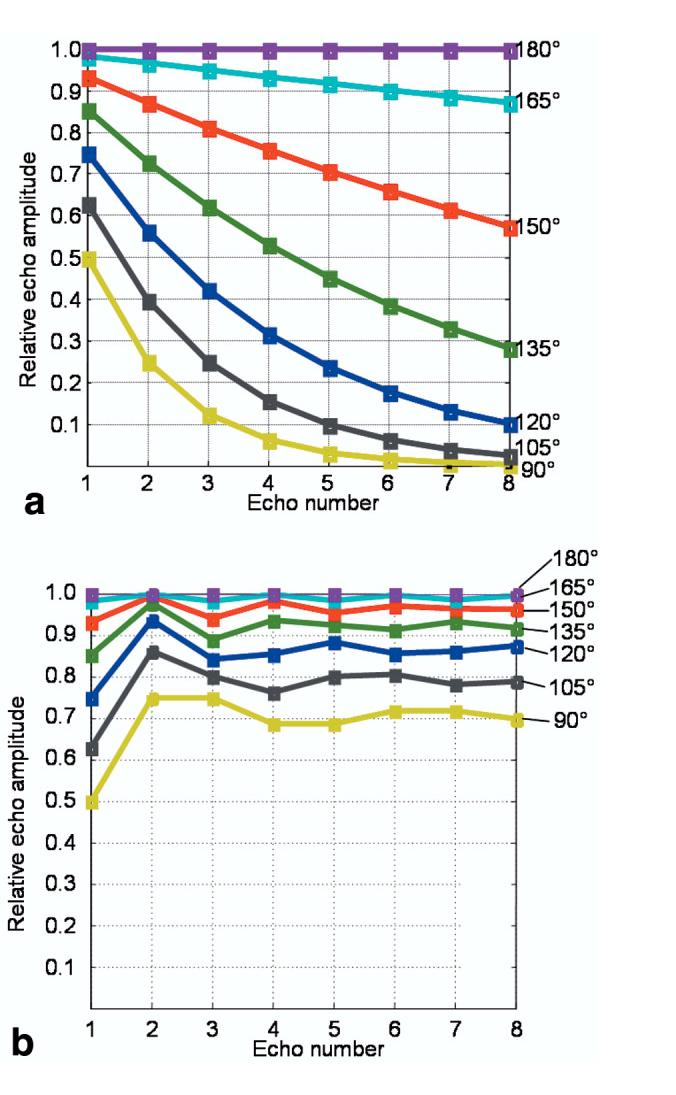
Simulated FSE echo amplitudes for a range of refocusing pulse flip angles when (a) only the SE signal is included, and (b) both SEs and stimulated echoes contribute to the signal. The presence of stimulated echoes greatly helps to maintain a constant signal amplitude throughout the echo train.
The B1 inhomogeneity tolerance of the FSE sequence is also demonstrated in Fig. 6, which shows how the echo amplitude varies as a function of RF pulse amplitude for the first three echoes of the train. Figure 6a shows the simulation results when only the SEs are taken into account. Figure 6b shows the simulation result with stimulated echoes also accounted for, demonstrating a flattening of the curves (except the first, which is the same in both cases) and thus a decreased sensitivity to B1 variation. Figure 6c shows the experimental verification of the simulation, with the use of the small agar phantom. It can be seen that the simulation and experimental data match well (i.e., compare Fig. 6b and c), which confirms the contribution of stimulated echoes to the observed signal. Over the range of flip angles shown (±25% around the ideal pulse powers), the amplitude of the signal from the first three echoes varies by approximately 67% of the maximum for the SE signal only, and by 35% of the maximum when SE and stimulated-echo signals are combined.
FIG. 6.
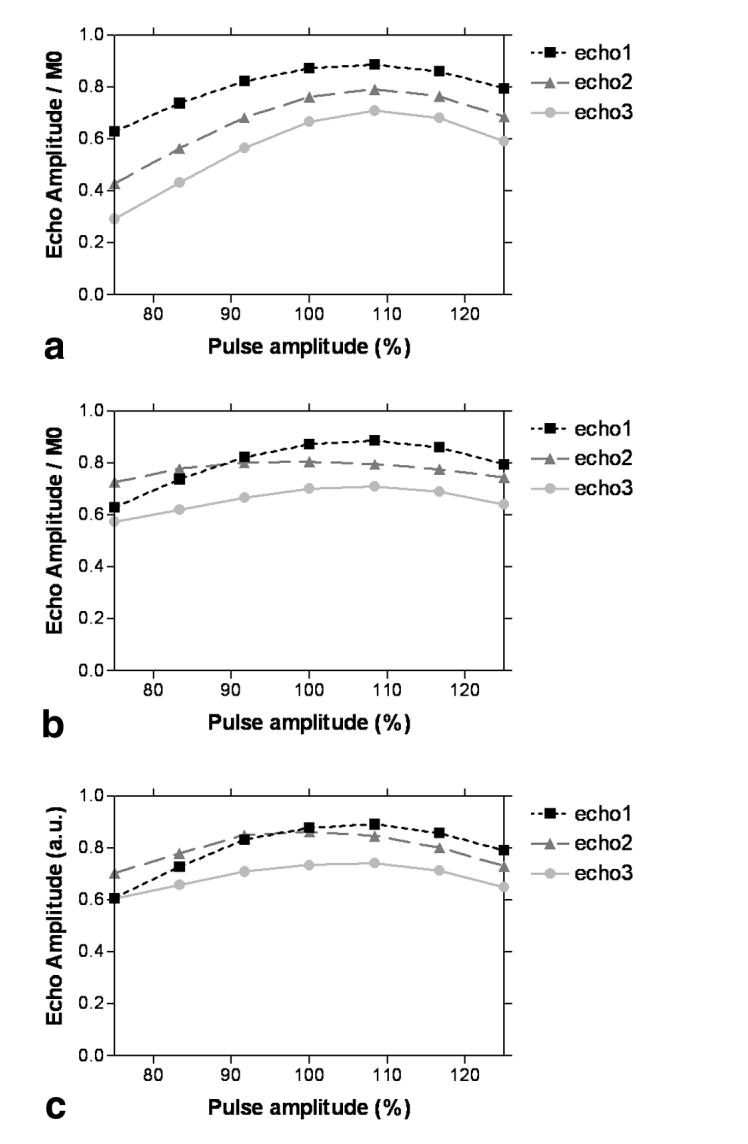
Variation of the amplitude of the first three echoes of the FSE echo train as a function of RF pulse amplitude (where 100% corresponds to a 90° excitation pulse and 162° refocusing pulses). a: Simulated data using only the SE signal. b: Simulated data using both SE and stimulated-echo data. c: Experimental data from a small agar phantom. Note the good correspondence between b and c, confirming the significance of the stimulated-echo contribution to the sampled FSE signal.
FSE Brain Images
Figure 7 shows some examples of FSE brain images. The images are displayed with an inverted grayscale with respect to the conventional MR image presentation. This was found to facilitate visualization of some of the finer details of the images. Due to the high resolution and SNR of the images, a number of anatomical features are visible that are not usually observed on FSE images obtained at the standard clinical field strength of 1.5 T. For example, Fig. 7a shows a transverse slice of a 34-year-old female volunteer, and the white arrows indicate some of the thin structures known as Virchow-Robin spaces. These are also seen in structural scans acquired at 1.5 T, but their number and extent in young healthy brains is very limited, and their conspicuity in the 4.7-T FSE images appears to be far greater. The Virchow-Robin spaces are also readily observable in the more inferior transverse slice of a 48-year-old male volunteer shown in Fig. 7b. The contrast between gray matter (GM) and white matter (WM) is good in the images, due to the T2 weighting and MT effects (see below). Also visible in the image in Fig. 7b is the tail of the caudate nucleus (white arrows). Figure 7c (same volunteer as in Fig. 7b) shows a slice at the level of the basal ganglia, a potential area of interest for the study of neurodegenerative diseases such as Parkinson’s or Huntington’s disease. In the slice shown, the medial medullary laminae, separating the internal from the external segment of the globus pallidus, are discernible (white arrow). The visualization of such structures is uncommon with conventional clinical T2-weighted images. Finally, Fig. 7d shows a coronal slice from a 34-year-old female volunteer acquired with slightly different parameters from the transverse slices (FOV = 200 × 200 mm, spatial resolution = 391 μm × 521 μm × 2 mm, TEeff = 44 ms). This image allows identification of the different layers of the hippocampus, as indicated (i.e., the alveus, cornu ammonis, and gyrus dentatus), and, in common with the images in Fig. 7a-c, easy discrimination of blood vessels (which are bright in the reverse contrast images because flow effects cause the intravascular signal to be very small).
FIG. 7.
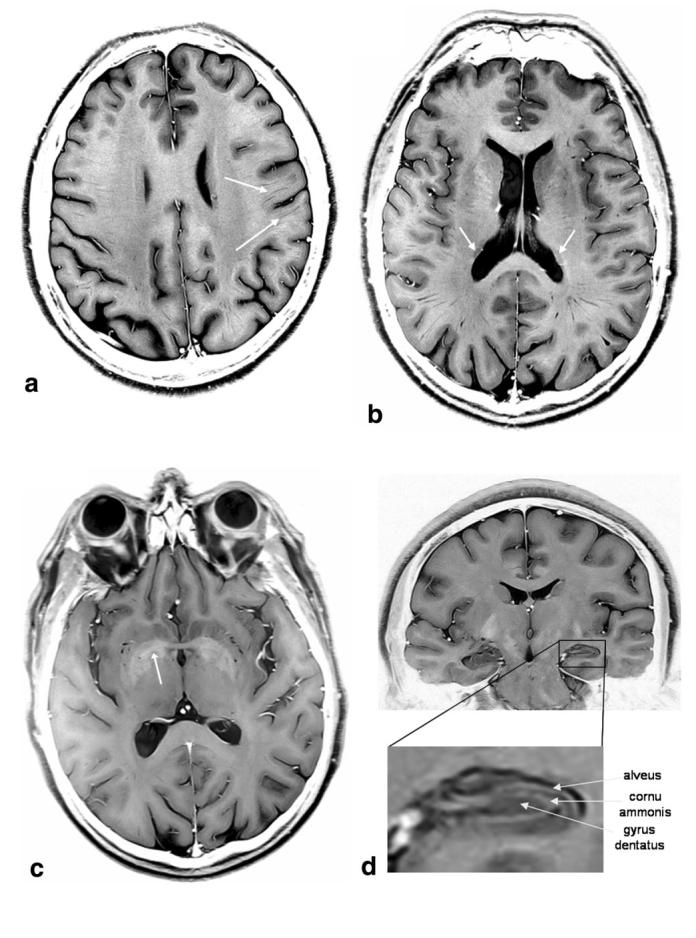
FSE images of a human brain at 4.7 T, presented with inverted grayscale. a: Transverse slice of a 34-year-old female volunteer. The white arrows indicate some of the Virchow-Robin spaces. b: Transverse slice of a 48-year-old male volunteer. The white arrows indicate the tail of the caudate nucleus. c: Transverse slice of the same volunteer as in b. The white arrow indicates the right medial medullary lamina, which separates the internal from the external segment of the globus pallidus. d: Coronal slice of the same volunteer as in a, with an enlarged section showing the detail of the different layers within the left hippocampus (alveus, cornu ammonis, and gyrus dentatus).
Effect of TE on SNR and Contrast
Figure 8 shows the same transverse slice from FSE data sets acquired from a 29-year-old male volunteer with different TEeff values. Figure 8a-c shows images acquired with TEeff = 22, 44, and 66 ms, respectively, normalized to the same grayscale for direct comparison of signal intensity. As expected, the signal amplitude decreases with increasing TEeff as the T2 weighting increases and the SNR correspondingly decreases. Figure 8d-f shows the same images with the grayscale level set independently for each image to give approximately the same overall signal intensity and thus allow differences in contrast between the images to be assessed. It can be seen that although the contribution of CSF becomes increasingly noticeable at longer TEeff values due to its long T2, the GM-WM contrast does not appear to vary substantially for the different TEeff values. In fact, an analysis based on regions of interest (ROIs) drawn in various GM and deep GM/WM areas showed that the average contrast-to-noise ratio (CNR, defined as the difference in SNR between regions) of GM and WM was 17.2, 15.4, and 11.8 for TEeff = 22, 44, and 66 ms, respectively, while the average CNR of deep GM and WM varied as 10.9, 9.9, and 6.0 over the three TEs. The main reason for the increased CNR at short TEs is the higher overall SNR of these images (the ROI analysis showed that the mean SNR of the brain images varied in the ratio 2:1 for TEeff = 22 ms compared to 66 ms, and 1.6:1 for TEeff = 44 ms compared to 66 ms), so that although the fractional signal difference between the different tissue types increased with TE, the reduction in SNR at longer TEeff caused the CNR values of these images to be lower than that of the short TEeff images. We attribute this behavior of contrast with TEeff to the fact that the contrast is related to a range of factors, such as T1 and MT, as well as T2. In future work, we will attempt to address the precise contributions of each of these variables to the resultant image contrast. However, such a study is outside the scope of the present work, and therefore, based on these empirical results, a TE of 22 ms was chosen for the majority of our FSE acquisitions.
FIG. 8.
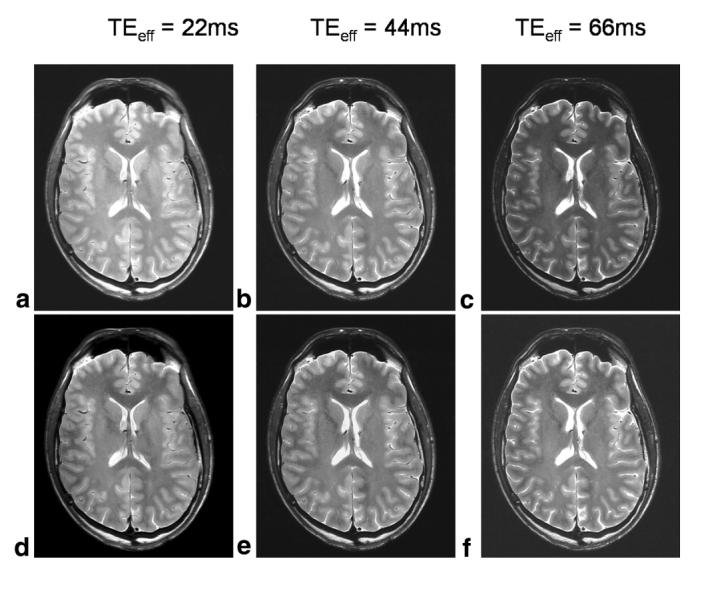
FSE images acquired with different TEeff values (22 ms (a and d), 44 ms (b and e), and 66 ms (c and f)), displayed with the same grayscale to allow comparison of relative signal amplitude (a-c), and individually scaled to give approximately the same overall signal intensity and allow assessment of differences in contrast (d-f). The image signal intensity decreases with TE, but the GM-WM contrast remains approximately constant throughout.
Effect of the Slice Acquisition Order on SNR and Contrast
The dependence of magnetization transfer contrast (MTC) on the slice acquisition order is demonstrated in Fig. 9. The graph in Fig. 9a shows the percentage difference in signal intensity for an ROI in each slice when acquired in the slice orders 1-17 and 17-1 for a 29-year-old male volunteer. A large negative difference exists for the lower slices, and a large positive difference exists for the higher slices, indicating that the signal intensity is significantly higher at whichever end is sampled first. The central slices are unaffected by slice order, since they are always acquired after approximately the same number of previous slices. Figure 9b shows how the appearance of image slice 1 changes depending on whether it is acquired first or last (the signal intensity scaling is the same for both images). The attenuation of signal is greater in the WM, consistent with the effect being MTC created by the application of RF pulses to adjacent slices immediately prior to acquisition.
FIG. 9.
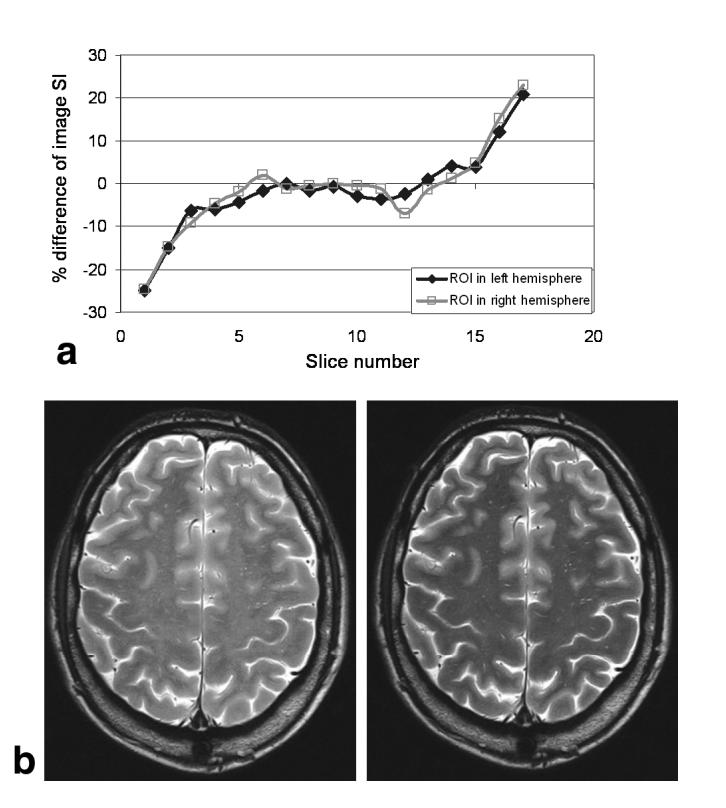
MT effects in FSE. a: Plot of the ROI percentage signal difference between slices when acquired with opposite order (i.e., slice 1-17 compared to slice 17-1). The difference arises from the fact that slices acquired early have less MT weighting than those acquired late; hence, the outermost slices display the largest difference for the two acquisitions. b: The difference between slice 1 when acquired as the first (left) and last (right) slice. The position of the slice in the acquisition protocol has a distinct effect on both signal intensity and contrast, since MTC attenuates WM more than GM.
Effect of Active Power Modulation
An example of the B1-weighted sagittal pilot scan needed for the implementation of active power modulation along the axial (z) direction is shown in Fig. 10. In this image, the dark and light bands represent iso-B1 contour lines, and the region indicated by the white arrow is the B1 hotspot. In this example, an offset of 24 mm was measured based on this image and used to calculate the required pulse powers for a multislice image data set subsequently acquired with axial orientation. From the B1 maps (e.g., see Fig. 4), the average parabolic coefficient of the B1(z) profile (az) was measured to be -11 × 10-5 mm-2. Figure 11a and b show a coronal view of the images without (a) and with (b) active power modulation (N.B., the image resolution in the axial direction was low (8 mm) so that rapid whole-brain coverage could be achieved). The drop-off of signal intensity in the most inferior and superior regions of the head is apparent in Fig. 11a, and is at least partially compensated for by the active power modulation, shown in Fig. 11b. In the uppermost slices, increases in signal intensity of up to 80% were observed with the introduction of active power modulation. The axial images shown in Fig. 11c and d demonstrate that the B1 reduction causes a large loss in SNR and image quality when it is not accounted for, but this is improved when power modulation is employed. It should also be noted that the reduction in the receive sensitivity of the RF coil (which, according to the reciprocity principle, varies in the same way as the transmit efficiency (21)) has not been corrected for in these images.
FIG. 10.
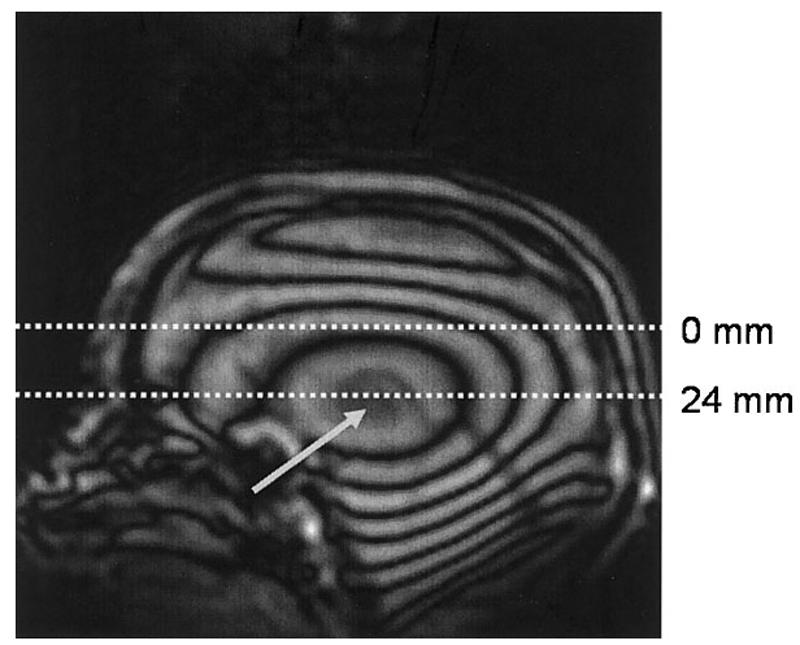
Sagittal B1 contour image, used to locate the B1 hotspot in the axial direction (grey arrow), to calculate the offset needed for the implementation of active power modulation and the calibration of the RF pulses. The bright and dark bands represent iso-B1 contour lines, with a difference of approximately 30 Hz between bright and dark.
FIG. 11.
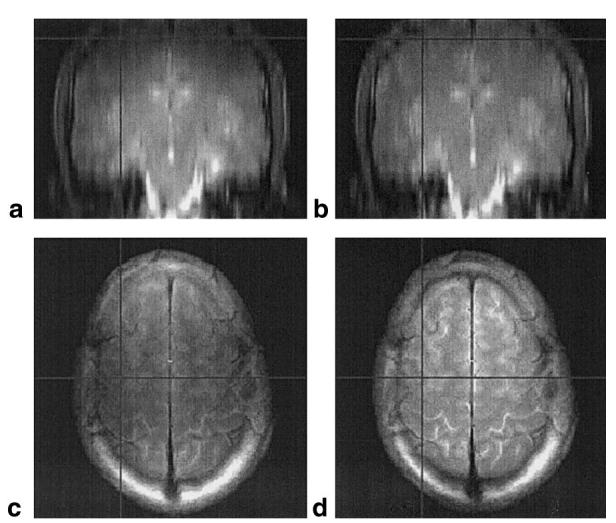
Comparison of FSE images without (a and c) and with (b and d) active power modulation. The images were acquired as axial slices, with the RF pulse power modulated according to the position of the slice relative to the B1 hotspot. a and b: The images resampled to a coronal orientation, to allow visualization of the extent of B1 compensation along the axial (top-bottom) direction. The images appear more uniform with power modulation (b) than without (a). This can also be seen by examining the most superior and inferior slices of the data set in the original orientation (e.g., d compared to c). The horizontal and vertical lines on the images show the relative position of the displayed views.
DISCUSSION
We have demonstrated that FSE imaging can be used at 4.7 T to produce high-resolution images of the human brain with good SNR and tissue contrast within a reasonable scan time. Appropriate selection of the FSE sequence parameters is essential to ensure optimal sequence performance, since a range of factors combine to produce the resulting image signal intensity and contrast.
FSE images are traditionally considered to be mainly proton density- or T2-weighted, depending on the chosen TEeff. At clinical field strengths, this is true to a certain extent, though it is well known that other factors play an important role in determining image contrast (14). At higher field strengths, the importance of some of these factors appears to become greater. We observed a decrease of image CNR with increasing TEeff using the FSE sequence at 4.7 T (i.e., an effect opposite to that expected for purely T2-weighted contrast). This led us to identify the importance of MTC in the images. As such, there are several variables that can be manipulated to alter the degree of MTC, such as the direction of slice acquisition (as demonstrated in Fig. 9), the slice separation (whether adjacent slices are acquired or a gap between slices is used, which determines the frequency offset between successive slices), and the slice acquisition order (whether slices are acquired sequentially as 123456 . . ., or in an interleaved manner, such as 135 . . .246 . . .). If images are acquired sequentially, MTC effects are maximal but overlap of the slice edges also occurs (i.e., direct saturation), which reduces the SNR and CNR of the images considerably. In the images presented in this work, we used the interleaved approach to avoid slice overlap while maintaining a significant MT effect. It can be seen that by changing TEeff and the slice acquisition protocol, T2 and MT weighting can be controlled to some degree to achieve the desired image contrast. Additionally, specific RF pulses can be added to increase MT effects independently of the sequence acquisition protocol, or inversion pulses can be incorporated into the sequence to introduce T1 weighting (5,22). It is important to note that the pulse sequence parameters used to produce the images presented here were chosen to optimize image quality and contrast in the normal human brain. The optimum parameters for maximizing the visibility of brain pathology in conditions where T2 weighting is traditionally used at lower field strengths have yet to be determined; however, preliminary studies on patients with multiple sclerosis and lacunar stroke infarcts indicate that good contrast is achieved with the parameters used in this work.
A novel PE approach (known as “feathering”) is introduced in this study. This approach reduces artifacts caused by the discontinuous changes of signal intensity in k-space, which are inherent to standard methods of echo ordering in FSE imaging. The feathering approach requires the use of 2× oversampling in the PE direction, and consequently the minimum image acquisition time of the sequence is doubled compared to a standard FSE sequence. However, the SNR benefits of oversampling are equivalent to signal averaging (i.e., 2× oversampling results in a √2 increase in SNR). Therefore, when feathering is used, the level of image artifact is reduced compared to standard FSE, and the image SNR is the same as a standard FSE acquired with two signal averages (or a single average oversampled by a factor of 2).
Image nonuniformity is an anticipated problem for high-field MRI, as a result of the increased B1 inhomogeneity with respect to lower field strengths. We have demonstrated that for FSE, this issue can be addressed in a number of ways. First, the sequence has an innate tolerance for B1 inhomogeneity as long as the stimulated-echo coherence pathways are made to interfere constructively with the SE pathways. Thus, the loss of SE signal caused by non-180° refocusing pulses is partially compensated for by the increased amplitude of the stimulated echoes. This may also explain the lack of obvious blurring in the images, despite the combination of a long FSE echo train (8 × 22 = 176 ms) and the fact that the outermost sections of k-space are encoded by the last echo. Based on consideration of tissue T2 alone, one would expect a significant reduction of the signal amplitude, which would cause degradation of the pixel PSF. This effect is not apparent (see Fig. 7). In addition, if slices are acquired perpendicular to the axis of greatest B1 inhomogeneity (the z-axis), transmit power modulation can be used to actively compensate for the known decrease in transmitter efficiency. RF power constraints determine the practical limits of this approach. As a complement to this, image postprocessing can be performed to account for the variation in receive sensitivity caused by B1 inhomogeneity (15). Although none of the signal intensities of the current images were “flattened” in this way, they still display remarkably uniform SNR and CNR for the majority of the brain coverage. In the future, the use of complex multidimensional excitation pulses (23,24) may allow more complete correction of the remaining in-plane B1 nonuniformities.
Due to the high inherent SNR, high spatial resolution, and good contrast, the anatomical detail apparent in the brain images presented here (e.g., see Fig. 7) is far greater than that seen on standard clinical FSE brain images. Certain structures, such as the tail of the caudate nucleus and the layers of the hippocampus, are much more easily visible and identifiable at 4.7 T than at 1.5 T. The sensitivity and SNR of the images could be further enhanced by the use of surface coils, as has been done at 3 T (25), at the expense of decreased image uniformity. Alternatively, array coils could be used to improve SNR and maintain good receive homogeneity. It is apparent that the wealth of information available to the observer will be useful for more accurate determinations of cerebral anatomy, and could have a direct impact on neurosurgical planning. However, it is worth pointing out that caution is needed when such images are viewed and interpreted, precisely because so many more anatomical features are apparent. For example, the prevalence of Virchow-Robin spaces in the young and healthy brain, as seen in Fig. 7, differs from what is observed in an equivalent image taken at 1.5 T, where the Virchow-Robin spaces are generally seen only in older and/or atrophic brains. For this reason, MR scientists and neuroradiologists will need to familiarize themselves fully with the contrast and detail available from high-field images, and in doing so redefine what is classed as “normal,” before they use such images for diagnostic purposes.
Previous approaches to structural imaging at high field have generally employed magnetization-prepared, low-flip-angle sequences (25-28). These sequences produce T1-weighted images with good GM-WM contrast, and have the advantage of lower SAR. However, due to the low-flip-angle excitation pulses employed, and the large acquisition bandwidths used to minimize TEs and TRs, the SNR of these images is limited. At high field, the T1 of both GM and WM is longer than at lower fields (29), which means that good T1 contrast is more difficult to achieve in reasonable scan times without sacrificing SNR. We suggest that FSE provides a feasible and practical alternative for high-field structural imaging, and produces high-resolution images with good SNR in reasonable scan times. The SAR of the FSE sequence described here was calculated to be less than the MDA safety guideline of 4 W/kg over the whole head (8), and previous simulations have shown that when a four-port drive birdcage coil at 4.7 T is used, the guideline of 10 W/kg for any 100 g of tissue is also unlikely to be exceeded (30). In addition, modifications to the FSE technique have recently been proposed that greatly reduce the SAR of the sequence, with only modest SNR losses (31-33). Initial results obtained with these methods at high field are very promising (34,35) and will allow further optimization of the efficiency of the FSE sequence to increase spatial coverage and decrease scan time.
CONCLUSIONS
With appropriate optimization of sequence parameters, the FSE technique can be used at 4.7 T to produce high-quality T2/MT-weighted images of the human brain within current safety guidelines and conventional examination times, despite increased B1 inhomogeneity. The resolution achievable at high field allows better visualization of anatomical details in the normal brain, and should allow more accurate assessments of the spatial extent of tissue damage in the pathological brain. This may be useful for more effective diagnoses and neurosurgical planning, and give us a deeper understanding of normal human brain anatomy.
Footnotes
Grant sponsor: Wellcome Trust.
REFERENCES
- 1.Chen C-N, Sank VJ, Cohen SM, Hoult DI. The field dependence of NMR imaging. I. Laboratory assessment of signal-to-noise ratio and power deposition. Magn Reson Med. 1986;3:722–729. doi: 10.1002/mrm.1910030508. [DOI] [PubMed] [Google Scholar]
- 2.Kennan RP, Zhong J, Gore JC. Intravascular susceptibility contrast mechanisms in tissues. Magn Reson Med. 1994;31:9–21. doi: 10.1002/mrm.1910310103. [DOI] [PubMed] [Google Scholar]
- 3.Hoult DI. Sensitivity and power deposition in a high-field imaging experiment. J Magn Reson Imaging. 2000;12:46–67. doi: 10.1002/1522-2586(200007)12:1<46::aid-jmri6>3.0.co;2-d. [DOI] [PubMed] [Google Scholar]
- 4.Hennig J, Nauerth A, Friedburg H. RARE imaging: a fast imaging method for clinical MR. Magn Reson Med. 1986;3:823–833. doi: 10.1002/mrm.1910030602. [DOI] [PubMed] [Google Scholar]
- 5.Mulkern RV, Wong STS, Winalski C, Jolesz FA. Contrast manipulation and artifact assessment of 2D and 3D RARE sequences. Magn Reson Imaging. 1990;8:557–566. doi: 10.1016/0730-725x(90)90132-l. [DOI] [PubMed] [Google Scholar]
- 6.De Vita E, Thomas DL, Roberts S, Parkes HG, Turner R, Kinchesh P, Shmueli K, Yousry TA, Ordidge RJ. High resolution MRI of the brain at 4.7 Tesla using fast spin echo imaging. Br J Radiol. 2003;76:631–637. doi: 10.1259/bjr/69317841. [DOI] [PubMed] [Google Scholar]
- 7.Bridges JF, inventor. Cavity resonator with improved magnetic field uniformity for high frequency operation and reduced dielectric heating in NMR imaging devices. 4751464. U.S. patent. 1988
- 8.Medical Devices Agency. Guidelines for magnetic resonance equipment in clinical use. United Kingdom Department of Health; MDA: 2002. [Google Scholar]
- 9.Melki PS, Mulkern RV. Magnetization transfer effects in multislice RARE sequences. Magn Reson Med. 1992;24:189–195. doi: 10.1002/mrm.1910240122. [DOI] [PubMed] [Google Scholar]
- 10.Rydberg JN, Hammond CA, Grimm RC, Erickson BJ, Jack CR, Huston J, Riederer SJ. Initial clinical experience in MR imaging of the brain with a fast fluid attenuated inversion-recovery pulse sequence. Radiology. 1994;193:173–180. doi: 10.1148/radiology.193.1.8090888. [DOI] [PubMed] [Google Scholar]
- 11.Keller PJ, Heiserman JE, Fram EK, Rand SD, Drayer BP. A Nyquist modulated echo-to-view mapping scheme for fast spin-echo imaging. Magn Reson Med. 1995;33:838–842. doi: 10.1002/mrm.1910330615. [DOI] [PubMed] [Google Scholar]
- 12.Alecci M, Collins CM, Smith MB, Jezzard P. Radio frequency magnetic field mapping of a 3 Tesla birdcage coil: experimental and theoretical dependence on sample properties. Magn Reson Med. 2001;46:379–385. doi: 10.1002/mrm.1201. [DOI] [PubMed] [Google Scholar]
- 13.Hennig J. Echoes—how to generate, recognize, use or avoid them in MR-imaging sequences. Part I: Fundamental and not so fundamental properties of spin echoes. Concepts Magn Reson. 1991;3:125–143. [Google Scholar]
- 14.Constable RT, Anderson AW, Zhong J, Gore JC. Factors influencing contrast in fast spin-echo MR imaging. Magn Reson Imaging. 1992;10:497–511. doi: 10.1016/0730-725x(92)90001-g. [DOI] [PubMed] [Google Scholar]
- 15.Clare S, Alecci M, Jezzard P. Compensating for B1 inhomogeneity using active transmit power modulation. Magn Reson Imaging. 2001;19:1349–1352. doi: 10.1016/s0730-725x(01)00467-2. [DOI] [PubMed] [Google Scholar]
- 16.Deichmann R, Good CD, Josephs O, Ashburner J, Turner R. Optimization of 3D MP-RAGE sequences for structural brain imaging. Neuroimage. 2000;12:112–127. doi: 10.1006/nimg.2000.0601. [DOI] [PubMed] [Google Scholar]
- 17.SharpView Image Filter. 2003. www.contextvision.com.
- 18.Vaughan JT, Garwood M, Collins CM, Liu W, DelaBarre L, Adriany G, Andersen P, Merkle H, Goebel R, Smith MB. Ugurbil K. 7T vs 4T: RF power, homogeneity, and signal-to-noise comparison in head images. Magn Reson Med. 2001;46:24–30. doi: 10.1002/mrm.1156. [DOI] [PubMed] [Google Scholar]
- 19.Barfuss H, Fischer H, Hentschel D, Ladebeck R, Oppelt A, Wittig R, Duerr W, Oppelt R. In vivo magnetic resonance imaging and spectroscopy of humans with a 4T whole-body magnet. NMR Biomed. 1990;3:31–45. doi: 10.1002/nbm.1940030106. [DOI] [PubMed] [Google Scholar]
- 20.van der Meulen P, van Yperen GH. A novel method for rapid pulse angle optimization.; Proceedings of the 5th Annual Meeting of SMRM; Montreal, Canada. 1986. p. 1129. [Google Scholar]
- 21.Hoult DI, Richards RE. The signal-to-noise ratio of the nuclear magnetic resonance experiment. J Magn Reson. 1976;24:71–85. doi: 10.1016/j.jmr.2011.09.018. [DOI] [PubMed] [Google Scholar]
- 22.Constable RT, Smith RC, Gore JC. Signal-to-noise and contrast in fast spin echo (FSE) and inversion recovery FSE imaging. J Comput Assist Tomogr. 1992;16:41–47. doi: 10.1097/00004728-199201000-00008. [DOI] [PubMed] [Google Scholar]
- 23.Panych LP, Oshio K. Selection of high-definition 2D virtual profiles with multiple RF pulse excitations along interleaved echo-planar k-space trajectories. Magn Reson Med. 1999;41:224–229. doi: 10.1002/(sici)1522-2594(199902)41:2<224::aid-mrm2>3.0.co;2-g. [DOI] [PubMed] [Google Scholar]
- 24.Deichmann R, Good CD, Turner R. RF inhomogeneity compensation in structural brain imaging. Magn Reson Med. 2002;47:398–402. doi: 10.1002/mrm.10050. [DOI] [PubMed] [Google Scholar]
- 25.Clare S, Jezzard P, Matthews PM. Identification of the myelinated layers in striate cortex on high resolution MRI at 3 Tesla; Proceedings of the 10th Annual Meeting of ISMRM; Honolulu. 2002. p. 1465. [Google Scholar]
- 26.Lee J-H, Garwood M, Menon R, Adriany G, Andersen P, Truwit CL, Ugurbil K. High contrast and fast three-dimensional magnetic resonance imaging at high fields. Magn Reson Med. 1995;34:308–312. doi: 10.1002/mrm.1910340305. [DOI] [PubMed] [Google Scholar]
- 27.Pan JW, Vaughan JT, Kuzniecky RI, Pohost GM, Hetherington HP. High resolution neuroimaging at 4.1T. Magn Reson Imaging. 1995;13:915–921. doi: 10.1016/0730-725x(95)02002-b. [DOI] [PubMed] [Google Scholar]
- 28.Norris DG, Kangarlu A, Schwarzbauer C, Abduljalil AM, Christoforidis G, Robitaille P-ML. MDEFT imaging of the human brain at 8T. MAGMA. 1999;9:92–96. doi: 10.1007/BF02634598. [DOI] [PubMed] [Google Scholar]
- 29.Jezzard P, Duewell S, Balaban RS. MR relaxation times in human brain: measurement at 4T. Radiology. 1996;199:773–779. doi: 10.1148/radiology.199.3.8638004. [DOI] [PubMed] [Google Scholar]
- 30.Ibrahim TS, Lee R, Baertlein BA, Kangarlu A, Robitaille P-ML. Application of finite difference time domain method for the design of birdcage RF head coils using multi-port excitations. Magn Reson Imaging. 2000;18:733–742. doi: 10.1016/s0730-725x(00)00143-0. [DOI] [PubMed] [Google Scholar]
- 31.Hennig J, Scheffler K. Easy improvement of signal-to-noise in RARE-sequences with low refocusing flip angles. Magn Reson Med. 2000;44:983–985. doi: 10.1002/1522-2594(200012)44:6<983::aid-mrm23>3.0.co;2-8. [DOI] [PubMed] [Google Scholar]
- 32.Hennig J, Scheffler K. Hyperechoes. Magn Reson Med. 2001;46:6–12. doi: 10.1002/mrm.1153. [DOI] [PubMed] [Google Scholar]
- 33.Hennig J, Weigel M, Scheffler K. Multiecho sequences with variable refocusing flip angles: optimization of signal behavior using smooth transitions between pseudo steady state (TRAPS) Magn Reson Med. 2003;49:527–535. doi: 10.1002/mrm.10391. [DOI] [PubMed] [Google Scholar]
- 34.Ernst T, Zhong K, Tomasi D, Hennig J. Fast T2-weighted MRI at 4 tesla using a TRAPS sequence.; Proceedings of the 11th Annual Meeting of ISMRM; Toronto, Canada. 2003. p. 957. [Google Scholar]
- 35.Hennig J. Calculation of refocusing flip angles for CPMG-echo trains with a given amplitude envelope: basic principles and applications to hyperecho TSE.; Proceedings of the 11th Annual Meeting of ISMRM; Toronto, Canada. 2003. p. 201. [Google Scholar]


