

Abstract
Introduction
The purpose of this study was to describe the prevalence of obesity among American Indian and Alaska Native (AI/AN) adults with diabetes and to examine the temporal trends for class I, II, and III obesity in this high-risk group during a 10-year period.
Methods
We used data on body mass index (BMI) from the annual Diabetes Care and Outcomes Audit to estimate the prevalence of class I, II, and III obesity (class I = 30.0–34.9 kg/m2, class II = 35.0–39.9 kg/m2, and class III ≥40.0 kg/m2) in each year from 1995 through 2004. We also investigated trends in mean BMI during the 10-year period and the role of treatment in these trends using multivariable linear regression models.
Results
Obesity was highly prevalent in this population in 2004 (class I, 28.9%; class II, 20.4%; class III, 20.3%). From 1995 through 2004, the percentage of obese adults increased from 16.7% to 20.4% in class II and 11.5% to 20.3% in class III (P <.001), and the mean BMI increased from 32.1 kg/m2 to 34.4 kg/m2. The increase in BMI was greater in the younger age groups. Adjusted mean BMI increased significantly over 10 years for each of three treatment categories.
Conclusion
Extreme degrees of obesity are a common and increasing problem among AI/AN adults with diabetes. We did not find an association between the type of diabetes treatment and the trend toward extreme degrees of obesity. The increase in extreme obesity could potentially affect the burden of morbidity and mortality among AI/AN adults with diabetes. Effective and culturally appropriate weight management interventions are needed.
Introduction
Obese individuals are at particularly high risk for cardiovascular disease (CVD) and are also at increased risk for other serious medical conditions, including hypertension, certain forms of cancer, arthritis, sleep and breathing disorders, and gallbladder disease (1,2). Thus, obesity is an important risk factor for adverse health outcomes and a marker of increased health care cost. Evidence suggests that obesity can be treated (3-5). Short-term weight loss has been demonstrated to ameliorate obesity-related metabolic abnormalities and CVD risk factors (6), and at least one prospective randomized study is underway to examine the long-term consequences of intentional weight loss in overweight or obese people with diabetes (7). Although obesity is a major public health issue that will continue to require public health approaches aimed at preventing it, our knowledge and ability to apply patient-directed interventions is increasing and holds promise for people now affected.
The current epidemic of type 2 diabetes in the United States is largely a consequence of the epidemic of obesity, and weight reduction remains a cornerstone of therapy for people with diabetes (8,9). The Indian Health Service (IHS), a federally operated health care system, provides care to more than 1.5 million American Indian and Alaska Native (AI/AN) people, of whom more than 100,000 have diabetes (10). The extent and severity of obesity among AI/AN people with diabetes, however, has not been examined. Understanding the magnitude of the coexistence of these conditions could improve our ability to plan for medical services and estimate health care expenditures for this population at high risk for poor health.
The IHS conducts an annual system-wide assessment of services for and outcomes of AI/AN people with diabetes receiving services within the Indian health care system. Using this data source, we were able to describe the burden of obesity and the temporal trends in obesity among adults during a 10-year period.
Methods
Data source
We conducted a cross-sectional study using data collected annually during 10 years at health care facilities that collectively form a federally funded health care system for AI/AN people. The facilities include federally operated IHS hospitals, ambulatory clinics, health stations, and clinics from all 12 administrative IHS areas as well as facilities operated directly by tribal governments through contracts or compacts with the IHS. The system also includes American Indian organizations that provide services to AI/AN people residing in 34 urban metropolitan areas.
The Diabetes Care and Outcomes Audit (DCOA) is conducted annually by the IHS (11,12). The DCOA is performed at the facility level and is used for local feedback and performance improvement activities. At each participating facility, a systematic sample of medical records is selected from all patients with diabetes (13). A local diabetes coordinator abstracts information from the selected records using a standardized form covering more than 70 demographic and quality-of-care indicators. In some facilities, the DCOA is created using a computer application developed by the IHS that collects data from the facility's health information system.
Voluntary, nonpunitive reporting of local audit results to the IHS Division of Diabetes Treatment and Prevention provides an opportunity for aggregation of diabetes care and outcomes measures into a national data set. Participation in national reporting among the approximately 300 facilities in the IHS system is high. During the period of this study, the number of facilities submitting data ranged from a low of 145 in 1996 to a high of 281 in 2004. The number of patients in the annual reports ranged from a low of 9557 in 1995 to a high of 33,769 in 2004. The increase in the sample size reflects several temporal trends in the audit process. An increased number of facilities participated in the audit, and an increase in the prevalence of diabetes resulted in a greater number of patients sampled at each facility. Also, the use of electronic auditing techniques appears to have increased the proportion of records audited at many of the facilities using electronic auditing. However, the criteria used for inclusion in the DCOA and the criteria for data collection in the audit did not change during the study period, and there was good comparability between manual and electronic record review for programs using electronic data auditing.
Of the potential records of patients aged 18 years and older who were included in the DCOA from 1995 through 2004, 156,080 records had information necessary to calculate body mass index (BMI). Of these records, 70 had an implausible BMI (<15.0 kg/m2) and were excluded from the analyses, leaving 156,010 records. Of these, 17,674 records were missing data on duration of diabetes and treatment type and were excluded from the analyses. A total of 138,336 records (88.6% of all records) were used for analysis.
Outcome variable
BMI was calculated from recorded height and weight. Obesity was categorized by grouping BMI values in the following categories: normal weight (<25.0 kg/m2), overweight (25.0–29.9 kg/m2), class I obesity (30.0–34.9 kg/m2), class II obesity (35.0–39.9 kg/m2), and class III obesity (≥40.0 kg/m2) (14).
Covariates
Demographic and clinical variables collected through the DCOA included sex, age, duration of diabetes, treatment type, and treatment facility. Age was calculated as the date of audit minus the date of birth. Duration of diabetes was recorded in years since diagnosis. Treatment type was recorded as diet or exercise alone (no medication), oral agent(s), insulin, and oral agent plus insulin (combined with the insulin group for purposes of analyses). Treatment facility was recorded as the location where patients obtained treatment and audit data was collected.
Data analyses
We conducted a descriptive analysis of BMI by demographic and clinical variables and by calendar year for all people with measured heights and weights and calculated BMI ≥15 kg/m2. We used analysis of covariance techniques to estimate least square mean BMI values and to test the hypotheses that BMI differed by age and calendar period. The analyses were adjusted for age, sex, duration of diabetes, treatment type, and treatment facility. Tests for temporal trends in obesity categories were conducted using logistic regression techniques and were adjusted for age, sex, duration of diabetes, treatment type, and treatment facility. All statistical analyses were conducted using SAS software (SAS Institute Inc, Cary, NC) (15).
Results
We found that obesity was a common and increasingly prevalent problem among people with type 2 diabetes. In 1995, 59.2% of adults with diabetes were obese. By 2004, 69.6% of adults with diabetes were obese. Table 1 summarizes selected demographic and clinical measures of AI/AN adults with diabetes. Consistent with sex differences in the prevalence of diabetes in AI/AN adults, more women than men were included in the sample (16). Most patients used oral agents either alone or in combination with other oral agents. The average age at onset did not differ during the study period. The unadjusted mean BMI increased significantly from 32.1 in 1995 to 34.4 in 2004 (P < .001) (Table 1). Adjustment for age, sex, duration of diabetes, treatment type, and treatment facility did not significantly change this trend.
Table 1.
Selected Demographic and Clinical Variables From Representative Years of the Diabetes Care and Outcomes Audit Among American Indian and Alaska Native Adults With Type 2 Diabetes, Indian Health Service, 1995–2004
| Variable | 1995 (N = 7106) | 1999 (N = 10,651) | 2004 (N = 28,508) |
|---|---|---|---|
| Sex, no. (%) | |||
| Male | 2780 (39.1) | 4243 (39.8) | 12,099 (42.4) |
| Female | 4326 (60.9) | 6408 (60.2) | 16,409 (57.6) |
| Treatment type, no. (%) | |||
| Diet or exercise alone | 1009 (14.2) | 1292 (12.1) | 5,476 (19.2) |
| Oral agent(s) | 3397 (47.8) | 6212 (58.3) | 15,894 (55.8) |
| Insulin | 2700 (38.0) | 3147 (29.5) | 6,846 (24.0) |
| Unknown or missing | 0 | 0 | 292 (1.0) |
| Age at audit, y, mean (SD) | 55.6 (13.4) | 55.2 (13.6) | 54.9 (13.8) |
| Duration of disease, y, mean (SD) | 9.2 (7.6) | 8.7 (7.5) | 8.3 (7.3) |
| Age at onset, y | 46.4 (13.2) | 46.5 (13.2) | 46.6 (13.4) |
| Body mass index, unadjusted mean (SD) | 32.1 (6.7) | 33.0 (7.0) | 34.4 (7.8) |
| Body mass index, adjusteda mean (SD) | 32.1 (0.1) | 33.0 (0.1) | 34.4 (0.1) |
| Men | 31.3 (0.1) | 32.1 (0.1) | 33.7 (0.1) |
| Women | 32.6 (0.1) | 33.7 (0.1) | 34.9 (0.1) |
Adjusted for age, sex, duration of diabetes, treatment type, and treatment facility.
The prevalence of class II and class III obesity was higher in women than men in each year of the study (Table 2). The prevalence of class II and class III obesity increased from 1995 to 2004 (P < .001) in both men and women; however, the prevalence of class II and class III obesity increased significantly more for men than women, thus narrowing the sex difference. These trends were consistently observed among 11 of 12 IHS administrative areas.
Table 2.
Trends in Class of Body Mass Index by Sex Among American Indian and Alaska Native Adults With Type 2 Diabetes, Diabetes Care and Outcomes Audit, Indian Health Service, 1995–2004
| Body Mass Index | 1995 | 1996 | 1997 | 1998 | 1999 | 2000 | 2001 | 2002 | 2003 | 2004 | % Change |
|---|---|---|---|---|---|---|---|---|---|---|---|
| Class I (30.0-34.9kg/m2) | |||||||||||
| All | 2193 (30.9) | 2261 (30.0) | 2290 (30.3) | 2814 (30.6) | 3228 (30.3) | 3234 (29.3) | 4631 (29.8) | 4905 (29.7) | 6954 (28.6) | 8232 (28.9) | −6.5 |
| Men | 896 (32.2) | 978 (32.7) | 964 (31.2) | 1201 (32.7) | 1356 (32.0) | 1407 (31.0) | 2032 (31.5) | 2186 (31.8) | 3184 (31.1) | 3766 (31.1) | −3.4 |
| Women | 1297 (30.0) | 1283 (28.3) | 1326 (29.7) | 1613 (29.2) | 1872 (29.2) | 1827 (28.1) | 2599 (28.7) | 2719 (28.2) | 3770 (26.9) | 4466 (27.2) | −9.3 |
| Class II (35.0-39.9kg/m2) | |||||||||||
| All | 1192 (16.7) | 1329 (17.6) | 1320 (17.5) | 1618 (17.6) | 1957 (18.4) | 2063 (18.7) | 2955 (19.0) | 3261 (19.8) | 4873 (20.1) | 5814 (20.4) | +22.2 |
| Men | 415 (14.9) | 473 (15.8) | 449 (14.5) | 582 (15.8) | 714 (16.8) | 791 (17.4) | 1189 (18.4) | 1293 (18.8) | 1938 (18.9) | 2369 (19.6) | +31.5 |
| Women | 777 (18.0) | 856 (18.9) | 871 (19.5) | 1036 (18.8) | 1243 (19.4) | 1272 (19.6) | 1766 (19.5) | 1968 (20.4) | 2935 (20.9) | 3445 (21.0) | +16.7 |
| Class III (≥40.0kg/m2) | |||||||||||
| All | 816 (11.5) | 929 (12.3) | 960 (12.7) | 1343 (14.6) | 1581 (14.9) | 1710 (15.5) | 2648 (17.1) | 2926 (17.7) | 4760 (19.6) | 5784 (20.3) | +76.5 |
| Men | 216 (7.7) | 285 (9.5) | 313 (10.1) | 422 (11.5) | 459 (10.8) | 547 (12.1) | 885 (13.7) | 984 (14.3) | 1603 (15.6) | 2044 (15.6) | +102.6 |
| Women | 600 (13.9) | 644 (14.2) | 647 (14.5) | 921 (16.7) | 1122 (17.5) | 1163 (17.9) | 1763 (19.4) | 1942 (20.2) | 3157 (22.5) | 3740 (22.8) | +64.0 |
All values are number (percentage) unless otherwise indicated.
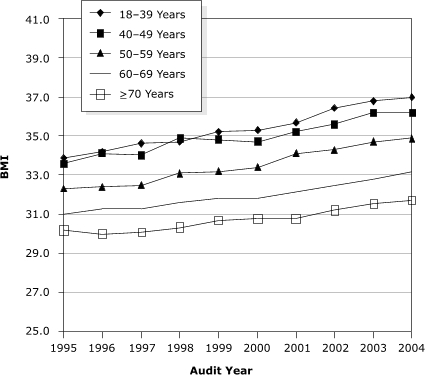
An increase in BMI was observed among all age groups from 1995 through 2004. The adjusted mean BMI was inversely related to age; the younger the age group, the higher the adjusted mean BMI (P = .04) (Figure). In 2004, for age category 18 to 39, the adjusted mean BMI was 37.0; for 40 to 49, 36.2; for 50 to 59, 34.9; for 60 to 69, 33.2; and for 70 years and older, 31.7. The increase in BMI during the study period was greater in the younger age groups (P < .001). Because the DCOA also contained information on diabetes treatment, we were able to investigate potential associations between obesity and type of treatment. Adjusted mean BMI increased significantly for each treatment category from 1995 through 2004 (Table 3).
Table 3.
Adjusteda Mean (SE) of Body Mass Index by Treatment Type Among American Indian and Alaska Native Adults With Diabetes, Diabetes Care and Outcomes Audit, Indian Health Service, 1995–2004
| Type of Treatment | 1995 | 1996 | 1997 | 1998 | 1999 | 2000 | 2001 | 2002 | 2003 | 2004 | P Valueb |
|---|---|---|---|---|---|---|---|---|---|---|---|
| Diet or exercise alone | 32.3 (0.22) | 32.5 (0.22) | 32.4 (0.21) | 33.1 (0.20) | 33.2 (0.20) | 33.0 (0.18) | 32.8 (0.15) | 33.4 (0.13) | 33.4 (0.11) | 33.8 (0.10) | <.001 |
| Oral agent(s) | 32.1 (0.11) | 32.3 (0.10) | 32.6 (0.10) | 32.9 (0.09) | 33.0 (0.08) | 33.1 (0.08) | 33.6 (0.07) | 33.9 (0.72) | 34.4 (0.06) | 34.6 (0.06) | <.001 |
| Insulin | 32.0 (0.14) | 31.8 (0.16) | 32.4 (0.15) | 32.9 (0.14) | 31.6 (0.13) | 33.2 (0.14) | 33.6 (0.12) | 33.8 (0.12) | 34.1 (0.11) | 34.1 (0.10) | <.001 |
Adjusted for age, sex, duration of diabetes, treatment type, and treatment facility.
P value determined by analysis of covariance.
Figure 1.
Adjusted mean body mass index (BMI [kg/m2]) by age among American Indian and Alaska Native adults with diabetes, Diabetes Care and Outcomes Audit, Indian Health Service, 1995–2004. Mean was adjusted for age, sex, duration of diabetes, treatment type, and treatment facility.
| Age, y | 1995 | 1996 | 1997 | 1998 | 1999 | 2000 | 2001 | 2002 | 2003 | 2004 |
|---|---|---|---|---|---|---|---|---|---|---|
| 18-39 | 33.9 | 34.2 | 34.6 | 34.7 | 35.2 | 35.3 | 35.7 | 36.4 | 36.8 | 37.0 |
| 40-49 | 33.6 | 34.1 | 34.0 | 34.9 | 34.8 | 34.7 | 35.2 | 35.6 | 36.2 | 36.2 |
| 50-59 | 32.3 | 32.4 | 32.5 | 33.1 | 33.2 | 33.4 | 34.1 | 34.3 | 34.7 | 34.9 |
| 60-69 | 31.0 | 31.3 | 31.3 | 31.6 | 31.8 | 31.8 | 32.1 | 32.5 | 32.8 | 33.2 |
| ≥70 | 30.2 | 30.0 | 30.1 | 30.3 | 30.7 | 30.8 | 30.8 | 31.2 | 31.5 | 31.7 |
Additional analyses that included records with missing data did not substantially change the results (data not shown).
Discussion
We found that the prevalence of obesity, as measured by BMI, increased among AI/AN adults with diabetes during the study period. A greater increase in BMI was observed among adults in the younger age categories. We found a greater percentage increase in obesity among men relative to women. While the sex difference in the prevalence of obesity has decreased, women remained more obese than men in every year studied. Notably, the increase in obesity has resulted in a large increase in the proportion of people with the most extreme degree of obesity.
The trends in obesity observed in this study may have important clinical and public health implications. The combination of diabetes and high BMI has been associated with increased risk for the development of more severe degrees of hyperglycemia, hypertension, dyslipidemia, retinopathy, and progressive loss of renal function (17-19). The relationship between obesity and cardiovascular disease morbidity and mortality are complex and nonlinear; however, obesity in its most extreme degrees is associated with higher all-cause and possible coronary cardiovascular disease mortality (20,21). The increase in obesity among adults with diabetes in this study could have implications for the burden of morbidity and mortality among AI/AN people with diabetes.
Obesity has been increasing among U.S. adults. Analysis of Behavioral Risk Factor Surveillance System (BRFSS) data shows a trend of increasing prevalence of extreme obesity compared with other classes of obesity in the U.S. population (22). BRFFS data and American Indian oversamples have described similar trends among American Indian adults. Between 1999 and 2003, 1000 American Indian adults aged 18 years and older living on or near the seven reservations in Montana were interviewed each year using an adapted BRFSS survey. During this period, the prevalence of obesity increased from 34% to 39% (23). The Strong Heart Study, an epidemiological study of cardiovascular disease risk factors in four American Indian communities, also documented the high prevalence of obesity, particularly among participants in the younger age groups (24). The trends in obesity in our study are also consistent with trends in the prevalence of obesity and extreme obesity among people with diabetes. Among adults with diabetes in an epidemiologic study in Rochester, Minn, the proportion of obesity increased from 33% to 49%, and extreme obesity nearly doubled from 5% to 9% over approximately 20 years (21).
Because our study was cross-sectional, we cannot determine the cause or causes of our observations. It is possible that AI/AN adults with diabetes have become more obese during the study period just as U.S. adults have become more obese. Treatment of diabetes may limit weight loss, and some pharmacologic agents used to treat people with diabetes are associated with weight gain (25). In longitudinal studies among the Pima Indians of Arizona, pharmacologic treatment had a statistically significant limiting effect on weight loss in people after the onset of diabetes (26), and clinical trial data from the United Kingdom Prospective Diabetes Study showed the greatest increase in weight among people using insulin and certain pharmacologic agents (27). With more interest in using intensive therapies since publication of the findings of the United Kingdom Prospective Diabetes Study, which were released during the study period, changes in treatment practice toward improved glycemic control (10) could explain some of the observed trends. Such treatment changes, however, would not explain the increase in mean BMI found in patients who were not treated with such agents (Table 3). Alternatively, the observed increases in obesity could reflect unintentional changes in who was included in the DCOA or how the audit was conducted. For example, an unrecognized selection bias toward participants with greater BMIs or a bias toward collection of data from participants with higher BMIs over time could create a temporal trend. To examine this possibility, we analyzed the percentage of participants who were missing BMI data during the study period and did find that the percentage of participants with missing data decreased from 17.6% in 1995 to 4.5% in 2004. However, the inclusion and exclusion criteria remained the same during the study period and never included weight restrictions, so the decrease in the number of patients with missing BMI values likely reflects better medical record documentation and less likely reflects differences in data reporting or in participant selection. Confounding due to other cohort differences is also unlikely to explain the results because adjustment for age, sex, diabetes duration, treatment type, and treatment facility did not substantially change our observations. Furthermore, the large dataset and the large number of different auditors should limit the chance of a one-way systematic selection bias toward more obese patients for inclusion. Still, changes based on modifications of health care usage bias, diagnostic criteria, or case ascertainment of diabetes cannot be fully excluded. Longitudinal studies would be required to fully address these and other questions about the cause of our observations.
Health care programs can be tailored to meet the lifestyle, preferences, and resources of individuals with obesity. Options include dietary and physical activity interventions with behavioral modification strategies, antiobesity drugs, and, for certain individuals, surgical interventions (28). Public health approaches to weight management may also have a role, particularly if they are combined with interventions directed at individuals (29). By documenting increasing trends in obesity among people with type 2 diabetes, this study helps to focus both clinical and public health attention on a major health challenge facing health professionals serving not only American Indian and Alaska Native people but also Latino, African American, and other communities that are experiencing an increase in prevalence of obesity and type 2 diabetes (30). The challenge will be to better understand the physiologic, socioeconomic, and lifestyle factors influencing obesity in adults with type 2 diabetes and to design, develop, implement, and evaluate effective and culturally appropriate interventions to address the trends in obesity in these high-risk groups.
Acknowledgments
The authors acknowledge the area diabetes consultants, Dr Raymond Shields, and each of the programs and clinical facility staff whose work made this manuscript possible. The views expressed are those of the authors and do not necessarily reflect the views of the Indian Health Service.
Footnotes
The opinions expressed by authors contributing to this journal do not necessarily reflect the opinions of the U.S. Department of Health and Human Services, the Public Health Service, Centers for Disease Control and Prevention, or the authors' affiliated institutions. Use of trade names is for identification only and does not imply endorsement by any of the groups named above.
Suggested citation for this article: Wilson C, Gilliland S, Moore K, Acton K. The epidemic of extreme obesity among American Indian and Alaska Native adults with diabetes. Prev Chronic Dis [serial online] 2007 Jan [date cited]. Available from: URL: http://www.cdc.gov/pcd/issues/2007/jan/06_0025.htm
Contributor Information
Charlton Wilson, Indian Health Service, Phoenix Indian Medical Center; Email: charlton.wilson@ihs.gov, 4212 N 16th Street, Phoenix, AZ 85016, Phone: 602-263-1587.
Susan Gilliland, Statistical Consultation and Research Center, Department of Preventive Medicine, University of Southern California, Los Angeles, Calif.
Kelly Moore, Division of Diabetes Treatment and Prevention, Indian Health Service, Albuquerque, NM.
Kelly Acton, Division of Diabetes Treatment and Prevention, Indian Health Service, Albuquerque, NM.
References
- 1.National Heart, Lung, and Blood Institute. The practical guide: identification, evaluation, and treatment of overweight and obesity in adults. Bethesda (MD): National Institutes of Health; 2000. [Google Scholar]
- 2.Yan LL, Daviglus ML, Liu K, Stamler J, Wang R, Pirzada A, et al. Midlife body mass index and hospitalization and mortality in older age. JAMA. 2006;295(2):190–198. doi: 10.1001/jama.295.2.190. [DOI] [PubMed] [Google Scholar]
- 3.Tuomilehto J, Lindstrom J, Eriksson JG, Valle TT, Hamalainen H, Ilanne-Parikka P, et al. Prevention of type 2 diabetes mellitus by changes in lifestyle among subjects with impaired glucose tolerance. N Engl J Med. 2001;344(18):1343–1350. doi: 10.1056/NEJM200105033441801. [DOI] [PubMed] [Google Scholar]
- 4.Knowler WC, Barrett-Connor E, Fowler SE, Hamman RF, Lachin JM, Walker EA, et al. Reduction in the incidence of type 2 diabetes with lifestyle intervention or metformin. N Engl J Med. 2002;346(6):393–403. doi: 10.1056/NEJMoa012512. [DOI] [PMC free article] [PubMed] [Google Scholar]
- 5.Pan XR, Li GW, Hu YH, Wang JX, Yang WY, An ZX, et al. Effects of diet and exercise in preventing NIDDM in people with impaired glucose tolerance. The Da Qing IGT and Diabetes Study. Diabetes Care. 1997;20(4):537–544. doi: 10.2337/diacare.20.4.537. [DOI] [PubMed] [Google Scholar]
- 6.The Trials of Hypertension Prevention Collaborative Research Group. Effects of weight loss and sodium reduction intervention on blood pressure and hypertension incidence in overweight people with high-normal blood pressure: the Trials of Hypertension Prevention, phase II. Arch Intern Med. 1997;157(6):657–667. [PubMed] [Google Scholar]
- 7.Ryan DH, Espeland MA, Foster GD, Haffner SM, Hubbard VS, Johnson KC, et al. Look AHEAD (Action for Health in Diabetes): design and methods for a clinical trial of weight loss for the prevention of cardiovascular disease in type 2 diabetes. Control Clin Trials. 2003;24(5):610–628. doi: 10.1016/s0197-2456(03)00064-3. [DOI] [PubMed] [Google Scholar]
- 8.Anderson JW, Kendall CW, Jenkins DJ. Importance of weight management in type 2 diabetes: review with meta-analysis of clinical studies. J Am Coll Nutr. 2003;22(5):331–339. doi: 10.1080/07315724.2003.10719316. [DOI] [PubMed] [Google Scholar]
- 9.American Diabetes Association. Standards of medical care for patients with diabetes mellitus. Diabetes Care. 2003;26(1):S33–S49. doi: 10.2337/diacare.17.6.616. [DOI] [PubMed] [Google Scholar]
- 10.Wilson C, Gilliland S, Cullen T, Moore K, Roubideaux Y, Valdez L, et al. Diabetes outcomes in the Indian health system during the era of the Special Diabetes Program for Indians and the Government Performance and Results Act. Am J Public Health. 2005;95(9):1518–1522. doi: 10.2105/AJPH.2004.053710. [DOI] [PMC free article] [PubMed] [Google Scholar]
- 11.Mayfield JA, Rith-Najarian SJ, Acton KJ, Schraer CD, Stahn RM, Johnson MH, et al. Assessment of diabetes care by medical record review. The Indian Health Service model. Diabetes Care. 1994; 17(8):918–923. doi: 10.2337/diacare.17.8.918. [DOI] [PubMed] [Google Scholar]
- 12.Acton K, Valway S, Helgerson S, Huy JB, Smith K, Chapman V, et al. Improving diabetes care for American Indians. Diabetes Care. 1993;16(1):372–375. doi: 10.2337/diacare.16.1.372. [DOI] [PubMed] [Google Scholar]
- 13.Rosner B. Fundamentals of Biostatistics. Duxbury Press; Boston (MA): 1982. [Google Scholar]
- 14.National Institutes of Health. Clinical guidelines on the identification, evaluation, and treatment of overweight and obesity in adults--the evidence report. Obes Res. 1998;6(Suppl 2):51S–209S. [Published erratum in Obes Res 1998;6(6):464] [PubMed] [Google Scholar]
- 15.SAS/STAT User's Guide, Version 8. Durham (NC): SAS Institute, Inc; 2000. [Google Scholar]
- 16.Stidley CA, Shah VO, Narva AS, Dalton D, MacCluer JW, Bobelu A, et al. A population-based, cross-sectional survey of the Zuni Pueblo: a collaborative approach to an epidemic of kidney disease. Am J Kidney Dis. 2002;39(2):358–368. doi: 10.1053/ajkd.2002.30557. [DOI] [PubMed] [Google Scholar]
- 17.Serrano Rios M. Relationship between obesity and the increased risk of major complications in non-insulin-dependent diabetes mellitus. Eur J Clin Invest. 1998;28(Suppl 2):14–18. doi: 10.1046/j.1365-2362.1998.0280s2014.x. [DOI] [PubMed] [Google Scholar]
- 18.de Jong PE, Verhave JC, Pinto-Sietsma SJ, Hillege HL, PREVEND study group Obesity and target organ damage: the kidney. Int J Obes Relat Metab Disord. 2002;26(Suppl 4):S21–S24. doi: 10.1038/sj.ijo.0802213. [DOI] [PubMed] [Google Scholar]
- 19.Klein R, Klein BE, Moss SE. Is obesity related to microvascular and macrovascular complications in diabetes? The Wisconsin Epidemiologic Study of Diabetic Retinopathy. Arch Intern Med. 1997;157(6):650–656. [PubMed] [Google Scholar]
- 20.Zoppini G, Verlato G, Leuzinger C, Zamboni C, Brun E, Bonora E, et al. Body mass index and the risk of mortality in type II diabetic patients from Verona. Int J Obes Relat Metab Disord. 2003;27(2):281–285. doi: 10.1038/sj.ijo.802199. [DOI] [PubMed] [Google Scholar]
- 21.Leibson CL, Williamson DF, Melton LJ, 3rd, Palumbo PJ, Smith SA, Ransom JE, et al. Temporal trends in BMI among adults with diabetes. Diabetes Care. 2001;24(9):1584–1589. doi: 10.2337/diacare.24.9.1584. [DOI] [PubMed] [Google Scholar]
- 22.Sturm R. Increases in clinically severe obesity in the United States, 1986-2000. Arch Intern Med. 2003;163(18):2146–2148. doi: 10.1001/archinte.163.18.2146. [DOI] [PubMed] [Google Scholar]
- 23.Oser CS, Harwell TS, Strasheim C, Fogle C, Blades LL, Dennis TD, et al. Increasing prevalence of cardiovascular risk factors among American Indians in Montana. Am J Prev Med. 2005;28(3):295–297. doi: 10.1016/j.amepre.2004.12.014. [DOI] [PubMed] [Google Scholar]
- 24.Lee ET, Howard BV, Savage PJ, Cowan LD, Fabsitz RR, Oopik AJ, et al. Diabetes and impaired glucose tolerance in three American Indian populations aged 45-74 years. The Strong Heart Study. Diabetes Care. 1995;18(5):599–610. doi: 10.2337/diacare.18.5.599. [DOI] [PubMed] [Google Scholar]
- 25.DeFronzo RA. Pharmacologic therapy for type 2 diabetes mellitus. Ann Intern Med. 2000;133(1):73–74. doi: 10.7326/0003-4819-133-1-200007040-00016. [DOI] [PubMed] [Google Scholar]
- 26.Looker HC, Knowler WC, Hanson RL. Changes in BMI and weight before and after the development of type 2 diabetes. Diabetes Care. 2001;24(11):1917–1922. doi: 10.2337/diacare.24.11.1917. [DOI] [PubMed] [Google Scholar]
- 27.United Kingdom Prospective Diabetes Study (UKPDS). 13: Relative efficacy of randomly allocated diet, sulphonylurea, insulin, or metformin in patients with newly diagnosed non-insulin dependent diabetes followed for three years. BMJ. 1995;310(6972):83–88. [PMC free article] [PubMed] [Google Scholar]
- 28.Fujioka K. Management of obesity as a chronic disease: nonpharmacologic, pharmacologic, and surgical options. Obes Res. 2002;10(Suppl 2):116S–123S. doi: 10.1038/oby.2002.204. [DOI] [PubMed] [Google Scholar]
- 29.Mercer SL, Green LW, Rosenthal AC, Husten CG, Khan LK, Dietz WH. Possible lessons from the tobacco experience for obesity control. Am J Clin Nutr. 2003;77(4 Suppl):1073S–1082S. doi: 10.1093/ajcn/77.4.1073S. [DOI] [PubMed] [Google Scholar]
- 30.Carter JS, Pugh JA, Monterrosa A. Non-insulin-dependent diabetes mellitus in minorities in the United States. Ann Intern Med. 1996;125(3):221–232. doi: 10.7326/0003-4819-125-3-199608010-00011. [DOI] [PubMed] [Google Scholar]