

Abstract
Our laboratories have reported that TNF-α causes myelin damage and apoptosis of oligodendrocytes and their precursors in vitro and in vivo. We also have reported that IGF-I can protect cultured oligodendrocytes and their precursors from TNF-α-induced damage. In this study, we investigated whether IGF-I can protect oligodendrocytes and myelination from TNF-α-induced damage in vivo by cross-breeding TNF-α transgenic (Tg) mice with IGF-I Tg mice that overexpress IGF-I exclusively in brain. At 8 weeks of age, compared to wildtype (WT) mice, the brain weights of TNF-α Tg mice were decreased by ~20%, while those of IGF-I Tg mice were increased by ~20%. The brain weights of mice that carry both TNF-α and IGF-I transgenes (TNF-α/IGF-I Tg mice) did not differ from WT mice. As judged by histochemical staining and immunostaining, myelin content in the cerebellum of TNF-α/IGF-I Tg mice was similar to that in WT mice and much more than that in TNF-α Tg mice. Consistently, western immunoblot analysis showed that myelin basic protein abundance in the cerebellum of TNF-α/IGF-I Tg mice was double that in TNF-α Tg mice. Compared to WT mice, the number of oligodendrocytes was decreased by ~36% in TNF-α Tg mice, while it was increased in IGF-I Tg mice by ~40%. Oligodendrocyte number in TNF-α/IGF-I Tg mice was almost as twice many as that in TNF-α Tg mice. Furthermore, IGF-I overexpression significantly reduced TNF-α-induced increases in apoptotic cell number, active caspase-3 abundance and degraded MBP. Our results indicate that IGF-I is capable of protecting myelin and oligodendrocytes from TNF-α-induced damage in vivo.
Keywords: IGF-I, TNF-α, brain, myelination, oligodendrocytes, development, transgenic mice
INTRODUCTION
Insulin-like growth factor-I (IGF-I) is widely expressed in the central nervous system (CNS) during development (Bach et al., 1991; Bartlett et al., 1992), and plays an important role in the development and survival of oligodendrocytes and their precursors, as well as in myelination (Baker et al., 1993; Carson et al., 1993; Ye et al.,1995b, 2002). Several lines of evidence also strongly suggest that IGF-I protects the CNS from demyelinating injury and promotes recovery after damage. For example: 1) IGF-I expression increases in astrocytes located in and/or near lesion areas in patients with multiple sclerosis (MS) (Gveric et al., 1999), in rats with experimental allergic encephalomyelitis (EAE, Liu et al., 1994), a rat model of MS, and in mice following chemical insults (Komoly et al., 1992; Fushimi and Shirabe, 2004); 2) IGF-I treatment of mouse spinal cord organotypic cultures blocks demyelination induced by anti-white matter antiserum and complement (Roth et al., 1995); 3) systemic injection of IGF-I into EAE rats reduces lesion severity and clinical deficits, and increases the expression of myelin-related protein genes in CNS (Yao et al., 1995); and 4) overexpression of IGF-I in the brains of transgenic (Tg) mice promotes oligodendrocyte survival following cuprizone-induced injury (Mason et al., 2000).
Tumor necrosis factor-α (TNF-α) has been implicated in demyelinating injury. Its abundance is greatly increased in and near damaged CNS regions and in the cerebral-spinal fluid of MS patients and its animal model EAE. Previously one of our laboratories showed that TNF-α transgene overexpression specifically in the brain results in severe CNS demyelination, oligodendrocyte apoptosis and early death of the affected mice (Akassoglou et al., 1997; Probert et al., 1995). In these Tg mice TNF-α also reduces the brain expression of IGF-I and alters the abundance of a number of IGF system proteins capable of modulating IGF-I actions (Ye et al., 2003), suggesting that reduced IGF-I availability is responsible, at least in part, for TNF-α effects on oligodendrocytes and myelin. The latter conclusion is further supported by our in vitro data showing that addition of IGF-I to culture medium inhibits TNF-α-induced apoptosis in oligodendrocytes and their precursors (Ye and D'Ercole, 1999).
To examine whether IGF-I can protect oligodendrocytes and myelination against TNF-α-induced damage in vivo, as it does in cultured oligodendrocytes, we cross-bred Tg mice that overexpress IGF-I in brain with TNF-α Tg mice, and compared myelination in TNF-α Tg mice and in Tg mice that express both IGF-I and TNF-α transgenes. Because the TNF-α Tg mice exhibited transgene expression exclusively in brain and significant changes in cerebellum (CB) (Probert, 1995; Ye et al., 2003), we utilized a line of IGF-I Tg mice, which exhibit high IGF-I transgene expression (driven by a mouse IGF-II promoter) in CB and a near doubling of adult CB weight (Ye et al., 1996). In this report we demonstrate that IGF-I protects oligodendrocyte and myelin from TNF-α-induced damage in vivo.
MATERIALS AND METHODS
Mice
Generation and characterization of IGF-I Tg mice and TNF-α Tg (line Tg6074 ) mice were described in detail elsewhere (Ye et al., 1996; Probert et al., 1995). To obtain similar genomic background both lines of Tg mice were cross-bred to C57BL/6 (Charles River Laboratories, Wilmington, MA) for at least 10 generations. IGF-I Tg mice were bred as heterozygous and routinely identified by polymerase chain reaction (PCR) of tail DNA, using 20-mer oligonucleotide primers, as previously reported (Ye et al., 1996). To maintain and derive TNF-α Tg mice, which die between 8 and 12 weeks of age (Probert et al., 1995), heterozygous TNF-α Tg mice were bred with TNF p55 receptor (TNFIR) null mutant mice. TNFIR null mutation negated the pathology induced by TNF-α and allowed survival and fertility beyond 8 to 12 weeks of age (Akassoglou et al., 1998). The genotypes of TNF-α and TNFIR null mutation were identified by PCR of tail DNA using primers specific for the TNF-α transgene and for the neomycin gene that disrupts the TNFIR gene, respectively.
To obtain mice that carry both IGF-I and TNF-α transgenes, IGF-I Tg mice were bred with mice heterozygous for both the TNF-α transgene and TNFIR null mutation. This mating strategy generated 8 types of mice: 1) wild type (WT) mice, 2) IGF-I Tg mice, 3) TNF-α Tg mice, 4) mice heterozygous for both the IGF-I and TNF-α transgenes (TNF-α/IGF-I Tg mice), 5) heterozygous TNFIR null mutant mice (TNFIR+/−), 6) mice heterozygous for the IGF-I transgene and the TNFIR null mutation (IGF-I/TNFIR+/− mice), 7) mice heterozygous for both the TNF-α transgene and TNFIR null mutation (TNF-α/TNFIR+/−), and 8) mice heterozygous for the IGF-I and TNF-α transgenes, and the TNFIR null mutation (TNF-α/IGF-I/TNFIR+/− mice). TNFIR+/− and TNF-α/TNFIR+/− mice exhibited apparently normal brain growth and histology as previously reported (Akassoglou et al., 1998), and were excluded in this study, as were IGF-I/TNFIR+/− and TNF-α/IGF-I/TNFIR+/− mice.
Mice (8–10 weeks of age, except for where indicated) were sacrificed using CO2. After weighing mice, brains were dissected and weighed. All procedures used were compliant with the guidelines of the National Institutes of Health, and approved by the institutional review committees of the University of North Carolina at Chapel Hill, USA and Biomedical Sciences Research Center, Greece.
Histochemical and Immunohistochemical Staining
Mice were transcardially perfused with 4% paraformaldehyde in phosphate-buffered saline (PBS). Brains were removed, further fixed in the same fixative overnight, and split along the middle sagittal line. Left hemispheres were paraffin embedded, sagittally sectioned at a thickness of 6 – 8 km, and subjected to Luxol Fast Blue-Periodic Acid Schiff (LFB-PAS) myelin staining and glutathione–s-transferase-π (GST-π) immunostaining. Right hemispheres were cryo-protected with 20% sucrose, frozen-sectioned sagittally at a thickness of 8 – 10 km. After blocking unspecific background staining with 5% dry milk in 1X PBS, sections were subjected to immunostaining with various antibodies. The concentration of each antibody used is as follows: NG2 antibody (1:200, a gift from Dr. Bill Stallcup, The Burnham Institute, La Jolla, CA), GST-π antibody (1:500, Medlabs, Dublin, Ireland), proteolipid protein (PLP) antibody (1:250, Chemicon Internationals, Temecula, CA), myelin basic protein (MBP) antibody (1:800, Chemicon), degraded MBP (De-MBP) antibody (1:1,000, Chemicon), single stranded DNA (ssDNA) antibody (1:10, Chemicon), CC1 antibody (1:50, Oncogene Research Products, San Diego, CA) or active caspase-3 antibody (1:200, Cell Signaling Technology, Beverly, MA). Antibody-antigen complexes were detected using a peroxidase-containing ABC kit (Vector Laboratories, Burlingame, CA) and visualized by incubation with DAB.
To quantify the number of oligodendrocytes and their precursors, 2 – 5 near mid-sagittal sections were immunostained with GST-π or NG2 antibody, respectively, followed by counter-staining with hematoxylin. Images of CB were digitally captured using a microscope and a Spot Jr. digital camera (Diagnostic Instruments, Sterling Heights, MI). The area of the CB medulla in each section was measured with a computer-assisted image analysis system Stereo Investigator software (Microbrightfield, Colchester, VT). Immuno-labeled cells with clear nuclei in the area were counted, and the density of the labeled cells was calculated by dividing immunostained cells by area. To correct potential counting bias due to difference in cell size and nuclear splitting among mice, cell nuclear volume (>200 in each brain) was measured, and, if needed, a correction was performed using Abercrombie's method (Abercrombie, 1946).
Terminal Uridine Nucleotide End Labeling (TUNEL)
After de-waxing and re-hydration, sagittal CB sections (8 km in thickness) were subjected to TUNEL reaction, using the In Situ Cell Death Detection Kit (Roche Applied Science, Indianapolis, IN), according to the manufacture’s protocol. Following TUNEL reaction, sections were subjected to imunostaining with CC1 antibody (1:50) and Cy3 conjugated anti-mouse IgG secondary antibody and DAPI nuclear staining. TUNEL-positive cells in each CB layer were visualized, and labeled cells each with a clear nucleus in the area were counted under a fluorescsence microscope. To quantify, the area of each CB layer was measured utilizing Stereo Investigator software (Microbrightfield), and the density of the labeled cells was calculated by dividing labeled cells by area.
Western immunoblot analysis
After dissection, CBs were frozen in liquid nitrogen and stored at −80oC until used. Protein extraction was performed as previously described (Ye and D'Ercole, 1998). Frozen tissue was pulverized, lysed and sonicated in lysis buffer (20 mM Tris-HCl, pH 7.4, 2% triton X-100 and 10 mM EDTA). Supernatants were collected by centrifugation at 12,000 rpm for 5 min at 4oC. Protein concentration was determined using a BCA protein kit (Pierce, Rockford, IL) and bovine serum albumin as a standard. Aliquots of 20 – 40 μg protein were separated on 12.5% polyacrylamide gels and transferred onto PVDF nylon membranes (Amersham, Arlington Heights, IL). Membranes were incubated with antibody against MBP (1:3,000), De-MBP (1:1,000), or caspase-3 (1:1,000, Santa Cruz Biotechnology, Santa Cruz, CA) and specific immunoreactivity was visualized using an ECL kit (Amersham) or ABC colometric kit (Vector), according to the manufactures’ protocols. Quantification of specific protein abundance was performed using a computer-assisted image analysis system (Image-Pro, Media Cybermetics, Silver Spring, MD). To insure equal loading of protein, membranes were incubated with anti-actin antibody (1:500, Sigma, St Louis, MO) after probing with anti-MBP, anti-De-MBP or caspase-3 antibody. The protein abundance in each lane was normalized to actin abundance.
RNA isolation, and reverse transcription followed by quantitative real-time PCR
RNA was isolated from CB of 3-week-old Tg mice, a time when IGF-I and TNF-α transgenes reach their peak expression, using a RecoverAll Total Nucleic Acid Isolation Kit (Ambion, Austin, TX), according the manufacturer’s protocol. TNF-α mRNA abundance was quantified by reverse-transcription (RT) of mRNA using random decamer primers and superscript II reverse transcriptase (Invitrogen, Carlsbad, CA), followed by quantitative real-time PCR using TNF-α specific primers, a Sybr green-containing RealMasterMix Kit (Eppendoff, Westbury, NY) and a Realplex real-time cycler (Eppendoff). The relative abundance of TNF-α mRNA was determined and calculated, using Realplex software (Eppendoff) and actin mRNA abundance as a reference. Sequence of primers used for TNF-α PCR was as follows: forward primer, 5’-GCCTCTTCTCATTCCTGCTTG-3’, and reverse primer: 5’-GATGATCTGAGTGTGAGGGTCT-3’. Actin primers used as previously reported (Zhang et al., 1998).
Statistics
One way ANOVA was used to test statistic significance among the groups, and followed by comparison of each group mean using Newman-Keuls Student test assisted with software SigmaStat for Widows (SPSS, Inc., Chicago, IL).
RESULTS
As previously reported (Probert et al., 1995; Ye et al., 2003), TNF-α Tg mice exhibited a severe retardation in body and brain growth during development. Compared to WT controls at 8 – 10 weeks of postnatal age, the body weights in TNF-α Tg mice were decreased by about 50% (Table 1), and both total brain weight and CB weights in these mice were decreased by ~20 % (Figure 1). TNF-α Tg mice also exhibited trembling, hind limb paralysis and seizures. Greater than 85% of TNF-α Tg mice died by 12 weeks of age. In contrast to similar body weights of WT and IGF-I Tg mice (Table 1), weights of whole brain and CB in IGF-I Tg mice were increased by ~30% and 61%, respectively (Figure 1), a finding that is consistent with our previous data (Ye et al., 1996). Neither body weight, gross neurological phenotype, nor survival was altered by IGF-I overexpression in the mice carrying the TNF-α transgene, i.e., TNF-α/IGF-I Tg mice. IGF-I transgene expression, however, normalized the brain weights in TNF-α/IGF-I Tg mice (Figure 1). Because brain weights of male and female mice from each experimental group were similar, data from both male and female mice of each experimental group were grouped for analysis.
Table 1.
Body weights of 8–10 week old WT, IGF-I Tg, TNF-α Tg, and TNF-α/IGF-I Tg mice (gram, mean ± SE).
| Male | Female | |
|---|---|---|
| WT | 22.93 ± 0.70 (7) | 19.06 ± 0.56 (5) |
| IGF-I | 24.22 ± 1.18 (7) ^ | 18.67 ± 1.41 (4) ^ |
| TNF-α | 11.92 ± 0.84 (11)* | 9.36 ± 0.82 (12)* |
| IGF-I/TNF-α | 10.56 ± 1.55 (5) * | 9.89 ± 1.42 (6) * |
The number of mice examined is shown in parenthesis.
, P < 0.001; compared to WT mice.
P < 0.001, compared to TNF-α Tg mice.
Figure 1.
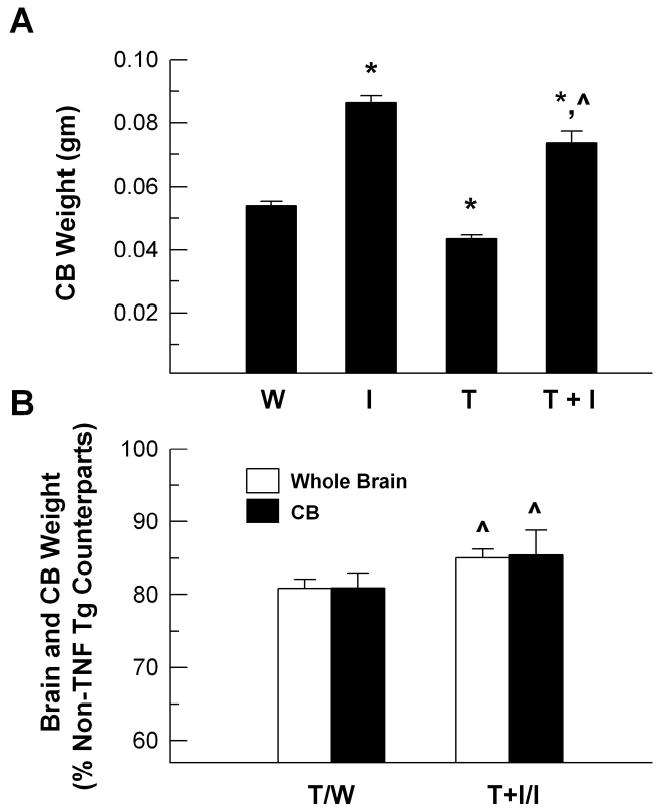
Cerebellum and whole brain weights of 8–10 week old WT (W), IGF-I Tg (I), TNF-α Tg (T), and TNF-α/IGF-I Tg (T+I) mice. Panel A. Cerebellar (CB) weight is expressed as percentage of that of WT mice. Panel B. CB, as well as whole brain, weights of TNF-α Tg (T) and TNF-α/IGF-I Tg (T+I) mice are expressed as the percentage of their non-TNF-α Tg counterparts, respectively. The values represent mean ± SE from 5 – 6 mice. *, P<0.05, compared to WT controls. ^, P <0.05, compared to TNF-α Tg mice.
To assess changes in myelination in the CB of Tg mice, we first employed LFB-PAS to stain myelin. Compared to WT mice (Figure 2, panels A), the abundance of blue-stained myelin was modestly increased in IGF-I Tg mice (Figure 2, panels B), and significantly reduced in TNF-α Tg mice (Figure 2, panels C). The LFB-PAS myelin staining in TNF-α/IGF-I Tg mice, however, was relatively abundant (Figure 2, panels D), and was much more than that in TNF-α Tg mice. As previously reported (Akassoglou et al., 1998), the number of PAS positive red-stained macrophage-like cells was markedly increased in the CB of TNF-α Tg mice (Figure 2, panels C and G), and were much less numerous in TNF-α/IGF-I Tg mice (Figure 2, panels D and H). As with the changes in LFB-PAS myelin staining, MBP and PLP immunoreactivity exhibited a similar pattern of change in the CB of TNF-α Tg and TNF-α/IGF-I Tg mice (Figure 2).
Figure 2.

Myelin staining of cerebellum (CB). Photomicrographs of CB sagittal sections from a wild type (WT, panels A, E, I and M), an IGF-I Tg (IGF, panels B, F, J and N), a TNF-α Tg (TNF, panels C, G K and O), and a TNF-α/IGF-I Tg (TNF/IGF, panels D, H, L and P) mouse are shown. Near mid-sagittal sections were subjected to LFB-PAS staining, MBP and PLP immunostaining, respectively. Panels E, F, G, and H show boxed areas in panels A, B, C, and D, respectively. In panels G and H arrowheads point to PAS-positive macrophage-like cells, and arrows point to apoptotic cells with pyknotic nuclei. Med = medulla, Mol = molecular layer, Gl = granular layer. Scale bar = 200 μm in panels A – D, and = 20 μm in panels E – P.
To further examine changes in myelin, we evaluated MBP degradation in TNF-α Tg and TNF-α/IGF-I Tg mice using an antibody that is reported to specifically recognize “degraded” MBP (De-MBP antibody, Data sheet, Chemicon). As expected, CB from WT and IGF-I Tg mice showed little or no reaction with the De-MBP antibody (Figure 3, panels A and B), while TNF-α Tg mice exhibited an increased yellowish-brown De-MBP immunostaining (Figure 3, panel C), when compared to that in the CB of WT mice. IGF-I overexpression in TNF-α Tg mice appeared to modestly reduce the De-MBP immunoreactivity (Figure 3, panel D), compared to that in TNF-α Tg mice.
Figure 3.
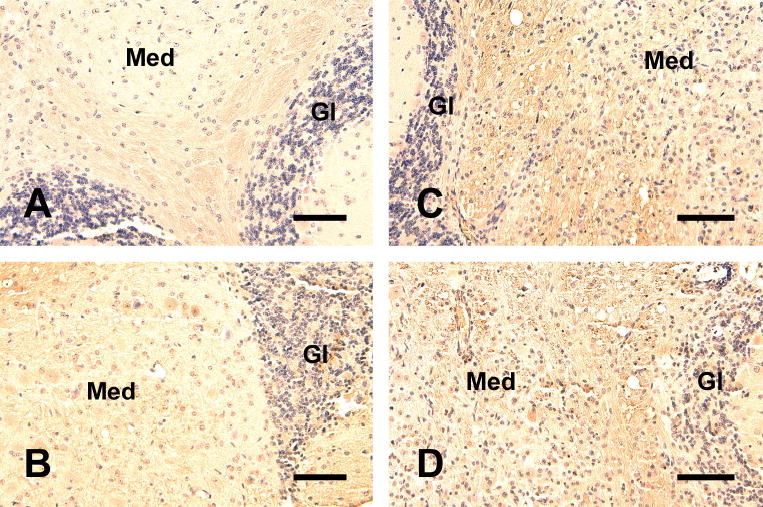
Representative photomicrographs of immunostaining for degraded MBP in the cerebellum. Near mid-sagittal sections of a WT (panel A), an IGF-I Tg (panel B), a TNF-α Tg (panel C), and a TNF-α/IGF-I Tg (panel D) mouse were subjected to De-MBP immunostaining. Note that in panel C (TNF-α Tg) the yellowish-brown stained De-MBP in medulla is more abundant. Med = medulla, Gl = granular layer. Scale bar = 50 μm.
Changes in MBP abundance were quantified using western immunoblot analysis. In WT and IGF-I Tg mice four protein bands at molecular weights of 14, 17, 18 and 20 kDa were abundant (Figure 4, panel A). In Tg mice carrying the TNF-α transgene, however, two other MBP-immunoreactive protein bands of ~10 and ~25 kDa also were observed (Figure 4, panel A). The ~10 kDa MBP band was abundant in all mice overexpressing TNF-α, while the ~25 kDa MBP was seen only in TNF-α/IGF-I Tg mice. Pre-treatment of protein lysates with phosphatase eliminated the 25 kDa band on immunoblot (data not shown). When the abundances of all the larger bands were combined (excluding the 10 kDa band because it appeared to represent a degraded MBP), TNF-α Tg mice exhibited significant reduction in MBP abundance by ~74 % as compared to WT mice (Figure 4, panel B and Figure 5). When the IGF-I transgene was expressed in the CB of TNF-α Tg mice, however, the reduction in MBP became less significant (Figure 4, panel B and Figure 5).
Figure 4.

Western immunoblot analysis of cerebellar MBP and De-MBP. Proteins derived from WT (W), IGF-I Tg (I), TNF-α Tg (T), and TNF-α/IGF-I Tg (T+I) mice were size fractionated on polyacrylamide gels, transferred onto PVDF membranes, and subjected to immuno-detection and analysis. Panel A. Representative MBP immunoblot. Two arrows at the right of the panel point to two MBP bands (10 and 25 kDa) that only are observed in TNF-α Tg and TNF-α/IGF-I Tg mice. The lower panel shows actin bands. Panel B. Quantification analysis of MBP abundance, expressed as the percentage of WT. Panel C. Representative De-MBP immunoblot. Panel D. Quantification of De-MBP abundance, expressed as the percentage of WT. In both panels A and C arrowheads at the left of the panel indicate the size of each intact MBP band. The abundance of MBP and De-MBP is expressed as the percentage of that in WT mice. The values represent mean ± SE from 5 – 6 mice. *, P<0.05; **, P<0.01, compared to WT mice. ^, P <0.05, compared to TNF-α Tg mice.
Figure 5.

Abundance of cerebellar MBP and De-MBP protein in WT (W), IGF-I Tg (I), TNF-α Tg (T), and TNF-α/IGF-I Tg (T+I) mice. The abundance of cerebellar MBP and De-MBP proteins shown in Figure 4 is expressed as the percentage of their non-TNF-α Tg counterparts, respectively. The values represent mean ± SE from 3 – 4 mice. ^, P<0.05; ^^, P<0.01, compared to TNF-α Tg mice.
Consistent with its immunohistochemical staining, protein derived from WT CB reacted weakly with De-MBP antibody (Figure 4, panel C). Multiple bands of proteins of approximately 14, 17 and 18 kDa, however, were variably observed to react with this antibody in CB of IGF-I, TNF-α, and TNF-α/IGF-I Tg mice. The ~14 kDa band was most abundant (Figure 4, panel C). When all the bands were combined and quantified, the abundance of De-MBP was highest in the CB of TNF-α Tg mice, and was about twice that observed in TNF-α/IGF-I Tg mice (Figure 4, panel D).
We next assessed the extent of IGF-I protective effects on TNF-α-induced damage in the cells of oligodendrocyte lineage by quantifying GST-π-positive oligodendrocytes and NG2-positive oligodendrocyte precursors. Representative photomicrographs of GST-π and NG2 immunostaining are shown as Figure 6. Compared to that of WT mice, the number of brown-stained GST-π-positive oligodendrocytes was decreased by ~36% in the CB of TNF-α Tg mice, while it was increased by ~40% in IGF-I Tg mice (Figures 6 and 7). The number of oligodendrocytes in TNF-α/IGF-I Tg mice was near that of WT controls and almost as twice many as that in TNF-α Tg mice. The number of NG2-positive cells, however, was significantly increased in TNF-α Tg mice, and was near normal in TNF-α/IGF-I Tg mice (Figures 6 and 7).
Figure 6.
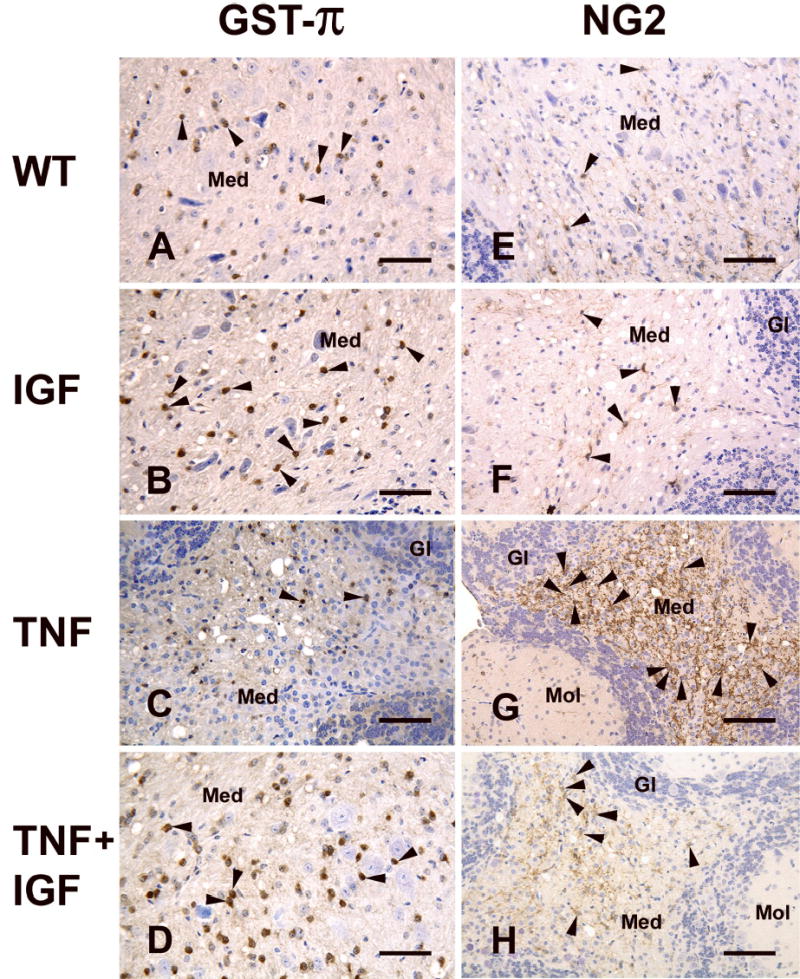
Representative photomicrographs of GST-π and NG2 immunostaining of cerebellum (CB). Sagittal CB sections of a WT (panels A and E), an IGF-I Tg (panels B and F), a TNF-α Tg (panels C and G), and a TNF-α/IGF-I (panels D and H) Tg mouse are shown. Oligodendrocytes and their precursors were immunostained with antibody specific for GST-π (panels A, B, C and D) or NG2 (panels E, F, D and H), respectively. Antibody-antigen complexes were detected using an ABC kit, and visualized by incubation with DAB. Sections then were counter-stained with hematoxylin. Arrowheads point to brown-stained GST-π-positive cells in panels A, B, C, and D, and to brown-stained NG2-positive cells in panels E, F,G, and H. Med = Medulla, Mol = molecular layer, and Gl = granular layer. Scale bar = 100 μm.
Figure 7.
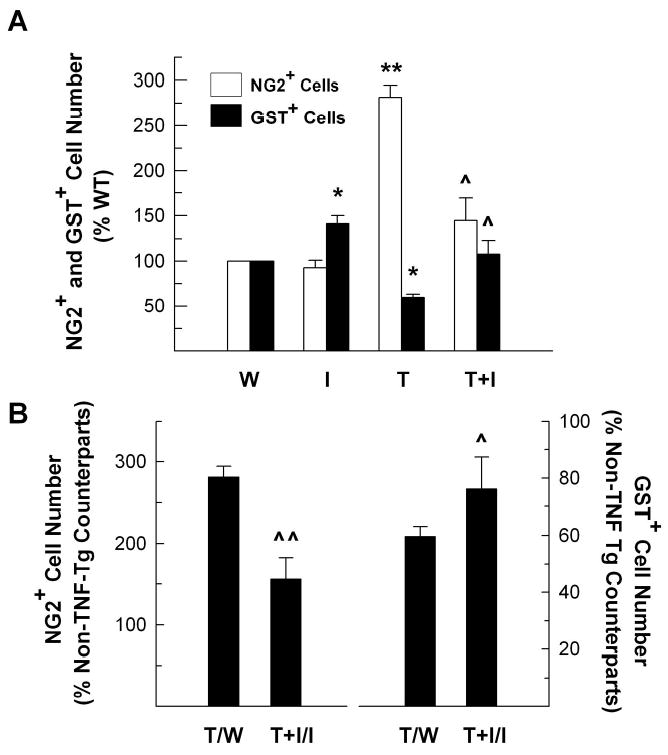
The number of GST-π-positive oligodendrocytes and NG2-positive oligodendrocyte precursors in the cerebellum of WT (W), IGF-I Tg (I), TNF-α Tg (T) and TNF-α/IGF-I Tg (T+I) mice. Panel A. The number of GST-π-positive oligodendrocytes and NG2-positive precursors is expressed as the percentage of WT mice. Panel B. The number of GST-π-positive oligodendrocytes and NG2-positive precursors shown in panel A is expressed as the percentage of their non-TNF-α Tg counterparts, respectively. The values represent mean ± SE from 3 – 4 mice. *, P<0.05; **, P<0.01, compared to WT controls. ^, P <0.05; ^^, P <0.01, compared to TNF-α Tg mice
To determine whether IGF-I protects oligodendrocyte lineage cells from TNF-α-induced apoptosis, we examined the number of apoptotic cells in the CB. In the CB of WT mice, only a few of TUNEL-positive apoptotic cells were observed, being 3.31 ±1.07/mm2 in medulla, 1.96 ± 0.61/mm2 in granule cell layer, and 2.61 ± 0.41/mm2 in molecular layer, respectively. Compared to WT mice, the number of apoptotic cells in IGF-I Tg mice was reduced by ~25% in the molecular layer and ~30% in granule cell layer, a finding that is consistent with our previous study showing a reduced apoptotic cell number in the CB external granule cell layer of developing IGF-I Tg mice (Chrysis et al, 2001). In contrast, the number of apoptotic cells in CB medullar, molecular and internal granule layers was respectively increased by ~10, ~12 and ~15 folds, as compared to WT mice (Figure 8). Compared to that in TNF-α Tg mice, the number of apoptotic cells in the all three CB compartments of TNF-α/IGF-I Tg mice was significantly reduced (Figure 8).
Figure 8.
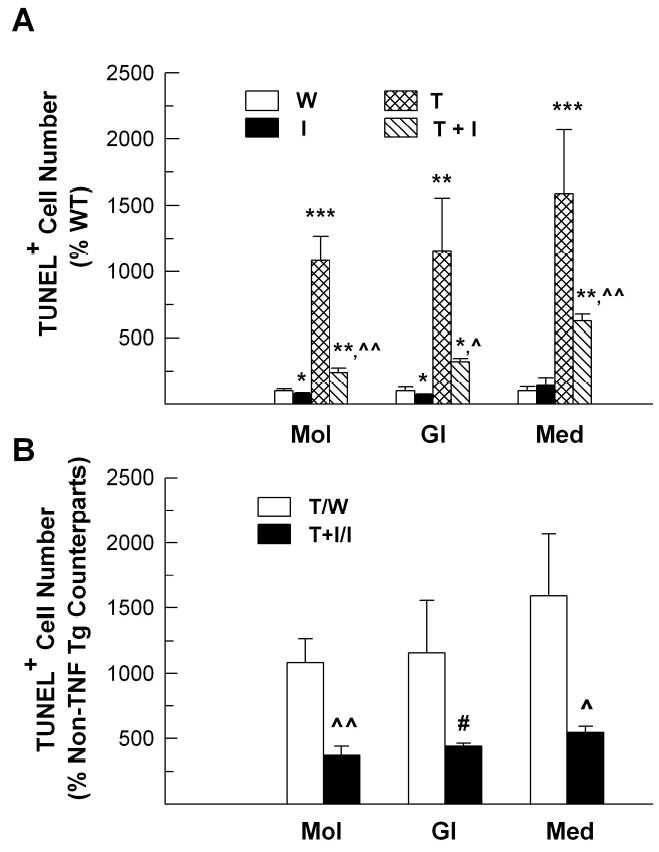
The number of TUNEL-positive apoptotic cells in the cerebellum of WT (W), IGF-I Tg (I), TNF-α Tg (T) and TNF-α/IGF-I Tg (T+I) mice. Panel A. The number of TUNEL-positive cells in the molecular layer (Mol), granule cell layer (Gl) and medulla (Med) of CB. Panel B. The number of TUNEL positive cells shown in panel A is expressed as the percentage of their non-TNF-α Tg counterparts, respectively. The values represent mean ± SE from 4 mice. *, P<0.05; **, P<0.01; ***, P<0.001, compared to WT mice. #, P=0.06; ^, P <0.05; ^^, P<0.01, compared to TNF-α Tg mice.
Double-staining for TUNEL, active caspase-3 or ssDNA (apoptotic cell markers), and CC1 and NG2, markers of mature oligodendrocytes and their precursors, respectively, however, showed that only a very small fraction of cells were labeled with both the apoptotic and oligodendrocyte lineage markers, likely because apoptosis cells no longer expressed these markers. Consequently, it was not possible to accurately determine the number of apoptotic oligodendrocytes.
Consistent with TUNEL staining, active caspase-3 abundance in the CB, as judged by western immunoblot analysis, showed a similar pattern of change (Figure 9). As expected, little active caspase-3 (seen as a 20 kDa band protein in western analysis) was observed in WT and IGF-I Tg mice (Figure 9, panel A). Compared to WT mice, the abundance of active caspase-3 in the CB of TNF-α Tg mice was increased by ~9 fold (Figure 9, panel B). Overexpression of IGF-I in TNF-α Tg mice reduced the abundance of active caspase-3 by ~30% (Figure 9). The pro-caspase-3 enzyme also appeared to be increased in TNF-α, and TNF-α/IGF-I Tg mice, indicating an increased caspase-3 expression, as well as an increase in the active enzyme.
Figure 9.
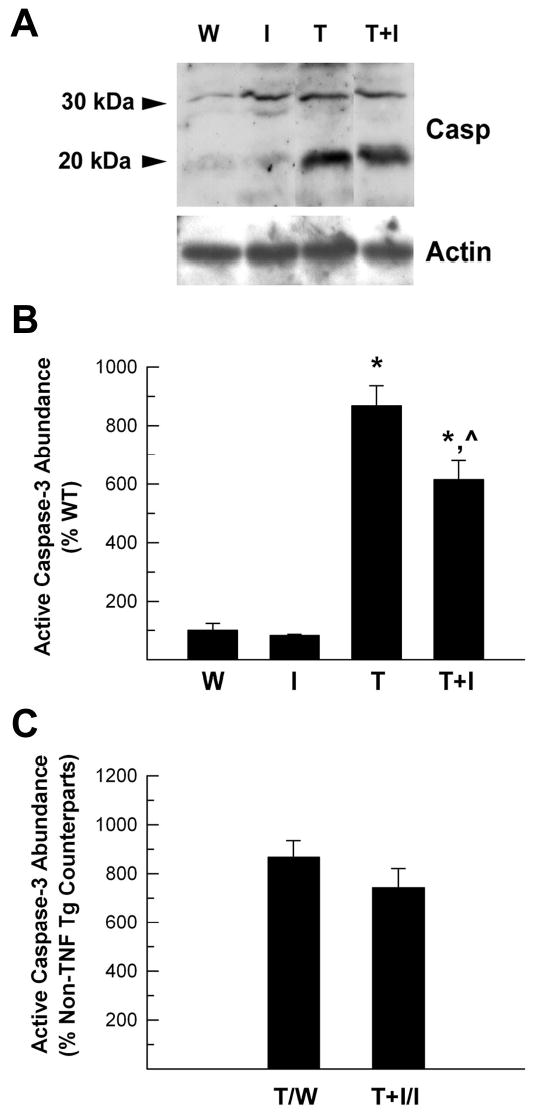
Abundance of active caspase-3 in cerebellum of TNF-α Tg mice and TNF-α/IGF-I Tg mice. Proteins derived from WT (W), IGF-I Tg (I), TNF-α Tg (T), and TNF-α/IGF-I Tg (T+I) mice were subjected to western immunoblot analysis. Panel A. Representative caspase-3 western immunoblot. Two arrows at the right of the panel point to pre-caspase-3 (30 kDa) and active caspase-3 (20 kDa) bands, respectively. The lower panel shows actin bands. Panel B. Quantification of active caspase-3 abundance. The abundance of active caspase-3 is expressed as the percentage of that in WT mice. Panel C. The abundance of active caspase-3 shown in panel B is expressed as the percentage of their non-TNF-α Tg counterparts, respectively. The values represent mean ± SE from 3 – 4 mice. *, P<0.05, compared to WT mice. ^, P<0.05, compared to TNF-α Tg mice.
We next asked whether IGF-I actions on oligodendrocyte lineage cells and myelin are mediated by modulating TNF-α transgene expression. Because TNF-α mRNAs of endogenous gene and of the transgenic origin are indistinguishable, total TNF-α mRNA abundance in CB was evaluated by RT and quantitative real-time PCR (Figure 10). TNF-α mRNA abundance was similar in WT and IGF-I Tg mice, and was markedly increased in Tg mice that express TNF-α transgene (Figure 10). TNF-α mRNA abundance in TNF-α/IGF-I transgenic mice, however, was identical to that in TNF-α Tg mice (Figure 10).
Figure 10.
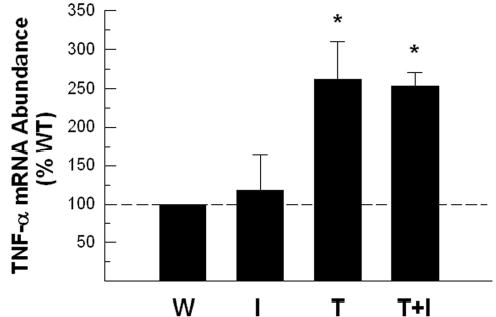
Abundance of TNF-α mRNA in cerebellum of WT (W), IGF-I Tg (I), TNF-α Tg (T) and TNF-α/IGF-I Tg (T+I) mice. CB TNF-α mRNA abundance is expressed as the percentage of that in WT CB. The values represent mean ± SE from 3 – 4 mice. *, P<0.05, compared to WT mice.
DISCUSSION
Using Tg mice as a model we have shown that IGF-I ameliorates TNF-α-induced detrimental effects on oligodendrocyte lineage cells and myelination in vivo. More specifically, we have shown that overexpression of IGF-I in the brain blunts TNF-α-induced reductions in brain growth, myelin content, MBP abundance, and the number of GST-π-positive mature oligodendrocytes. We have also demonstrated that IGF-I reduces the abundance of degraded MBP immuno-reactivity in TNF-α Tg mice. Furthermore, IGF-I ameliorates the TNF-α overexpression-induced increases in active caspase-3 abundance, apoptotic cell number, and NG2-positive oligodendrocyte precursor number. These results are consistent with our previous data showing that: 1) TNF-α overexpression in CNS results in severe CNS demyelination, oligodendrocyte apoptosis and early death of the affected animals (Akassoglou et al., 1997; Probert et al., 1995); 2) IGF-I promotes survival and proliferation of cells of the oligodendrocyte lineage during development in IGF-I Tg mice (Ye et al., 1995a, 1995b, 2000, 2002); and 3) IGF-I protects against TNF-α-induced damage in culture (Ye and D'Ercole, 1999). The data in this current study further support an important role for TNF-α in the pathogenesis of demyelinating diseases, such as MS, and point to a potential therapeutic use of IGF-I in treatment of these disorders.
Our data are consistent with the conclusion that IGF-I inhibits TNF-α-induced apoptosis of mature oligodendrocytes. The precise nature of these IGF-I actions, however, remains to be elucidated. In the CB of Tg mice overexpressing TNF-α the number of oligodendrocytes was significantly reduced, while the number of TUNEL-positive apoptotic cells was markedly increased. Overexpression of IGF-I significantly ameliorated the TNF-α-induced increase in the number of apoptotic cells and increased the oligodendrocyte number that was reduced by TNF-α. These IGF-I effects do not appear to be mediated by modulation of TNF-α expression, because overexpression of IGF-I does not affect TNF-α mRNA abundance.
Because only a very small fraction of apoptotic cells could be labeled with cellular markers, we could not with certainty determine the identity of the cells induced to undergo apoptosis by TNF-α. This situation is consistent with our previous findings showing that few cultured glial cells are positive for both apoptotic cell and oligodendrocyte lineage cell markers (Ye and D'Ercole, 1999). It is likely that dying apoptotic cells are removed and/or their antigenic marker(s) are lost rapidly, resulting in few cells capable of reacting to these antibodies. Nonetheless, our data showing that overexpression of IGF-I normalized the oligodendrocyte number, TNF-α-increased apoptotic cell number and active caspase-3 abundance suggest that apoptosis of mature oligodendrocytes, and in turn myelin damage, is a major consequence of TNF-α exposure, and that IGF-I ameliorates TNF-α-induced demyelination, at least in part, by promoting oligodendrocyte survival. This speculation is supported by our data and that of others demonstrating that: 1) TNF-α induces myelin damage and apoptosis-like cell death of oligodendrocytes and their precursors in the CNS of TNF-α Tg mice (Akassoglou et al., 1997; Probert et al., 1995) and in cultures (Louis et al., 1993; D'Souza et al., 1995; Ye and D'Ercole, 1999; Yi et al., 2005); and 2) IGF-I promotes survival of oligodendrocytes in vivo and in vitro (Mason et al., 2000; Ye et al., 1995b, 1999, 2000, 2002).
Consistent with our previous study showing a markedly increased number in A2B5+ oligodendrocyte precursors in TNF-α-treated cultures (Ye et al., 1999), we observed a marked increased in the number of NG2-positive oligodendrocyte precursors in TNF-α Tg mice. The number of NG2-positive oligodendrocyte precursors, as well as mature oligodendrocyte number, nearly normalized in the TNF-α Tg mice that overexpressed IGF-I. This pattern of change is identical to that observed in the demyelinating areas of IGF-I Tg mice treated with toxin cuprizone (Mason et al., 2000). TNF-α expression has been shown to be significantly increased following cuprizone treatment (Arnett et al., 2001). These data indicate that the increase in the number of NG2-positive oligodendrocyte precursors in the TNF-α Tg mice, likely the result of an increased proliferation (Ye et al., 1999; Arnett et al., 2001), is a response to the loss of mature oligodendrocytes. These data also suggest that IGF-I overexpression in TNF-α Tg mice increases oligodendrocyte survival and number, abrogating the stimulus for an increase in the number of NG2-positive oligodendrocyte precursors.
Using western immunoblot analysis and a polyclonal antibody against MBP, we observed two MBP immunoreactive protein bands at ~10 and ~25 kDa in TNF-α overexpressing mice that were not observed in WT or IGF-I Tg mice. The larger band was only observed in TNF-α/IGF-I Tg mice, and appears to be a phosphorylated isoform of MBP, because pre-treatment with phosphatase eliminated the band on immunoblot. The significance of the MBP phosphorylation by IGF-I in TNF-α Tg mice remains to be elucidated. The smaller ~10 kDa band was abundant in both TNF-α and TNF-α/IGF-I Tg mice. While this band seemed likely to be a MBP degradation product, it was not clearly recognized by De-MBP antibody. The latter antibody was generated using the methods reported by Matsuo et al (Matsuo et al., 1997, 1998), and was shown to react with MBP in areas of myelin degeneration observed in spinal cord and sciatic nerve (Chemicon, personal communication). In mice carrying the TNF-α transgene this De-MBP antibody strongly reacted with bands very similar or identical in size to normal MBP isoforms, with the ~14 kDa band being dominant. In WT mice the De-MBP antibody also reacted, albeit very weakly, with proteins similar or identical in size to normal MBP isoforms. These data suggest that an epitope(s) in MBP isoforms is uniquely available for De-MBP antibody binding after MBP degradation, and that this epitope(s) is not present or unavailable in smaller degraded MBP fragments, i.e., the ~10 kDa band. Alternatively, the De-MBP antibody may react with an epitope(s) that is available after post-translation modification(s) of MBP products and that is increased following myelin injury and degradation. We favor the latter speculation, because the De-MBP antibody reacted with the four MBP isoforms present in protein lysates extracted from WT mouse brains on western immunoblot, indicating the existence of an epitope(s) in intact MBP. Regardless of the nature of the epitope(s) recognized by the De-MBP antibody, these data indicate that: a) IGF-I normalizes TNF-α-induced changes in MBP in TNF-α Tg mice, and b) IGF-I is capable of protecting myelin from TNF-α-induced damage.
Although IGF-I morphologically and biochemically blunts TNF-α-induced brain myelin and oligodendrocyte damage, IGF-I overexpression does not improve either the growth or the survival of the affected mice. We have no certain explanation for the absence of clinical improvement, and believe that this requires further investigation. Previously TNF-α transgene has been shown to be exclusively expressed in CNS (Akassoglou et al., 1997; Probert et al., 1995), however, it is likely that overexpressed TNF-α can be transported through blood-brain barrier into the circulation. We speculate that brain overexpressed IGF-I does not effectively ameliorate both systemic and CNS TNF-α-induced damage. Nonetheless, our data clearly show that IGF-I overexpression can ameliorate TNF-α injury on oligodendrocytes and myelination in vivo, and our data support the potential for IGF-I in the therapy of demyelinating disorders.
Acknowledgments
The authors wish to thank Ms. Ana Rodriguez and Liqin Li for their technical support. This work was supported by NIH grants NS038891 and NS048868.
Footnotes
This work was supported by NIH grants NS038891 and NS048868.
References
- Abercrombie M. Estimation of nuclear population from microtome section. Anat Rec. 1946;94:274–329. doi: 10.1002/ar.1090940210. [DOI] [PubMed] [Google Scholar]
- Akassoglou K, Bauer J, Kassiotis G, Pasparakis M, Lassmann H, Kollias G, Probert L. Oligodendrocyte apoptosis and primary demyelination induced by local TNF/p55TNF receptor signaling in the central nervous system of transgenic mice - Models for multiple sclerosis with primary oligodendrogliopathy. Am J Pathol. 1998;153:801–813. doi: 10.1016/S0002-9440(10)65622-2. [DOI] [PMC free article] [PubMed] [Google Scholar]
- Akassoglou K, Probert L, Kontogeorgos G, Kollias G. Astrocyte-specific but not neuron-specific transmembrane TNF triggers inflammation and degeneration in the central nervous system of transgenic mice. J Immunol. 1997;158:438–445. [PubMed] [Google Scholar]
- Arnett HA, Mason J, Marino M, Suzuki K, Matsushima GK, Ting JP-Y. TNFα promotes prolifertion of oligodendrocyte progenitors and remyelination. Nature Neurosci. 2001;11:1116–1122. doi: 10.1038/nn738. [DOI] [PubMed] [Google Scholar]
- Bach MA, Shen-Orr Z, Lowe WL, Jr, Roberts CT, Jr, LeRoith D. Insulin-like growth factor I mRNA levels are developmentally regulated in specific regions of the rat brain. Mol Brain Res. 1991;10:43–48. doi: 10.1016/0169-328x(91)90054-2. [DOI] [PubMed] [Google Scholar]
- Baker J, Liu J-P, Robertson EJ, Efstratiadis A. Role of Insulin-like Growth Factors in embryonic and postnatal growth. Cell. 1993;75:73–82. [PubMed] [Google Scholar]
- Bartlett WP, Li X-S, Williams M. Expression of IGF-I mRNA in the murine subventricular zone during postnatal development. Mol Brain Res. 1992;12:285–291. doi: 10.1016/0169-328x(92)90131-t. [DOI] [PubMed] [Google Scholar]
- Carson MJ, Behringer RR, Brinster RL, McMorris FA. Insulin-like growth factor I increases brain growth and central nervous system myelination in transgenic mice. Neuron. 1993;10:729–740. doi: 10.1016/0896-6273(93)90173-o. [DOI] [PubMed] [Google Scholar]
- Chrysis D, Calikoglu AS, Ye P, D'Ercole AJ. Insulin-like growth factor-I overexpression attenuates cerebellar apoptosis by altering the expression of Bcl family proteins in a developmentally specific manner. J Neurosci. 2001;21:1481–1489. doi: 10.1523/JNEUROSCI.21-05-01481.2001. [DOI] [PMC free article] [PubMed] [Google Scholar]
- D'Souza S, Alinauskas K, McCrea E, Goodyer C, Antel JP. Differential susceptibility of human CNS-derived cell populations to TNF-dependent and independent immune-mediated injury. J Neurosci. 1995;15:7293–7300. doi: 10.1523/JNEUROSCI.15-11-07293.1995. [DOI] [PMC free article] [PubMed] [Google Scholar]
- Fushimi S, Shirabe T. Expression of insulin-like growth factors in remyelination following ethidium bromide-induced demyelination in the mouse spinal cord. Neuropathology. 2004;24:208–218. doi: 10.1111/j.1440-1789.2004.00561.x. [DOI] [PubMed] [Google Scholar]
- Gveric D, Cuzner ML, Newcombe J. Insulin-like growth factors and binding proteins in multiple sclerosis plaques. Neuropathol Appl Neurobiol. 1999;25:215–225. doi: 10.1046/j.1365-2990.1999.00187.x. [DOI] [PubMed] [Google Scholar]
- Komoly S, Hudson LD, Webster HD, Bondy CA. Insulin-like growth factor I gene expression is induced in astrocytes during experimental demyelination. Proc Natl Acad Sci USA. 1992;89:1894–1898. doi: 10.1073/pnas.89.5.1894. [DOI] [PMC free article] [PubMed] [Google Scholar]
- Liu X, Yao DL, Bondy C, Brenner M, Hudson L, Zhou J, Webster HdF. Atrstrocytes express insulin-like growth factor-I (IGF-I) and its binding protein, IGFBP-2, during demyelination induced by experimental autoimmune encephalomyelitis. Mol Cell Neuosci. 1994;5:418–430. doi: 10.1006/mcne.1994.1052. [DOI] [PubMed] [Google Scholar]
- Louis JC, Magal E, Takayama S, Varon S. CNTF protection of oligodendrocytes against natural and tumor necrosis factor-induced death. Science. 1993;259:689–692. doi: 10.1126/science.8430320. [DOI] [PubMed] [Google Scholar]
- Mason JL, Ye P, Suzuki K, D'Ercole AJ, Matsushima GK. Insulin-like growth factor-1 inhibits mature oligodendrocyte apoptosis during primary demyelination. J Neurosci. 2000;20:5703–5708. doi: 10.1523/JNEUROSCI.20-15-05703.2000. [DOI] [PMC free article] [PubMed] [Google Scholar]
- Matsuo A, Akiguchi I, Lee GC, McGeer EG, McGeer PL, Kimura J. Myelin degeneration in multiple system atrophy detected by unique antibodies. Am J Pathol. 1998;153:735–744. doi: 10.1016/S0002-9440(10)65617-9. [DOI] [PMC free article] [PubMed] [Google Scholar]
- Matsuo A, Lee GC, Terai K, Takami K, Hickey WF, McGeer EG, McGeer PL. Unmasking of an unusual myelin basic protein epitope during the process of myelin degeneration in humans: a potential mechanism for the generation of autoantigens. Am J Pathol. 1997;150:1253–1266. [PMC free article] [PubMed] [Google Scholar]
- Probert L, Akassoglou K, Pasparakis M, Kontogeorgos G, Kollias G. Spontaneous inflammatory demyelinating disease in transgenic mice showing central nervous system-specific expression of tumor necrosis factor α. Proc Natl Acad Sci USA. 1995;92:11294–11298. doi: 10.1073/pnas.92.24.11294. [DOI] [PMC free article] [PubMed] [Google Scholar]
- Roth GA, Spada V, Hamill K, Bornstein MB. Insulin-like growth factor I increases myelination and inhibits demyelination in cultured organotypic nerve tissue. Dev Brain Res. 1995;88:102–108. doi: 10.1016/0165-3806(95)00088-u. [DOI] [PubMed] [Google Scholar]
- Yao DL, Liu X, Hudson LD, Webster HD. Insulin-like growth factor I treatment reduces demyelination and up-regulates gene expression of myelin-related proteins in experimental autoimmune encephalomyelitis. Proc Natl Acad Sci USA. 1995;92:6190–6194. doi: 10.1073/pnas.92.13.6190. [DOI] [PMC free article] [PubMed] [Google Scholar]
- Ye P, Carson J, D'Ercole AJ. Insulin-like growth factor-I influences the initiation of myelination: studies of the anterior commissure of transgenic mice. Neurosci Lett. 1995a;201:235–238. doi: 10.1016/0304-3940(95)12194-3. [DOI] [PubMed] [Google Scholar]
- Ye P, Carson J, D'Ercole AJ. In vivo actions of insulin-like growth factor-I (IGF-I) on brain myelination: studies of IGF-I and IGF binding protein-1 (IGFBP-1) transgenic mice. J Neurosci. 1995b;15:7344–7356. doi: 10.1523/JNEUROSCI.15-11-07344.1995. [DOI] [PMC free article] [PubMed] [Google Scholar]
- Ye P, D'Ercole AJ. Insulin-like growth factor I (IGF-I) regulates IGF-I binding protein-5 gene expression in the brain. Endocrinology. 1998;139:65–71. doi: 10.1210/endo.139.1.5676. [DOI] [PubMed] [Google Scholar]
- Ye P, D'Ercole AJ. Insulin-like growth factor I protects oligodendrocytes from tumor necrosis factor-α-induced injury. Endocrinology. 1999;140:3063–3072. doi: 10.1210/endo.140.7.6754. [DOI] [PubMed] [Google Scholar]
- Ye P, Lee K-H, D'Ercole AJ. Insulin-like growth factor-I (IGF-I) protects myelination from undernutritional insult: Studies of transgenic mice overexpressing IGF-I in brain. J Neurosci Res. 2000;62:700–708. doi: 10.1002/1097-4547(20001201)62:5<700::AID-JNR9>3.0.CO;2-1. [DOI] [PubMed] [Google Scholar]
- Ye P, Li L, Richards RG, DiAugustine RP, D'Ercole AJ. Myelination is altered in insulin- like growth factor-I null mutant mice. J Neurosci. 2002;22:6041–6051. doi: 10.1523/JNEUROSCI.22-14-06041.2002. [DOI] [PMC free article] [PubMed] [Google Scholar]
- Ye P, Price W, Kassiotis G, Kollias G, D'Ercole AJ. Tumor necrosis factor-α (TNF-α) regulation of insulin-like growth factor-I (IGF-I), type 1 IGF receptor and IGF binding proteins (IGFBP) expression in the cerebellum of transgenic mice. J Neurosci Res. 2003;71:721–731. doi: 10.1002/jnr.10512. [DOI] [PubMed] [Google Scholar]
- Ye P, Xing Y, Dai Z, D'Ercole AJ. In vivo actions of insulin-like growth factor-I (IGF-I) on cerebellum development in transgenic mice: evidence that IGF-I increases proliferation of granule cell progenitors. Dev Brain Res. 1996;95:44–54. doi: 10.1016/0165-3806(96)00492-0. [DOI] [PubMed] [Google Scholar]
- Yi P, Cai Z, Rhodes PG. Effect of tumor necrosis factor-α on developing optic nerve oligodendrocytes in culture. J Neurosci Res. 2005;80:226–234. doi: 10.1002/jnr.20450. [DOI] [PubMed] [Google Scholar]
- Zhang JH, Whitehead RE, Jr, Underwood LE. Endocrinology. Vol. 138. 198. Effect of fasting on insulin-like growth factor (IGF)-IA and IGF- IB messenger ribonucleic acids and prehormones in rat liver; pp. 3112–3118. [DOI] [PubMed] [Google Scholar]