

Abstract
Vitamin E (tocopherols & tocotrienols) is essential for normal neurological function. Recently we have reported that the neuroprotective properties of tocotrienols are much more potent than that of the widely studied tocopherols (J Biol Chem. 275, 13049–13055). The objective of this study was to evaluate whether i) oral supplementation of tocotrienols during pregnancy is bioavailable to fetal and mother brains; ii) short-term change in dietary vitamin E levels of pregnant rats influences gene expression profile of developing fetal brains. We report that dietary tocotrienol is bioavailable to both mother and fetal brains. The enrichment is more in fetal brain tissue. Using a GeneChip microarray expression profiling approach we have identified a specific set of vitamin E sensitive genes in the developing rat fetal brain.
Keywords: fetus, pregnancy, diet, microarray, tocotrienol, tocopherol
1. INTRODUCTION
Vitamin E is essential for normal neurological function [1,2]. Based on symptoms of primary vitamin E deficiency, it has been demonstrated that vitamin E has a central role in maintaining neurological structure and function [2]. Most of the vitamin E-sensitive neurological disorders are associated with elevated levels of oxidative damage markers. This has led to the popular hypothesis stating that the neuroprotective effects of vitamin E are mediated by its antioxidant property [3]. Vitamin E is a generic term for all tocopherols and their derivatives having the biological activity of RRR-α-tocopherol [4,5]. In nature, eight substances have been found to have vitamin E activity: α-, β-, γ- and δ-tocopherol; and α-, β-, γ- and δ-tocotrienol. Often, the term vitamin E is synonymously used with α-tocopherol. While d-α-tocopherol (RRR-α-tocopherol) has the highest bioavailability and represents the standard against which all the others must be compared, it is only one out of eight natural forms of vitamin E.
Tocotrienols, formerly known as ζ, ε or η-tocopherols, are chemically similar to tocopherols except that they have an isoprenoid tail with 3 unsaturation points instead of a saturated phytyl tail. While tocopherols are predominantly found in corn, soybean and olive oils, tocotrienols are particularly rich in palm, rice bran and barley oils [4,5]. Tocotrienols have been long known to possess powerful antioxidant, anti-cancer and cholesterol-lowering properties. Tocotrienols are thought to have more potent antioxidant properties than α-tocopherol [6,7]. The unsaturated side chain of tocotrienol allows for more efficient penetration into tissues that have saturated fatty layers such as the brain and liver [8]. Superior antioxidant, free radical scavenging effects of tocotrienol compared to that of tocopherol appear to be due to their better distribution in the fatty layers of the cell membrane [8]. While tocotrienols have shown better beneficial effects than α-tocopherol in a limited number of situations indicated above, little is known about the exact mechanism of action. Micromolar amounts of tocotrienols, but not tocopherols, have been shown to suppress the activity of hydroxy-3-methylglutaryl coenzyme A reductase, the hepatic enzyme responsible for cholesterol synthesis [9,10]. We have observed that α-tocotrienol is much more potent than α-tocopherol in inhibiting glutamate-induced signal transduction pathways leading to neurodegeneration [11]. Previously it has been suggested that dietary α-tocotrienol does not reach the brain [12]. The objective of this study was two-fold. First, to confirm whether tocopherol and tocotrienol fed to pregnant rats reach the mother and fetal brains using a HPLC-CoulArray technique recently developed in our laboratory [13]. Second, we utilized a high-density oligonucleotide microarray approach to screen the developing (day 17th of gestation) fetal brain transcriptome for vitamin E sensitive genes.
2. MATERIAL AND METHODS
Animals and supplementation protocol
Pregnant (three-day) rats (10 wks old; Sprague Dawley; Harlan, Indianapolis, IN) were randomly divided into following two groups: i) E+ group –fed a standard rat chow that is enriched in α-tocopherol (~200 nmol/g diet). Additionally, this group was supplemented for 2 weeks with a daily gavage of tocotrienol rich fraction (TRF2) suspended in vitamin E-stripped corn oil (Harlan). A mixture of 110 mg α-tocopherol and 119 mg of α-tocotrienol contained in 1g TRF was fed to pregnant rats on a per kg bodyweight basis. TRF was provided in the form of Tocomin® 50% provided by Carotech Sdn Bhd (Perak, Malaysia); ii) E− group – fed a vitamin E deficient diet (TD88163, Harlan; α-tocopherol/tocotrienol levels below detection limits) and supplemented with a matched volume of vitamin E-stripped corn oil. All rats were maintained under standard conditions at 22 ± 2°C with 12:12 h dark : light cycles. All animal protocols were approved by the Institutional Laboratory Animal Care and Use Committee (ILACUC) of the Ohio State University, Columbus, OH. Sample collection. On 17th day of gestation, body weights of each rat were recorded. Rats were killed. Mother and fetal brains were removed, rinsed in ice-cold phosphate buffered saline, pH 7.4 (PBS) and snap frozen in liquid nitrogen. Samples were briefly stored in –80°C.
Vitamin E extraction and analysis
Vitamin E extraction and analysis from mother and fetal brains was performed as described previously using a HPLC-coulometric electrode array detector (Coularray Detector - model 5600 with 12 channels; ESA Inc., Chelmsford, MA) [13]. This system uses multiple channels with different redox-potentials. α-, γ- and δ-Tocopherols and tocotrienols were detected on channels set at 200 mV, 300 mV; and 400 mV, respectively.
Affymetrix GeneChip probe array analysis
Total RNA was extracted by pulverizing the fetal brains in liquid N2 followed by extraction using Trizol (Gibco BRL) [14,15]. A further clean up of RNA was performed using the RNeasy kit (Qiagen). Targets were prepared for microarray hybridization according to previously described protocols [14]. To assess sample quality the samples were hybridized for 16 hours at 45°C to GeneChip Test-2 arrays. Satisfactory samples were hybridized to Rat Genome arrays (U34A). The arrays were washed, stained with streptavidin-phycoerythrin and were then scanned with the GeneArray scanner (Agilent Technologies) in our facilities.
Raw data were collected and analyzed using Affymetrix Microarray Suite 4.0 (MAS) and Data Mining Tool 2.0 (DMT) software. The following two approaches were utilized to identify differentially expressed genes: i) using Comparison Analysis in MAS, six pair-wise comparisons were generated from replicates of both E+ and E− groups. Average fold-changes were calculated for both up- or down-regulated genes. Genes for which the concordance exceeded 50% in pairwise comparisons were selected, especially if the gene was detected with redundant probe sets; ii) T-test was performed using DMT, and genes that significantly (p<0.05) changed (increased or decreased) in the E+ group compared to the E− group were selected. The average difference values of selected genes were loaded into the Cluster & TreeView software [16]. The data was adjusted according to the median center for a clear graphic display of vitamin E sensitive genes.
Reverse-transcription and polymerase chain reaction (RT-PCR)
Expression levels of heme oxygenase 3 (HO-3), cyclin D1, high mobility group protein 2 (HMG-2), nucleolar phosphoprotein p130 (NOPP140) and glyceraldehydes-3-phosphate dehydrogenase (GAPDH) mRNA were independently determined using RT-PCR as described previously [17]. In brief, the total RNA (1 μg) was transcribed into cDNA using oligo-dT primer and Superscript II. RT-generated cDNA were amplified by PCR using gene specific primers as described in Table 1. PCR reaction products were electrophoresed in a 1% agarose gel containing 0.25 μg /ml ethidium bromide. The gel was digitally imaged under conditions of ultraviolet transillumination. Quantification of band intensity was performed using the Scion Image (Scion Corporation) that is based on NIH Image software.
Table 1.
Primers used for RT-PCR.
| mRNA | Primer Sequence 5' to 3' |
|---|---|
| CyclinD1 | CTG CAT GTT CGT GGC CTC TAA GAT
CCA GAA GGG CTT CAA TCT GTT CCT |
| GAPDH | TAT GAC TCT ACC CAC GGC AAG TTC A
CAG TGG ATG CAG GGA TGA TGT TCT |
| HMG2 | TCC TCC CAA AGG TGA TAA GAA AGG A
TGG CAC GGT ATG CAG CAA TA |
| HO-3 | ATG GCA TCA GAG AAG GAA AAC CAT T
CCC ATC AAG TAT TGA GAG CCC ATT C |
| NOPP140 | TCA GTG CCA CCA AGA GTC CCT TAA
CTT CTT CAC TGG AAT CTT CGG AGG A |
3. RESULTS
Vitamin E levels in mother & fetal brains
α-Tocopherol level in the fetal brain was multi-fold lower than that observed in the mother brain (Figure 1A). Compared to E+ group, feeding a vitamin E deficient diet for only 2 weeks during pregnancy did not significantly decrease the α-tocopherol levels in the adult mother brain. However, under similar conditions, feti from the mothers of E− group had significantly lower α-tocopherol levels in brain compared to the feti from E+ group (Figure 1A). α-Tocotrienol was below detection limits in the brains of mothers as well as feti of the E− group. Oral supplementation of TRF for 2 weeks to mothers during pregnancy resulted in delivery of α-tocotrienol to the mother as well as fetal brains. Importantly, incorporation of tocotrienol in the fetal brain was significantly higher compared to that in the mother brain (Figure 1B). Of interest, short-term vitamin E deficiency in pregnancy diet did not influence vital statistics of pups such as weight or general health (our unpublished observations).
Figure 1. Vitamin E levels in fetal and mother rat brains.

Pregnant (three-day) rats were randomly divided into i) E+ group –fed a standard rat chow that is enriched in α-tocopherol. Additionally, this group was supplemented for 2 weeks with a daily gavage of TRF suspended in vitamin E-stripped corn oil; and ii) E− group – fed a vitamin E deficient diet and supplemented with a matched volume of vitamin E-stripped corn oil. On 17th day of gestation, brains were collected and vitamin E analysis was performed using HPLC. *, p<0.05 significantly different compared to the E+ group. #, p<0.05 significantly different compared to mother brain. n.d, not detected
Transcriptome profiling
The transcriptomes of developing fetal brains from E+ and E− groups (n=3 in each) were compared using the U34A rat genome high-density oligonucleotide GeneChip array. This array analyzes approximately 7,000 full-length sequences and approximately 1,000 EST clusters. Using raw data from all replicates available from both groups, a total of six pair-wise comparisons were generated. The average (six pair-wise comparisons) fold-changes of all the genes that were differentially expressed were calculated. Data indicated that a majority of genes remained unchanged (Figure 2). A total of 645 (7.3%) genes were up-regulated in vitamin E+ group compared to the E− group. Out of which 416 genes increased by a magnitude of 2-fold or more. On the other hand 152 (1.7%) of the genes were down-regulated with 74 of them lowered by 2-fold or more (Figure 2). Using the t-test analysis (see Material and methods for details), a total 144 genes were observed to have changed significantly (p<0.05) in vitamin E deficiency group compared to the supplemented group. The data was adjusted according to the median center for a clear graphic display of vitamin E sensitive genes (Figures 3A & 3B). Next, genes for those the concordance exceeded 50% in pair-wise comparisons were selected, especially if the gene was detected with redundant probe sets. Using this approach of data analysis, a total of 19 probe-sets were found to be up-regulated and 34 repressed in E+ group compared to E− group (Tables 2 & 3). Among the up-regulated genes, two probe sets targeting heme oxygenase-3 (HO-3) were increased by 3.9 and 3.1 folds, respectively (Figure 4). In contrast, the expression of maspin, glyceraldehyde-3-phosphate-dehydrogenase (GAPDH), apolipoprotein B (apoB) and G protein beta1 subunit (rGb1) genes was highly (3–5 folds) repressed in response to dietary vitamin E.
Figure 2. Range of the average fold changes of differentially expressed genes in E+ and E− groups.
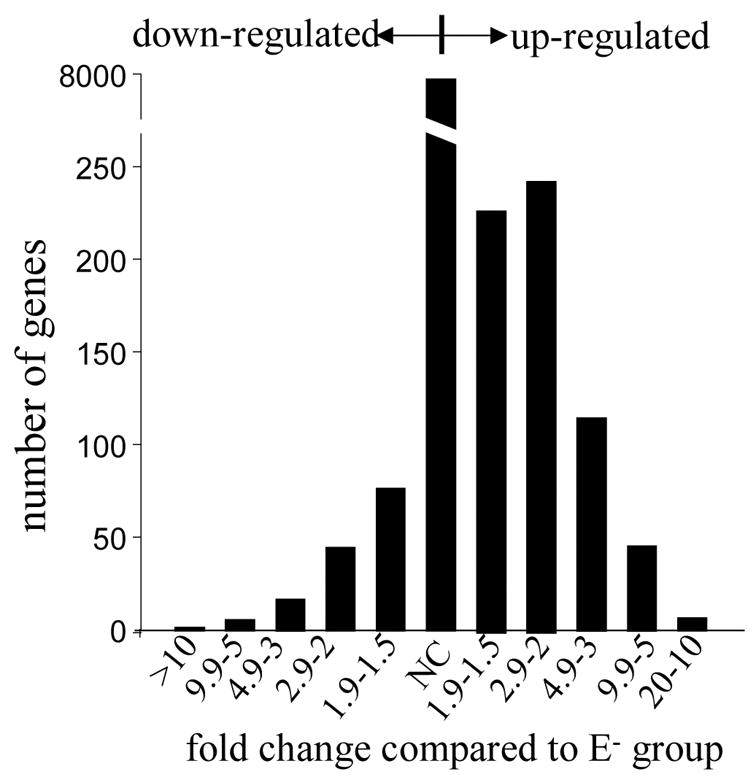
Six pair-wise comparisons were generated from replicates of both E+ and E− groups using Comparison Analysis in MAS. Average fold changes were calculated for both up- or down regulated genes.
Figure 3. Cluster image illustrating the genes differentially expressed in fetal brains of E+ group.


For a clear graphic display of vitamin E sensitive genes, T-test was performed on replicate samples of E+ group (animal #7, #10, #11) and E− group (animal # 12 and #13) that significantly (p<0.05) changed (increase or decrease) in the E+ group as compared to the E− group were selected. The average difference values of selected genes were loaded into the Cluster & TreeView software where the data was adjusted according to the median center. Red to green gradation in color represent higher to lower expression signal compared to median center. In some cases due to very high expression levels the signal is saturated and shows red in all samples. The scale is adjustable. A medium intensity (not optimal for all data presented) scale is shown. For details of vitamin E feeding and tissue collection, see legend of Figure 1. A) upregulated; or B) down-regulated genes in E+ group compared to E− group.
Table 2.
Genes up-regulated in fetal brains of E+ group1.
| Affymetrix Accession Number | Description |
|---|---|
| M13100cds#1_at | Heme oxygenase 3 or RATLIN3A |
| X05472cds#2_at | RNREP24R Rat 2.4 kb repeat DNA right terminal region |
| X07686cds_s_at | Rat L1Rn B6 repetitive DNA element |
| M13100cds#1_g_at | Heme oxygenase 3 or LINE3 (L1Rn) |
| rc_AA800912_g_at | GTF2I repeat domain-containing 1 putative ortholog |
| rc_AA924591_at | Cyp4a locus, encoding cytochrome P450 (IVA3) |
| X62951mRNA_s_at | mRNA (pBUS19) with repetitive elements |
| rc_AI231445_at | unr protein |
| rc_AA852046_s_at | VL30 element mRNA |
| AB010154_at | PKN mRNA for serin/threonine protein kinase expressed in hippocampus |
| rc_AI231257_at | Cyclin D1 |
| X53581cds#3_f_at | long interspersed repetitive DNA containing 7 ORFs |
| AF055714UTR#1_at | hypertension-regulated vascular factor-1C-4 |
| X05472cds#3_f_at | RNREP24R Rat 2.4 kb repeat DNA right terminal region |
| S76466_at | type I serine-threonine kinase receptor |
| S78556_at | grp75=75 kda glucose regulated protein |
| rc_AA998882_s_at | nucleolar phophoprotein p130 (NOPP140) |
| D84418_r_at | chromosomal protein HMG2 |
| U35244_g_at | vacuolar protein sorting homolog r-vps33a |
Six pairwise comparisons among brains obtained from individual fetus, the mothers of whom were fed vitamin E+ and vitamin E− diet during pregnancy for 2 wks. Genes for those the concordance exceeded 50% in pair-wise comparisons were selected, especially if the gene was detected with redundant probe sets. ESTs for which no description is available were excluded.
Table 3.
Genes down-regulated in fetal brains of E+ group1.
| Affymetrix Accession Number | Description |
|---|---|
| U58857_at | maspin |
| AFFX_Rat_GAPDH_M_st | glyceraldehyde-3-phosphate-dehydrogenase (GAPDH) |
| M27440_at | apolipoprotein B (apoB) |
| U88324_g_at | G protein beta1 subunit (rGb1) |
| AFFX_Rat_beta-actin_3_st | cytoplasmic beta-actin |
| rc_AI045858_at | Weakly similar to T14794 hypothetical protein DKFZp586P1522 |
| rc_AI008852_at | eukaryotic translation elongation factor |
| U46118_at | cytochrome P450 3A9 |
| L27112_s_at | stress activated protein kinase alpha II |
| rc_AA965261_at | H2A histone family, member Y |
| AF091563_r_at | QIL-LD1 olfactory receptor |
| AB013454_at | NaPi-2 beta |
| M27467_at | cytochrome oxidase subunit VIc (COX-VIc) |
| U50412_at | phosphoinositide 3-kinase regulatory subunit p85alpha |
| U88324_at | G protein beta1 subunit (rGb1) |
| M32474_at | carcinoembryonic antigen-related protein (CGM1) |
| AF037071_at | carboxyl-terminal PDZ ligand of neuronal nitric oxide synthase |
| AB010436_at | cadherin-8 |
| L03386_i_at | zinc finger protein |
| rc_AI072341_at | vacuolar protein sorting homolog r-vps33b |
| rc_AI073204_at | tyrosine 3-monooxygenase/tryptophan 5-monooxygenase activatioprotein |
| rc_AI103498_at | ribosomal protein L5 |
| D16308_at | cyclin D2 |
| rc_H31847_at | dynein light intermediate chain |
| D17521_at | protein kinase C-regulated chloride channel |
| D90038_at | 70-kDa peroxisomal membrane protein (PMP70) |
| rc_AI171630_s_at | p38 mitogen activated protein kinase |
| AF083330_at | kinesin-like protein KIF3C (KIF3C) |
| M65251_s_at | Rat angiotensinogen gene-inducible enhancer-binding protein 1 |
| rc_AA892378_at | AF151893 1 CGI-135 protein |
| rc_AA800194_at | similar to T08812 probable succinate-CoA ligase |
| AF090867_g_at | guanosine monophosphate reductase mRNA |
| D14045_s_at | DNA topoisomerase IIA |
| rc_AI179150_s_at | CDK110 |
Six pairwise comparisons among brains obtained from individual fetus, the mothers of whom were fed vitamin E+ and vitamin E− diet during pregnancy for 2 wks. Genes for those the concordance exceeded 50% in pair-wise comparisons were selected, especially if the gene was detected with redundant probe sets. ESTs for which no description is available were excluded.
Figure 4. RT-PCR validation of GeneChip microarray expression analysis.
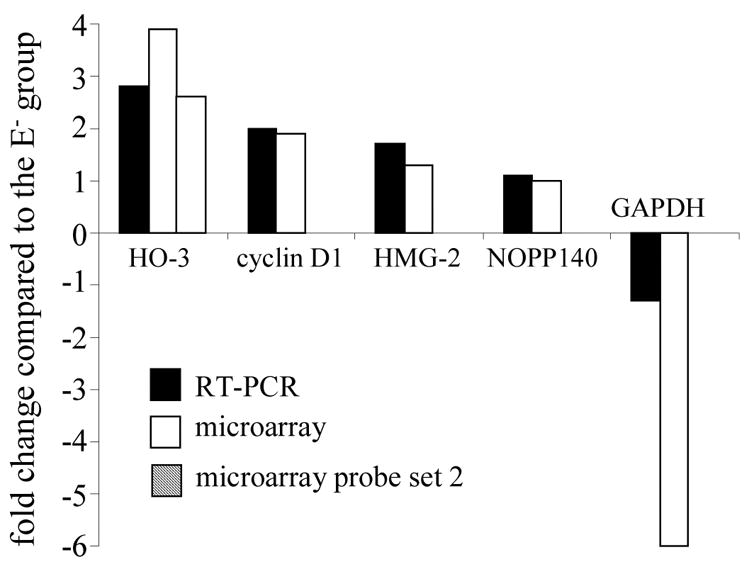
Expression levels of were independently determined using RT-PCR. The following genes identified as differentially expressed in E+ group compared to E− group using GeneChip microarray analysis were verified using RT-PCR: heme oxygenase 3 (HO-3), cyclin D1, HMG-2, NOPP140 and GAPDH. The band intensity of the PCR products was quantified and fold change for each gene in E+ group compared to E− group was calculated (solid bars). For comparison, fold changes observed in the expression of a specific gene using GeneChip microarray analysis (one or more probe sets) was also plotted (empty and hatched bars).
Validation of GeneChip data using RT-PCR
Select vitamin E sensitive genes identified by the GeneChip approach were verified using conventional semi-quantitative RT-PCR (Figure 4). The band intensity of the PCR products was quantified and fold change for each gene in E+ group compared to E− group was calculated. Data showed that fold change detected using both GeneChip or RT-PCR approaches for genes up-regulated E+ vs E− groups were comparable (Figure 4). For GAPDH, both microarray as well as RT-PCR data indicated a decrease in expression in E+ group compared to E− group. However, the fold-change in GAPDH expression was much higher in the microarray data compared to the RT-PCR data (Figure 4).
4. DISCUSSION
We present first evidence showing that consumption of a vitamin E deficient diet for only 2 weeks during pregnancy can substantially lower the vitamin E levels of fetal brain while not affecting the vitamin E levels of adult brain underscoring the importance of proper levels of this vitamin in the diet during pregnancy. Compared to an adult brain, a higher uptake of the α-tocotrienol form of vitamin E by fetal brain was also observed. Results of this study provides the first global assessment of vitamin E sensitive genes in a developing fetal brain. Of the 8000 genes surveyed, only 17 genes displayed an increase in gene expression levels in fetal brain as a result of vitamin E feeding to mothers, whereas 34 displayed a decrease in expression indicating that a highly specific set of genes are sensitive to the vitamin E levels in a developing fetal brain.
Based on symptoms of primary vitamin E deficiency in adults, it has been demonstrated that vitamin E has a central role in maintaining neurological structure and function [2]. However, efforts to systematically evaluate the molecular basis of vitamin E action on the brain are lacking. Our data show that α-tocopherol level in the fetal brain was multi-folds lower than that observed in the mother brain. This data is in accordance with a previous study where α-tocopherol levels in fetal brain were lower compared to that of the brains of 21-day old rats [18]. Furthermore, in humans, the serum α-tocopherol levels in full-term neonates are known to be several folds lower (0.212+/−0.127 vs 1.160+/−0.513 mg/dL) compared to that of their mothers [19]. We have previously shown that compared to α-tocopherol, tocotrienols are markedly more potent in protecting neuronal cells against glutamate-induced degeneration [11]. However, in vivo data demonstrating the availability of dietary tocotrienols in the brain was lacking. The present study provide first evidence that dietary supplementation of TRF during pregnancy leads to a significant enrichment of α-tocotrienol in both maternal and fetal brains. Dietary vitamin E is absorbed in the intestine and carried by lipoproteins to the liver. In the liver, the α-tocopherol fraction is incorporated into VLDL by a α-tocopherol transfer protein and then secreted into the bloodstream [20]. A recent study shows that scavenger receptor class B type I (SR-BI), which mediates cellular selective cholesteryl ester uptake from lipoproteins, facilitates efficient transfer of α-tocopherol from HDL to cultured cells [21]. Furthermore, in SR-BI-deficient mutant mice, relative to wild-type control animals, there was a significant increase in plasma α-tocopherol levels (1.1- to 1.4-fold higher) that was mostly due to the elevated α-tocopherol content of their abnormally large plasma HDL-like particles [21]. Mechanisms of uptake and transport of tocotrienols in organs and tissues are poorly understood in adults and more so in fetal tissues.
HO-3 was one of the few vitamin E sensitive genes up-regulated in fetal brains. Heme oxygenase isozymes, HO-1, HO-2 and HO-3, are HSP32 protein cognates with a known function of catalyzing the isomer-specific oxidation of the heme molecule, including that of NO synthase [22]. HO-1 is highly inducible, whereas HO-2 and HO-3 are constitutively expressed. These proteins play a central role in the cellular defense mechanisms. HO activity is responsible for the production of equimolar amounts of CO, biliverdin and free Fe [22,23]. Recent findings with the hemeoxygenases suggest that these proteins may serve as an intracellular "sink" for NO [24]. LINE1 was identified to be another vitamin E sensitive transcript. The LINE-1, or L1 family of interspersed repeats accounts for at least 10% of the mammalian genome. Like other interspersed repeat DNA families in genomes of other organisms, L1 is dispersed and amplified throughout the genome by a series of duplicative transposition events. Due to the high copy number of L1 sequences in the genome, L1 is abundantly represented in the RNA population of most cells. However, most of the transcripts that contain L1 are the result of fortuitous transcription and are not intermediates in L1 retrotransposition. This high background of L1-containing transcripts, many of which are truncated and rearranged, makes it difficult to distinguish the transcript encoded by an active L1 element(s) [25]. ApoB mRNA was one of top candidates that were lower in E+ group compared to the E− fetal group. ApoB plays a central role in lipoprotein metabolism and exists in 2 isoforms in plasma, apoB-100 and apoB-48 [26]. High levels of apoB and LDL cholesterol have been associated with an increased risk for coronary heart disease [27]. An earlier study has shown that administration of TRF (100 mg/day) decreases serum apoB [28]. Tocopherol has been shown to inhibit PKC activity in cells [29]. Protein kinase C-regulated chloride channel was one of the genes that was observed to be suppressed in the E+ group.
Taken together, these results provide evidence that compared to the adult brain, fetal brain is deficient in vitamin E and that fetal brain vitamin E status is tightly linked to the dietary vitamin E intake of the mother. Dietary tocotrienol is bioavailable to the brain. Gene expression patterns in response to dietary vitamin E suggest that vitamin E in pregnancy diet favorably influences the gene expression profile of the developing fetal brain.
Acknowledgments
Supported by NIH RO1NS42617 to CKS. The Laboratory of Molecular Medicine is the research wing of the Center for Minimally Invasive Surgery. SR and BL equally contributed to this work and should therefore be credited as joint first authors.
Abbreviations
- apoB
apolipoprotein B
- CO
carbon monoxide
- DMT
Data Mining Tool 2.0
- GAPDH
glyceraldehyde-3-phosphate-dehydrogenase
- HO
hemeoxygenase
- HMG2
high mobility group protein 2
- HSP
heat shock protein
- MAS
Affymetrix Microarray Suite 4.0
- NO
nitric oxide
- NOPP140
nuclear phosphoprotein p130
- PKC
protein kinase C
- RT-PCR
reverse-transcription-polymerase chain reaction
- TRF
tocotrienol rich fraction
References
- 1.Muller DP, Goss-Sampson MA. Ann N Y Acad Sci. 1989;570:146–155. doi: 10.1111/j.1749-6632.1989.tb14915.x. [DOI] [PubMed] [Google Scholar]
- 2.Muller DP, Goss-Sampson MA. Crit Rev Neurobiol. 1990;5:239–263. [PubMed] [Google Scholar]
- 3.Vatassery GT. Geriatrics. 1998;53(Suppl 1):S25–S27. [PubMed] [Google Scholar]
- 4.Traber MG, Packer L. Am J Clin Nutr. 1995;62:1501S–1509S. doi: 10.1093/ajcn/62.6.1501S. [DOI] [PubMed] [Google Scholar]
- 5.Traber MG, Sies H. Annu Rev Nutr. 1996;16:321–347. doi: 10.1146/annurev.nu.16.070196.001541. [DOI] [PubMed] [Google Scholar]
- 6.Serbinova E, Kagan V, Han D, Packer L. Free Radic Biol Med. 1991;10:263–275. doi: 10.1016/0891-5849(91)90033-y. [DOI] [PubMed] [Google Scholar]
- 7.Serbinova EA, Packer L. Meth Enzymol. 1994;234:354–366. doi: 10.1016/0076-6879(94)34105-2. [DOI] [PubMed] [Google Scholar]
- 8.Suzuki YJ, Tsuchiya M, Wassall SR, Choo YM, Govil G, Kagan VE, Packer L. Biochemistry. 1993;32:10692–10699. doi: 10.1021/bi00091a020. [DOI] [PubMed] [Google Scholar]
- 9.Pearce BC, Parker RA, Deason ME, Dischino DD, Gillespie E, Qureshi AA, Volk K, Wright JJ. J Medicinal Chem. 1994;37:526–541. doi: 10.1021/jm00030a012. [DOI] [PubMed] [Google Scholar]
- 10.Pearce BC, Parker RA, Deason ME, Qureshi AA, Wright JJ. J Medicinal Chem. 1992;35:3595–3606. doi: 10.1021/jm00098a002. [DOI] [PubMed] [Google Scholar]
- 11.Sen CK, Khanna S, Roy S, Packer L. J Biol Chem. 2000;275:13049–13055. doi: 10.1074/jbc.275.17.13049. [DOI] [PubMed] [Google Scholar]
- 12.Podda M, Weber C, Traber MG, Packer L. J Lipid Res. 1996;37:893–901. [PubMed] [Google Scholar]
- 13.Roy S, Venojarvi M, Khanna S, Sen CK. Meth Enzymol. 2002;352:326–332. doi: 10.1016/s0076-6879(02)52029-2. [DOI] [PubMed] [Google Scholar]
- 14.Roy S, Khanna S, Bentley K, Beffrey P, Sen CK. Meth Enzymol. 2002;353:487–497. doi: 10.1016/s0076-6879(02)53071-8. [DOI] [PubMed] [Google Scholar]
- 15.Khanna S, Roy S, Bagchi D, Bagchi M, Sen CK. Free Radic Biol Med. 2001;31:38–42. doi: 10.1016/s0891-5849(01)00544-5. [DOI] [PubMed] [Google Scholar]
- 16.Eisen MB, Spellman PT, Brown PO, Botstein D. Proc Natl Acad SciUSA. 1998;95:14863–14868. doi: 10.1073/pnas.95.25.14863. [DOI] [PMC free article] [PubMed] [Google Scholar]
- 17.Sen CK, Khanna S, Venojarvi M, Trikha P, Ellison EC, Hunt TK, Roy S. Am J Physiol - Heart Circ Physiol. 2002;282:H1821–H1827. doi: 10.1152/ajpheart.01015.2001. [DOI] [PubMed] [Google Scholar]
- 18.Amusquivar E, Ruperez FJ, Barbas C, Herrera E. J Nutr. 2000;130:2855–2865. doi: 10.1093/jn/130.11.2855. [DOI] [PubMed] [Google Scholar]
- 19.Wu SC, Chou YH. Chang Gung Med J. 2001;24:793–798. [PubMed] [Google Scholar]
- 20.Traber MG, H A. Annu Rev Nutr. 1999;19:343–355. doi: 10.1146/annurev.nutr.19.1.343. [DOI] [PubMed] [Google Scholar]
- 21.Mardones P, et al. J Nutr. 2002;132:443–449. doi: 10.1093/jn/132.3.443. [DOI] [PubMed] [Google Scholar]
- 22.Maines MD, Panahian N. Adv Exp Med Biol. 2001;502:249–272. doi: 10.1007/978-1-4757-3401-0_17. [DOI] [PubMed] [Google Scholar]
- 23.Maines MD. Annu Rev Pharmacol Toxicol. 1997;37:517–554. doi: 10.1146/annurev.pharmtox.37.1.517. [DOI] [PubMed] [Google Scholar]
- 24.Ding Y, McCoubrey WKJ, Maines MD. Eur J Biochem. 1999;264:854–861. doi: 10.1046/j.1432-1327.1999.00677.x. [DOI] [PubMed] [Google Scholar]
- 25.Kolosha VO, Martin SL. J Biol Chem. 1995;270:2868–2873. doi: 10.1074/jbc.270.6.2868. [DOI] [PubMed] [Google Scholar]
- 26.Young SD. Circulation. 1990;82:1574–1594. doi: 10.1161/01.cir.82.5.1574. [DOI] [PubMed] [Google Scholar]
- 27.Stokes JI, Chenille WM, Wolf PA, Cupples LA, D'Agostino RB. Circulation. 1987;75:65–73. [PubMed] [Google Scholar]
- 28.Qureshi AA, Sami SA, Salser WA, Khan FA. Atherosclerosis. 2002;161:199–207. doi: 10.1016/s0021-9150(01)00619-0. [DOI] [PubMed] [Google Scholar]
- 29.Ricciarelli R, Tasinato A, Clement S, Ozer NK, Boscoboinik D, Azzi A. Biochem J. 1998;334:243–249. doi: 10.1042/bj3340243. [DOI] [PMC free article] [PubMed] [Google Scholar]