

Abstract
In the process of protein synthesis, the small (40S) subunit of the eukaryotic ribosome is recruited to the capped 5′ end of the mRNA, from which point it scans along the 5′ untranslated region in search of a start codon. However, the 40S subunit alone is not capable of functional association with cellular mRNA species; it has to be prepared for the recruitment and scanning steps by interactions with a group of eukaryotic initiation factors (eIFs). In budding yeast, an important subset of these factors (1, 2, 3, and 5) can form a multifactor complex (MFC). Here, we describe cryo-EM reconstructions of the 40S subunit, of the MFC, and of 40S complexes with MFC factors plus eIF1A. These studies reveal the positioning of the core MFC on the 40S subunit, and show how eIF-binding induces mobility in the head and platform and reconfigures the head–platform–body relationship. This is expected to increase the accessibility of the mRNA channel, thus enabling the 40S subunit to convert to a recruitment-competent state.
Keywords: posttranscriptional gene expression, protein synthesis, ribosome structure
Elucidation of the mechanisms underlying ribosome function and protein synthesis remains one of the major challenges of molecular biology. Recent progress in structural analysis of bacterial ribosomes has provided insight into the likely modes of action of core functional centers, including those for decoding and peptidyl transferase, and the tRNA-binding sites (1). Analogous core structural features are clearly shared by the eukaryotic counterpart, but there is much less structural and mechanistic information available that is specific to the eukaryotic ribosome. This limits our understanding of the process of translation initiation, the step where major differences between the prokaryotic and eukaryotic systems are evident (2).
The small ribosomal subunit in both prokaryotes (30S) and eukaryotes (40S) is responsible for controlling base pairing between the tRNA anticodon and each mRNA codon during protein synthesis. However, unlike its prokaryotic (30S) counterpart, the eukaryotic 40S subunit does not locate directly to the position of the mRNA AUG codon where protein synthesis begins. Instead, recruitment onto cellular mRNAs generally occurs via the capped 5′ end. Because the AUG start codon can be located many hundreds of nucleotides downstream, the 40S subunit then has to translocate to reach the initiation site (3) [see supporting information (SI) Fig. 5]. During this processive, sequence-independent scanning phase, the 40S subunit manifests some characteristics that appear to be similar to those of a molecular motor (2, 4).
The eukaryotic 40S subunit alone is incapable of stable recruitment onto the capped 5′ ends of cellular mRNA molecules. Its role in translation initiation depends on a large number of eukaryotic initiation factors [the eIFs (5)]. According to the current classification, 11 distinct eIFs (including eIF2B, a guanine nucleotide exchange factor) are involved in (steady-state) translation initiation. There has been considerable progress in recent years in understanding the functions of the individual eIFs, although much remains to be learned about their contributions to the mechanism and control of the initiation pathway in vivo. Binding of the ternary complex (comprising Met-tRNAiMet, eIF2, and GTP) to the 40S subunit is stabilized by eIF1A and eIF3 (6). Because eIF3 can bind to both eIF2 and the 4G component of the cap-binding complex eIF4F, it promotes recruitment of mRNA to 40S (5). Genetic experiments in yeast have indicated that eIF1, eIF2, and eIF5 influence start codon selection (7), whereas in vitro biochemical experiments have shown that eIF1 and eIF1A play roles in scanning and formation of the 48S complex, which comprises 40S, the eIFs, and mRNA (8, 9). A growing body of evidence indicates that, at least in budding yeast, eIF1, eIF2, eIF3, and eIF5 may bind to the 40S subunit as a preformed multifactor complex (MFC) (10). Thus the MFC components, together with eIF1A, play a key role in 40S-mRNA recruitment, scanning of the 5′ untranslated region, and start codon recognition (6, 10–12) (see SI Fig. 5).
In this article, we address the question how the ribosomal 40S subunit becomes rendered competent for translation initiation as the result of association with the eIFs. We have applied cryoelectron microscopy to this problem, with the intent of gaining insight into any changes in 40S conformation that might explain its conversion to an initiation-competent state. The results indicate that eIF-dependent reconfiguration of the 40S subunit domains facilitates efficient access of cellular mRNAs to the mRNA channel, thus promoting the process of translation initiation.
Results
To perform the structural analyses described in this article, we generated highly purified preparations of 40S subunits and of eIFs (Fig. 1A). These components were used to prepare 40S–eIF preinitiation complexes (see Fig. 1 B–D and Table 1). Like 40S subunits, the 40S–MFC complex (hereafter referred to as the 43S complex) ran as a single peak during analytical ultracentrifugation (Fig. 1C), consistent with low heterogeneity in the preparation. The cryo-EM reconstruction of the yeast 40S subunit at 19-Å resolution (Fig. 2A, SI Fig. 6, and Table 1; see Materials and Methods for definition of resolution) shows good agreement with the small subunit within the previously published map of the yeast 80S ribosome filtered to a comparable resolution (14) (SI Fig. 6) and with the atomic model of the yeast subunit generated by Frank and colleagues (13) (Fig. 2 A and B and SI Fig. 6). Modest changes in the relative arrangement of the head, body, and platform are however apparent (Fig. 2 A and B), as expected when comparing the small subunit with the 80S ribosome (14). Of the four connections between the head, platform, and body domains of the subunit (Fig. 2B), the strongest is between the head and the platform/body junction just above rpS0A and close to the fitted position of RNA helices 1/2 and 28. The latter form the covalent head/body link. The noncovalent links observed include the interaction between RNA helices 18 and 34 and a weaker interaction between rpS5 and rpS14, which form the mRNA exit channel. The most obvious difference in the arrangement of the head, body, and platform in the isolated subunit compared with the subunit within the 80S ribosome is a raising of the head (by ≈10 Å) above the body/platform, resting on the noncovalent interactions just discussed (SI Fig. 6B). Fig. 2C shows the 40S reconstruction with its head and platform/body surfaces rendered in different colors to assist in the interpretation of the data described below.
Fig. 1.

Preparation and hydrodynamic behavior of 40S complexes (see SI Materials and Methods for full details). (A) eIFs, 40S, and 40S-MFC (43S) complex loaded onto an SDS/PAGE gradient gel. A few of the eIF proteins show very similar electrophoretic behavior to 40S proteins and thus generate multiple bands (marked by asterisks) in the 43S lane. The 43S complex loaded here was isolated as fractions (see vertical dotted lines in B) from a sucrose-density gradient. (B) A 254-nm absorbance elution profile from a sucrose-density gradient; the presence of the eIFs in the 43S sucrose-gradient peak was routinely confirmed by means of Western blotting using the antibodies defined in SI Materials and Methods. (C) The 40S (gray, circles) and the 43S complex (red, diamonds) were subjected to sedimentation velocity analytical ultracentrifugation, yielding apparent sedimentation coefficient distributions. These were fitted with Gaussian equations (lines), giving sedimentation coefficients of 36.4S for the small subunit and 41.5S for the preinitiation complex. Corrected for finite solute and solvent effects on the basis that the small subunit value is 40S, the preinitiation complex value becomes 45.6S. (D) Assembly of complexes between 40S and MFC eIFs. PhosphorImages of native gels loaded with 40S–eIF complexes incorporating [35S]Met-tRNAi and GMP-PNP. The addition of eIF3 leads to a shift in the ribosome complex band (left-hand side). The further addition of eIF5B and the 60S subunit led to a further shift, associated with the formation of 80S (right-hand side). (E) A typical experiment following the kinetics of methionyl-puromycin synthesis by 80S complexes prepared by using the components shown in A plus 60S, eIF5B, methionyl-tRNAi, and GTP (instead of GMP-PNP). A PhosphorImage of samples from a typical experiment that were allowed to run on cation exchange TLC is shown. (F) Time course of formation of the 35S-labeled methionyl-puromycin product, taking the samples featured in E plotted against time. The y axis is calibrated in relative signal intensity. Also plotted are data from an experiment in which eIF5B was omitted.
Table 1.
Complexes studied by cryoEM in this work
| Complex name | Components | Resolution, Å | Particles imaged | Mw, kDa |
|---|---|---|---|---|
| 40S | 40S | 19 | 6,267 | 1,400 |
| MFC | Met-tRNAi.eIF2.GMP-PNP, eIF3, eIF5 | 14 | 19,946 | 556 |
| 43S | Met-tRNAi.eIF2.GMP-PNP, eIF3, eIF1, eIF1A, 40S | 20 | 31,756 | 1,941 |
Molecular masses of the component eIFs are (in kDa): eIF1, 12.3; eIF1A, 17.4; eIF2, 124.2; eIF3, 361.9; and eIF5, 45.2.
Fig. 2.

Cryo-EM density maps of the 40S subunit and MFC. (A) The 40S subunit reconstruction (6,267 particles; resolution 19 Å) contoured at 1.5σ in three orientations, with the atomic coordinates of the yeast 40S subunit (14) fitted: head rRNA, blue; platform, green; body, red; and helix 44, cyan. The small subunit proteins are shown in magenta. Three orthogonal views about axes as marked are shown, and major structural landmarks are labeled. (B) Close-up, sectioned views of the head–body/platform connections at a contour level of 1.5σ in the same orientations and with the same color scheme as in A (thumbnail images indicate the directions of view). (C) Views of the 40S subunit reconstruction after computational segmentation, with the density for head colored blue and the platform and body together colored yellow. (Scale bar, 50 Å.) (D) Orthogonal views of the MFC reconstruction (19,446 particles, 14-Å resolution). The scale is identical to that of A and C. (Scale bar, 50 Å.)
A reconstruction (14-Å resolution; see SI Materials and Methods and Table 1) was also obtained for the complex of eIF2, eIF3, and eIF5 (Fig. 2D), which is equivalent to the MFC lacking eIF1. This MFC subcomplex was chosen because we observed that eIF1 (by far the smallest component of the MFC) was substoichiometric in our standard MFC preparations, as was previously noted for MFC complexes isolated directly from yeast extracts (10) (Fig. 1A). The reconstruction (Fig. 2D) confirms that these eIFs form a stable core complex, which comprises two ellipsoidal lobes of density oriented perpendicularly to one another and assists in our interpretation of the 43S reconstruction.
A number of analytical methods were used to follow the assembly of complexes of 40S with different combinations of eIFs. One approach was to include [35S]methionyl-tRNAi, so that complex formation could be followed via native-gel electrophoresis (16) (Fig. 1D). For example, in the presence of eIF1, eIF1A, [35S]Met-tRNAi.eIF2.GMP-PNP and eIF5, the addition of eIF3 led to formation of a band with shifted mobility corresponding to the 43S complex (see left-hand side of Fig. 1D). eIF3 is by far the largest single component of the MFC and in mammals has been shown to stabilize the 40S.Met-tRNAiMet.eIF2.GTP complex (5). Here, we see that eIF1:eIF1A:[35S]Met-tRNAi.eIF2.GMP-PNP:eIF5, as well as the complex of these eIFs together with eIF3, are both stable. In further experiments, we investigated whether the 43S complex was competent to build the 80S complex by adding eIF5B and the 60S subunit. Previous work has shown that the addition of an excess of GMP-PNP can stabilize 80S formation, most likely by inhibiting the release of eIF5B that is normally triggered by GTP hydrolysis (17); likewise, we observed conversion of the 43S complex into 80S (Fig. 1D, right-hand side).
We also investigated the functionality of the 43S complex formed by mixing the components shown in Fig. 1A. To do this, we substituted GTP for GMP-PNP in the 43S complex, added the remaining components required for assembly of the 80S complex, i.e., eIF5B and 60S, and tested the assembled complex for its ability to catalyze methionyl-puromycin formation (Fig. 1 E and F). The results show that the addition of 60S and eIF5B allowed us to “chase” the 43S complex into an active 80S complex, thus confirming that the components used in this study are functional. Although there are no established “benchmark” figures for specific methionyl-puromycin synthesis rates catalyzed by such a complex from yeast, this is a widely used indicator of functionality.
The cryo-EM reconstruction of the 43S complex, at 20-Å resolution, indicates that major conformational changes occur in the 40S subunit on binding of the MFC (Fig. 3A). Multiple and entirely independent reconstructions of the 43S complex yielded very similar maps in which one region of the structure (identifiable as the subunit head) was not joined by discernible density to the rest of the structure. Because the single covalent link formed by helices 1/2 and 28 between the head and the body cannot break, this apparent detachment presumably derives from mobility in the head, such that its link to the body is averaged out, and its form is smeared. To investigate whether there were discrete subpopulations with better defined structures, we subclassified the 43S images (see SI Materials and Methods) and were able to obtain three separate lower-resolution reconstructions (30 Å) in which the interactions between the head and the rest of the structure were observable. These reconstructions (subclasses I–III, Fig. 3 B–D) contain images in which the very distinctive shape of the head is easily discernible. Subclass I derives from 6,864 of 31,756 images in the whole data set, subclass II from 8,269 of 31,756 images, and subclass III from 9,467 of 31,756 images; these three subclasses therefore account for 77% of the data. In three of the four reconstructions shown in Fig. 3, the structures of the body and platform are well defined and consistent; however, in subclass III, the head is particularly well ordered at the expense of some blurring of the body and platform.
Fig. 3.

Reconstructions of the 43S complex. (A) The main figure (in yellow/blue) depicts orthogonal views of the 43S reconstruction at 20-Å resolution, incorporating 27,101 of 31,756 images. The head (h), body (b), and platform (p) are labeled. The head is colored blue, and the rest of the reconstruction is in yellow. The left-hand image is of the reconstruction in gray mesh with the bootstrap variance map computed from its data set displayed at 1.7σ (green) and 1.77σ (red) (the maximum peak in each case was 2σ). (B–D) Equivalent orthogonal views to those shown in A for three subclass reconstructions of the 43S, displaying the variable position adopted by the head. B was calculated from 6,864 particles, C from 8,269 particles, and D from 9,467 particles. In each case, the resolution of the map is 30 Å. See SI Fig. 7 for representative class averages and 2D variance maps for these subclasses of 43S particles. See SI Fig. 8 for 3D variance analysis of these data; the variance map for the first orientation displayed is shown on the left of each figure, as in A. (E) Orthogonal views of the head regions of the reconstructions shown in B–D superposed (B, green; C, blue; and D, red). On the right (upper thumbnail) is the atomic structure of the head of the ribosome from the T. thermophilus crystal structure (21) (red) superimposed with reference to its body on that of the E. coli crystal structure (15) to demonstrate crystallographic evidence for the modes of head movement observed between the 40S and 43S structures. The lower three thumbnails show the 40S head aligned on its body to the 43S for each view. The thumbnails are 50% the size of the main images.
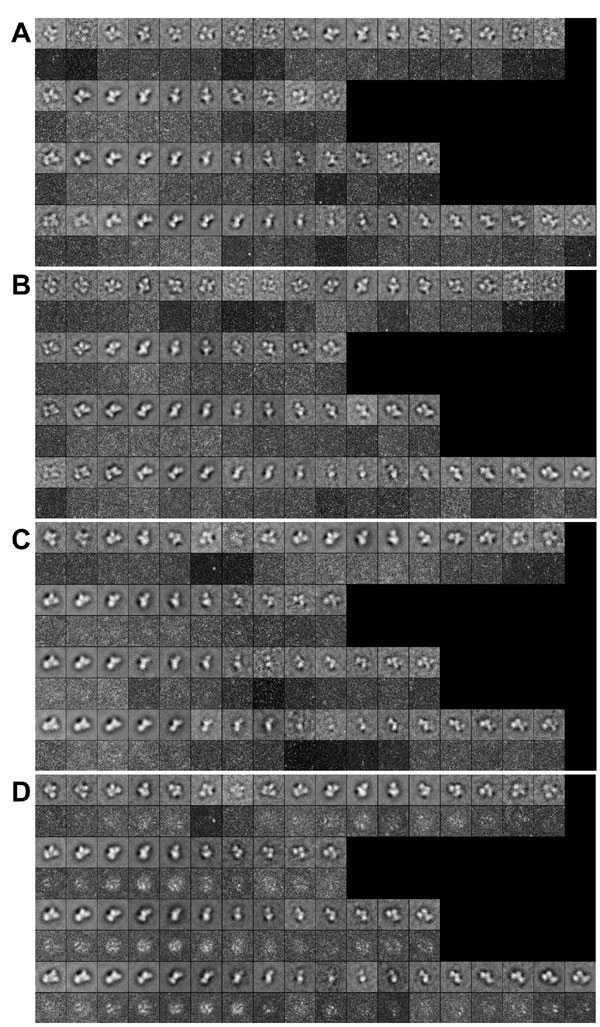
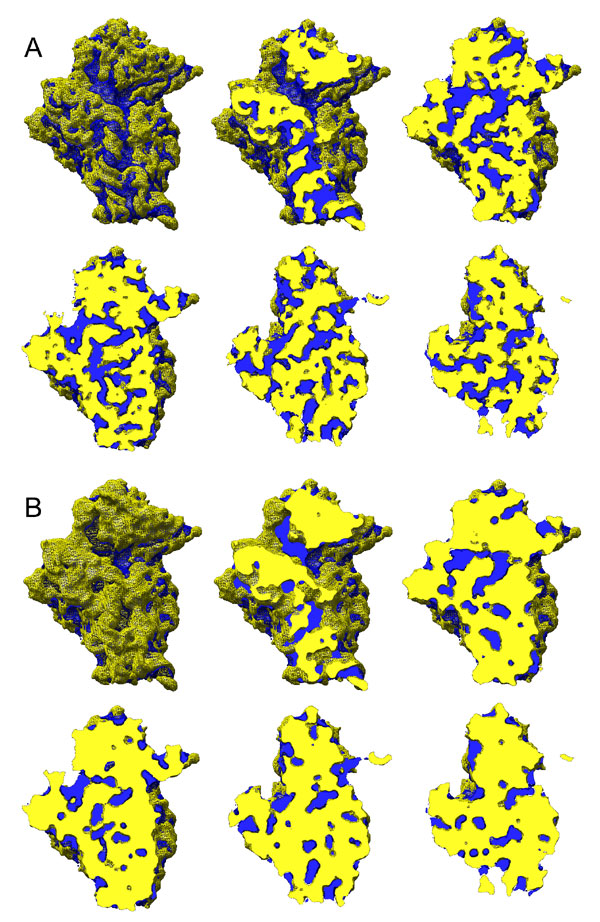
We tested our classification by looking, for some typical views of each of the three subclasses, at averages of the contributing projections and also the variances within the averages (SI Fig. 7). The clear features in the averages, together with the low level of variance, show that the subclasses shown in Fig. 3 are genuine; the quality of these data seems equivalent to those found in other similar analyses (see, e.g., ref. 18). The relatively low resolution of the subclass reconstructions suggests that there is residual variability within them but markedly less than in the data set as a whole (SI Fig. 7D). We also performed a 3D variance and covariance analysis, using the recently developed methodology of Penczek and colleagues (18–20) (see SI Materials and Methods, Fig. 3, and SI Fig. 8). This indicated that the maximum variance in the reconstruction of the whole data set was associated with the head region and the join between the body and platform regions (SI Fig. 8 A and B) and that the variance was reduced by subclassification (SI Fig. 8 C–E). Subclass III exhibited significantly more variance than subclasses I and II, which may derive from its consisting of more particles and/or from preferential alignment of the head at the expense of the rest of the structure. The features of the covariance (correlation) maps for significant variance peaks indicated that the high variance features have only local correlations. These results indicate that the head occupies a broad continuum of positions, which we have sampled by subclassification (Fig. 3E). The majority of the particles (represented by subclasses I and II) show a rotation within an arc of ≈25° that includes the locked conformation observed in the isolated 40S subunit, but a minority (≈9,500; subclass III) display rotation of up to 45°. The rotation observed is about the same axis as (although of greater magnitude than) that for the recently discovered movement within prokaryotic ribosomes (15).
Careful analysis of the reconstruction of the 43S complex shown in Fig. 3A reveals further details about the interaction of the small subunit and MFC. The body and platform can be identified by their positions and characteristic shapes. The body has a similar conformation to that found in the isolated 40S, but aligning the head, body, and platform density of the 40S to that of the 43S does not account for all of the 43S density (SI Fig. 9B). By elimination, this density comprises the bound MFC. The volumes of the regions of density identified with the head, body, platform, and MFC in the 43S complex account well for their known masses and display high correlation coefficients and low R factors when fitted to equivalent portions of the isolated subunit reconstruction or to the reconstruction of the MFC alone (see Table 1 and SI Materials and Methods). In Fig. 4A, we show the body, platform, and MFC regions of the 43S reconstruction, colored as in Fig. 2 C and D. We also show a superposition of the MFC density from the 43S reconstruction and the isolated MFC structure (Fig. 4B). Their shapes are very similar, allowing for the loss of eIF5, the incorporation of eIF1 and eIF1A, the difference in resolution of the two maps (see SI Materials and Methods), and changes consequent on binding the small subunit. The MFC lies between the body and platform, extending from the front to the back of the subunit (Fig. 4 A and B and SI Fig. 10) and appears to act as a wedge, opening up the mRNA channel between the head, body, and platform of the subunit and leading to subunit reorganization. In releasing the head from its stabilizing noncovalent interactions with the body and platform, the MFC has induced a rotation of the platform around toward the solvent face of the body and a spring-like movement of helix 18, which is very clearly identifiable in the body density (Fig. 4B and SI Fig. 10, where a stereoview is provided). However, it is likely that the conformational change involving the platform–body interface cannot be modeled in a simplistic fashion because it results from cumulative effects of many small changes (see below).
Fig. 4.

Analysis of the 43S complex. (A) Orthogonal views of the platform/body region of the 20-Å 43S reconstruction (as in Fig. 3A) with the platform and body colored as in 2C and the MFC colored magenta, oriented such that the body is in the same orientation in each image as in Fig. 2C. Thumbnails show the 40S platform and body aligned by reference to the body of the 43S for each view. Thumbnails are 50% of the main image size. (B) Equivalent views to A in which the 43S density corresponding to the reordered small subunit is colored gray (using the head from 3B for the head and the 20-Å structure (A) for the body/platform) fitted with the atomic models for the head, platform, and body (13), colored blue, green, and red. The MFC density is shown as a mesh surface, colored magenta. Thumbnails of the MFC within the 43S (semitransparent surface) superimposed on the isolated MFC reconstruction (magenta mesh) are shown in each orientation. Asterisk, helix 18. Thumbnails are 75% of the main image size. (C) Schematic diagram of the conformational changes observed here in the 40S subunit (Left, inactive) on binding the eIFs that form the MFC (Center). The head is colored blue and the platform/body is yellow in each case, as in Figs. 2C and 3, with arrows indicating the domain movements after eIF binding that release the subunit head. (Center) The head displays movement along with the covalent link between it and the body. (Right) The small subunit has reverted to its usual structure within the elongating ribosome with the binding of the large 60S subunit. h, head; p, platform; b, body; mfc, multifactor complex.
The underlying connectivity of the subunit domains is consonant with the proposed conformational changes (13) (SI Fig. 11C). In SI Fig. 11, we show the interactions among the four small subunit domains of the Thermus thermophilus 30S subunit (1,21; PDB ID Code 1FJF). The backbones of these domains, on the basis of which we have colored both the 30S atomic structure and the yeast model used in Figs. 2 and 4, all converge at the physical join of head, body, platform, and helix 44 in the small subunit (SI Fig. 11). The platform therefore has a single covalent link to the body, with the rRNA passing from body to platform at nucleotide ≈537 and returning from platform to body at nucleotide ≈860, with the regions containing nucleotides 537 and 860 being close in space (SI Fig. 11). The platform otherwise engages in a clasping interaction with the body, with helix 21 wrapped around onto the solvent face of the small subunit. Given the conformational changes already observed for the 30S, it is entirely conceivable that this clasping could be loose, permitting rotation in the platform–body region.
In SI Fig. 12, we show how the underlying architecture of the density in our reconstruction of the 43S matches the underlying rRNA structure as defined crystallographically and in SI Fig. 11. A high-density tube connects the body and platform regions of the small subunit within the 43S complex, and, with helix 18 aligned to its visible density (Fig. 4B), the yeast model of the subunit rRNA aligns such that the covalent connection between the central (platform) and 5′ (body) domains align with this tube. Thus, the density distribution in our 43S reconstruction matches the crystallographically defined rRNA structure. The conformational changes in the platform/body between the 40S and 43S structures requires much further detailed characterization at higher resolution, but in addition to the rearrangement of electrostatic bonds (e.g., those involving helix 21) may also involve morphing of the platform/body structure as a whole. Such morphing is a well documented aspect of ribosome structure/function (1, 15, 22). In support of this, we performed an analysis of the solvent content of the small subunit, using a crystal structure of the prokaryotic 30S subunit (21), and following the work of Voss and coworkers who showed the large subunit to be riddled with solvent channels in a manner reminiscent of a sponge (23). Using this approach, we showed the presence of a number of large solvent cavities and channels within the subunit that would allow conformational changes by solvent extrusion and that the solvent content of the small subunit is similar to that of the large (SI Fig. 13). Interestingly, the regions that are most implicated in conformational rearrangements by our study contain the most extensive regions of solvent. Thus, the rearrangements could very likely be achieved without the breakage of a large number of (noncovalent) bonds but by flexing around solvent voids. Such remodeling is a known factor in ribosome function, e.g., the gating of the mRNA exit channel (24) and the movement of the L7/L12 stalk (25).
Discussion
Comparison of our results with previous studies is informative. An earlier 48-Å reconstruction of a negatively stained eIF3-containing complex of 40S obtained from rabbit reticulocyte lysate (26) concluded that eIF3 is located on the solvent face in a similar position to that identified here and that, in the absence of the other MFC eIFs, it causes no more than a modest conformational rearrangement of the rabbit 40S subunit. This conclusion is consistent with the findings reported here, because we observe that the whole MFC, including the other eIFs, is responsible for opening up the head/body/platform junction. A more recent study (27) reported reconstructions of human eIF3 both in isolation and in complex with the hepatitis C virus internal ribosome entry site (IRES). The eIF3-IRES structure was then docked in silico onto a previously determined structure of a mammalian ribosome in complex with the IRES alone, and this fit was compared with a negative stain study of the 40S– complex. The results are consistent with our data in that they correspond to a different (most likely later) stage in the initiation pathway at which the conformational changes associated with recruitment have been completed (indeed, the yeast 40S subunit is incapable of mRNA recruitment in the presence of eIF3 alone).
Unfortunately this earlier work on the mammalian eIF3 is at too low a resolution to allow a detailed structural comparison with our results showing the yeast eIF3 in the context of the MFC. For the same reason, it is also not possible for us to compare our MFC reconstruction meaningfully with the isolated human eIF3; in addition, human eIF3 is more than twice the mass of the eIF3 of budding yeast; 807 kDa compared with 362 kDa. Similarly, because IRES elements bypass the scanning stage in initiation [and indeed IRES-mediated translation initiation requires only a subset, or none, of the eIFs involved in cap-dependent initiation (27–29)], the study of 80S human ribosomes bound with the cricket paralysis virus (CrPV) IRES by cryo-EM (28) generated a reconstruction that is likely to be equivalent to a state of the 40S subunit normally achieved downstream of mRNA insertion into the channel. Even more pointedly, the ribosome/CrPV IRES interaction involved an 80S ribosome because of the so-far unique characteristics of the CrPV IRES (28). Overall, the previous studies of 40S-IRES interactions (28, 29) suggest that there are at least two different sets of interactions that can clamp the 5′ end of an IRES to the 40S subunit. There may therefore be distinct structural strategies for binding each type of IRES in the correct position. Moreover, these earlier reconstructions do not indicate how the 40S subunit solves the topological problem of inserting the mRNA into the ribosome channel, most likely because they represent a step in the IRES-mRNA recruitment process that occurs after loading into the mRNA channel.
Our work suggests that, for capped message, the topological problem of mRNA loading is solved in a general way by major conformational changes that have a significant impact on the relationship between the head and body of the 40S subunit (Fig. 4C). This rearrangement will necessarily remodel the channel through the 40S subunit identified as the conduit for mRNA (13, 29, 30). In the isolated 40S subunit, this channel is relatively narrow, such that it is hard to envisage diffusion processes threading a 5′ capped mRNA through it, and there is no effective binding mechanism to facilitate vectorial, 5′-specific entrance of the mRNA into it (compare Figs. 2A, 3 B–D, and 4B), consistent with the 40S subunit not being recruited on to the 5′ end of capped mRNA in the absence of the eIFs. In this article, we have not characterized directly the (in vivo) functional consequences of the conformational change but have managed to capture a structural snapshot that suggests a model in which the levering open of the noncovalent head–body-platform contacts by the MFC renders the mRNA channel accessible to introduction of the 5′ nucleotides of the mRNA mediated by the cap-binding complex eIF4F. This conformational change is much greater that those seen in prokaryotes, where initiation does not involve the loading of mRNA associated with a large cap-binding complex through the narrow mRNA entrance channel (21), and it seems that eukaryotes have evolved a translation machinery (eIFs and ribosome) that promotes general guided access to the channel for any capped mRNA through large conformational changes in the 40S subunit.
Materials and Methods
Further details are provided in SI Materials and Methods.
Sample Preparation.
The 43S complexes were prepared by mixing 50 pmol of 40S with 150 pmol each of eIF2, eIF3, eIF5; 500 pmol of eIF1; and 5 nmol of eIF1A in a reaction volume of 250 μl. We then added 150 pmol of Met-tRNAiMet, ATP and GMP-PNP (final concentrations of 1 mM and 0.4 mM, respectively). Reactions were incubated at 26°C for 10 min, loaded on 10–30% gradients of sucrose in buffer A and centrifuged at 39,000 rpm for 4 h (SW 40Ti rotor). Peak fractions were dialyzed in buffer A for 2 h at 4°C and concentrated to OD260 = 1.5–2.5.
Assaying Formation of 40S-eIF Complexes and Methionyl-Puromycin.
The native gel assay for the formation of ribosomal complexes (RC) and the methionyl-puromycin assay were performed as described (17), except that purified 40S and 60S fractions, rather than 80S fractions, were used. The various components (including the mRNA 5′-GGAA[UC]7UAUG[CU]10C-3′) were brought together in 38 mM Hepes-KOH (pH 7.4), 135 mM KOAc, 3.25 mM Mg(OAc)2, and 4% glycerol. GTP or GMP-PNP were used, as appropriate. Incubations of 25 μl were run on a 4% acrylamide gel (37.5:1 acrylamide:bisacrylamide) in THEM buffer [66 mM Hepes/34 mM Tris base/2.5 mM MgCl2/0.1 mM EDTA (final pH 7.5)] for 6 h at 8 W. Formation of the 80S complex was achieved by also including eIF5B and 60S (17). In the puromycin assay, all components except puromycin were initially preincubated at 28°C for 10 min. The reactions were then started through the addition of puromycin. Two-microliter aliquots were withdrawn at different time points and quenched in 0.5 μl of 3 M NaOAc (pH 4.6). Samples were spotted onto Polygram IONEX-25 SA-Na cation exchange TLC plates (Macherey–Nagel, Düren, Germany). The plates were developed in 2M NH4OAc, pH5.2 plus 10% acetonitrile.
Cryoelectron Microscopy.
Images of plunge-frozen microscope grids were captured by using a CM200 field emission gun cryoelectron microscope operating under low dose conditions. The micrographs were scanned by using a UMAX PowerLook 3000 scanner on an 8.322-μm raster. Images were excised by using XIMDISP (31) and SPIDER (32), or EMAN (33). The CTF of each micrograph was determined, and the data deriving from it was corrected by phase-flipping. For all samples, reconstructions were computed ab initio by using IMAGIC (34), with refinement in EMAN (33) and SPIDER (32). Reconstructions were computed for both the whole data set and for three subclasses, as described in SI Materials and Methods. Variance and covariance analyses were carried out by using the methods described by Penczek and colleagues (19). SI Fig. 14 shows the isotropic distribution of the image orientations used in the 43S reconstruction. SI Fig. 15 shows determination of the hand of the 43S reconstruction, which also serves as a validation of its correctness.
Fitting and Analysis of Atomic Structures.
Atomic models were first fitted manually and then automatically by using the program URO (35). Analysis of the solvent volume within the small subunit was carried out according to the method of Voss and colleagues (23).
Fitting of Densities.
Maps, or fragments thereof, were fitted to each other by using the program GAP (24, 36), refining relative rotations and translations by the method of steepest descent. The target functions were real space correlation coefficients and R-factors.
Accession Numbers.
The reconstructions reported in this manuscript have been deposited in the Macromolecular Structure Database (http://www.ebi.ac.uk/msd) with accession numbers EMD-1327–EMD-1332.
Supplementary Material
Acknowledgments
We thank John Hershey (Davis, CA), Alan Hinnebusch [National Institutes of Health (NIH), Bethesda, MD], Tom Dever (NIH, Bethesda, MD), and Graham Pavitt (University of Manchester) for providing expression plasmids. Robert Esnouf, Richard Brimacombe, Peter Rosenthal, and Richard Henderson provided valuable advice. Images used in this analysis were captured on CM200 microscopes at the Division of Structural Biology, University of Oxford and at the European Molecular Biology Laboratory (EMBL), Heidelberg, Germany. We are grateful to the EMBL, and in particular to Kenneth Goldie. This research was supported by grants from the Wellcome Trust and the Biotechnology and Biological Sciences Research Council (U.K.). R.J.C.G. is a Royal Society University Research Fellow and D.I.S. is an Medical Research Council Research Professor. J.E.G.M. is a Wolfson–Royal Society Research Fellow and a member of both the School of Chemical Engineering and Analytical Science and the Faculty of Life Sciences at the University of Manchester.
Abbreviations
- eIF
eukaryotic initiation factor
- IRES
internal ribosome entry site
- MFC
multifactor complex.
Footnotes
The authors declare no conflict of interest.
This article is a PNAS Direct Submission.
Data deposition: The reconstructions reported in this paper have been deposited in the Macromolecular Structure Database, http://www.ebi.ac.uk/msd (accession nos. EMD-1327–EMD-1332).
This article contains supporting information online at www.pnas.org/cgi/content/full/0606880104/DC1.
References
- 1.Ramakrishnan V. Cell. 2002;108:557–572. doi: 10.1016/s0092-8674(02)00619-0. [DOI] [PubMed] [Google Scholar]
- 2.McCarthy JEG. Microbiol Mol Biol Rev. 1998;62:1492–1553. doi: 10.1128/mmbr.62.4.1492-1553.1998. [DOI] [PMC free article] [PubMed] [Google Scholar]
- 3.Kozak M. Gene. 2002;299:1–34. doi: 10.1016/S0378-1119(02)01056-9. [DOI] [PMC free article] [PubMed] [Google Scholar]
- 4.Spirin AS. FEBS Lett. 2002;514:2–10. doi: 10.1016/s0014-5793(02)02309-8. [DOI] [PubMed] [Google Scholar]
- 5.Hershey JWB, Merrick WC. In: Translational Control of Gene Expression. Sonenberg N, Hershey JWB, Mathews MB, editors. Cold Spring Harbor, NY: Cold Spring Harbor Lab Press; 2000. pp. 33–88. [Google Scholar]
- 6.Chaudhuri J, Si K, Maitra U. J Biol Chem. 1997;272:7883–7891. doi: 10.1074/jbc.272.12.7883. [DOI] [PubMed] [Google Scholar]
- 7.Donahue T. In: Translational Control of Gene Expression. Sonenberg N, Hershey JWB, Mathews MB, editors. Cold Spring Harbor, NY: Cold Spring Harbor Lab Press; 2000. pp. 487–502. [Google Scholar]
- 8.Pestova TV, Borukhov SI, Hellen CU. Nature. 1998;394:854–859. doi: 10.1038/29703. [DOI] [PubMed] [Google Scholar]
- 9.Singh CR, He H, Ii M, Yamamoto Y, Asano K. J Biol Chem. 2004;279:31910–31920. doi: 10.1074/jbc.M313940200. [DOI] [PubMed] [Google Scholar]
- 10.Asano K, Clayton J, Shalev A, Hinnebusch AG. Genes Dev. 2000;14:2534–2546. doi: 10.1101/gad.831800. [DOI] [PMC free article] [PubMed] [Google Scholar]
- 11.Phan L, Schoenfeld LW, Valasek L, Nielsen KH, Hinnebusch AG. EMBO J. 2001;20:2954–2965. doi: 10.1093/emboj/20.11.2954. [DOI] [PMC free article] [PubMed] [Google Scholar]
- 12.He H, von der Haar T, Singh CR, Ii M, Li B, Hinnebusch AG, McCarthy JEG, Asano K. Mol Cell Biol. 2003;23:5431–5445. doi: 10.1128/MCB.23.15.5431-5445.2003. [DOI] [PMC free article] [PubMed] [Google Scholar]
- 13.Spahn CM, Beckmann R, Eswar N, Penczek PA, Sali A, Blobel G, Frank J. Cell. 2001;107:373–386. doi: 10.1016/s0092-8674(01)00539-6. [DOI] [PubMed] [Google Scholar]
- 14.Spahn CM, Gomez-Lorenzo MG, Grassucci RA, Jorgensen R, Andersen GR, Beckmann R, Penczek PA, Ballesta JP, Frank J. EMBO J. 23:1008–1019. doi: 10.1038/sj.emboj.7600102. [DOI] [PMC free article] [PubMed] [Google Scholar]
- 15.Schuwirth BS, Borovinskaya MA, Hau CW, Zhang W, Vila-Sanjurjo A, Holton JM, Cate JHD. Science. 2005;310:827–834. doi: 10.1126/science.1117230. [DOI] [PubMed] [Google Scholar]
- 16.Lorsch J, Herschlag D. EMBO J. 1999;18:6705–6717. doi: 10.1093/emboj/18.23.6705. [DOI] [PMC free article] [PubMed] [Google Scholar]
- 17.Shin B-S, Maag D, Roll-Mecak A, Arefin MS, Burley SK, Lorsch JR, Dever TE. Cell. 2002;111:1015–1025. doi: 10.1016/s0092-8674(02)01171-6. [DOI] [PubMed] [Google Scholar]
- 18.Grob P, Cruse MJ, Unouye C, Peris M, Penczek PA, Tjian R, Nogales E. Structure (London) 2006;14:511–520. doi: 10.1016/j.str.2005.11.020. [DOI] [PubMed] [Google Scholar]
- 19.Penczek PA, Yang C, Frank J, Spahn CMT. J Struct Biol. 2006;154:168–183. doi: 10.1016/j.jsb.2006.01.003. [DOI] [PubMed] [Google Scholar]
- 20.Penczek PA, Frank J, Spahn CMT. J Struct Biol. 2006;154:184–194. doi: 10.1016/j.jsb.2005.12.013. [DOI] [PubMed] [Google Scholar]
- 21.Wimberly BT, Brodersen DE, Clemons WM, Morgan-Warren RJ, Carter AP, Vonrhein C, Hartsch T, Ramakrishnan V. Nature. 2001;407:327–339. doi: 10.1038/35030006. [DOI] [PubMed] [Google Scholar]
- 22.Ogle JM, Murphy FV, Tarry MJ, Ramakrishnan V. Cell. 2002;111:721–732. doi: 10.1016/s0092-8674(02)01086-3. [DOI] [PubMed] [Google Scholar]
- 23.Voss NR, Gerstein M, Steitz TA, Moore PB. J Mol Biol. 2006;360:893–906. doi: 10.1016/j.jmb.2006.05.023. [DOI] [PubMed] [Google Scholar]
- 24.Gilbert RJC, Fucini P, Connell S, Nierhaus KH, Robsinson CV, Dobson CM, Stuart DI. Mol Cell. 2004;14:57–66. doi: 10.1016/s1097-2765(04)00163-7. [DOI] [PubMed] [Google Scholar]
- 25.Agrawal RK, Heagle AB, Penczek PA, Rassucci RA, Frank J. Nat Struct Biol. 1999;6:643–647. doi: 10.1038/10695. [DOI] [PubMed] [Google Scholar]
- 26.Srivastava S, Verschoor A, Frank J. J Mol Biol. 1992;226:301–304. doi: 10.1016/0022-2836(92)90946-h. [DOI] [PubMed] [Google Scholar]
- 27.Siridechadilok B, Fraser CS, Hall RJ, Doudna JA, Nogales E. Science. 2005;310:1513–1515. doi: 10.1126/science.1118977. [DOI] [PubMed] [Google Scholar]
- 28.Spahn CMT, Jan E, Mulder A, Grassucci RA, Sarnow P, Frank J. Cell. 2004;118:465–475. doi: 10.1016/j.cell.2004.08.001. [DOI] [PubMed] [Google Scholar]
- 29.Spahn CM, Kieft JS, Grassucci RA, Penczek PA, Zhou K, Doudna JA, Frank J. Science. 2001;291:1959–1962. doi: 10.1126/science.1058409. [DOI] [PubMed] [Google Scholar]
- 30.Dube P, Bacher G, Stark H, Mueller F, Zemlin F, van Heel M, Brimacombe R. J Mol Biol. 1998;279:403–421. doi: 10.1006/jmbi.1998.1804. [DOI] [PubMed] [Google Scholar]
- 31.Crowther RA, Henderson R, Smith RM. J Struct Biol. 1996;116:9. doi: 10.1006/jsbi.1996.0003. [DOI] [PubMed] [Google Scholar]
- 32.Frank J, Radermacher M, Penczek P, Zhu J, Li Y, Ladjadj M, Leith A. J Struct Biol. 1996;116:190–199. doi: 10.1006/jsbi.1996.0030. [DOI] [PubMed] [Google Scholar]
- 33.Ludtke SJ, Baldwin PR, Chiu W. J Struct Biol. 1999;128:82. doi: 10.1006/jsbi.1999.4174. [DOI] [PubMed] [Google Scholar]
- 34.van Heel M, Harauz G, Orlova EV, Schmidt R, Schatz M. J Struct Biol. 1996;116:17–24. doi: 10.1006/jsbi.1996.0004. [DOI] [PubMed] [Google Scholar]
- 35.Navaza J, Lepault J, Rey FA, Alvarez-Rua C, Borge J. Acta Crystallogr D. 2002;58:1820–1825. doi: 10.1107/s0907444902013707. [DOI] [PubMed] [Google Scholar]
- 36.Grimes JM, Burroughs JN, Gouet P, Diprose JM, Malby R, Zientara S, Mertens PP, Stuart DI, editors. Nature. 1998;395:470–478. doi: 10.1038/26694. [DOI] [PubMed] [Google Scholar]
Associated Data
This section collects any data citations, data availability statements, or supplementary materials included in this article.