

Abstract
In separations in capillaries or on chips, the most predominant detectors outside of the field of proteomics are electrochemical (EC) and optical. These detectors operate in the μM to pM range on nL peak volumes with ms time resolution. The driving forces for improvement are different for the two classes of detectors.
With EC detectors, there are two limitations that the field is trying to overcome. One is the ever-present surface of the electrode which, while often advantageous for its catalytic or adsorptive properties, is also frequently responsible for changes in sensitivity over time. The other is the decoupling of the electrical systems that operate electrokinetic separations from the system operating the detector.
With optical detectors, there are similarly a small number of important limitations. One is the need to bring the portability (size, weight and power requirements) of the detection system into the range of EC detectors. The other is broadening and simplifying the applications of fluorescence detection, as it almost always involves derivatization.
Limitations aside, the ability to make detector electrodes and focused laser beams of the order of 1 μm in size, and the rapid time response of both detectors has vaulted capillary and chip separations to the forefront of small sample, fast, low mass-detection limit analysis.
Keywords: Capillary electrophoresis, Capillary HPLC, Electrochemical detection, Lab-on-a-chip, Laser-induced fluorescence
1. Introduction
There is no question that detectors are a key component in microseparations strategies. Detectors play a role in determining selectivity. Of course, detectors control to a large degree the limits of detection (LODs) – and most particularly the concentration LODs – of separations-based methods. Detectors may also constrain the designer of a method through the requirements that they place on the system. Examples are the pathlength requirement for absorbance detectors, and the materials requirements placed on the designer of fluorescence detectors. Given the importance of detectors in microseparations methods, it is not surprising that the field has been reviewed fairly regularly. Given this abundance of reviews, we have chosen to emphasize the time period from 2004, though many earlier works are described.
In observing the trajectory of the field, some patterns emerge. It is clear that there is considerably more creativity in optical detection than in electrochemical (EC) detection (mass spectrometry is covered elsewhere in this issue). This arises chiefly from the desire to scale the size, mass, and power requirements of the optical detectors down to the scale of the separations device. EC detection (ECD) is intrinsically low-volume and low-power (i.e. it needs little electrical power to work), so the same level of creativity is not required here.
There is a move to complexity, 3-D chips and parallel separations, which puts new demands on detectors. Post-column reactions are more common in the micro and chip worlds. Perhaps this is a result of the simplicity of adding another arm to the chip design. It is also considerably easier to mix reagents effectively at the distance scales of micro- and chip-based separations than for mm-scale separations.
The first half of this review covers EC systems, while the second covers optical detection.
2. Electrochemical detection in capillary and chip separations
2.1. Electrochemical cell design – overview
ECD schemes for capillary separations often involve one of two different EC cell designs: end-capillary and in-capillary. For capillary liquid chromatography (LC), an end-capillary (also called end-column) detector involves positioning the working electrode near the column outlet; in an in-capillary (also called on-column) detector, the working electrode is inserted into the tube used to make the column. In the case of capillary electrophoresis (CE), the notion is basically similar to capillary LC except that decoupling the electrophoretic field from the EC detector is essential when designing the EC cell. In an end-capillary (also called end-channel) detector, the working electrode is positioned tens of micrometers from the exit of the separation channel. This distance, whic h scales as the column/channel diameter, allows sufficient decoupling of the separation voltage from the working electrode and detector. An in-capillary detector involves use of a decoupler, an additional pathway to facilitate grounding of the separation current prior to ECD, or an electrically isolated potentiostat. The former approach is generally known as off-column or off-channel, and the latter in-channel.
2.2. Detection in capillaries
2.2.1. End-capillary
The end-capillary configuration is the most commonly used in CE-EC applications because of its ease of use. It includes several different designs. Using an electrode whose surface area is larger than the capillary opening shows good reproducibility and does not have such strict requirements in alignment. The typical diameters for the electrodes are several hundred micrometers, while the separation-capillary inner diameters are in the tens-of- micrometer range. This detection set- up has been successfully used in environmental analysis [1,2] and herbal medicine[3–9], and for biological samples [10].
Researchers have also built pre-aligned EC cells [10,11] based on this idea, which avoids the need to center the working electrode with a micropositioner and microscope before each experiment, further improving reproducibility. The LODs of this method are usually in the micromolar range. Also, a capillary-electrode holder built in Huebner’s lab [12] automatically aligns the capillary and the electrode in a wall-jet configuration without the aid of micropositioner and facilitates the replacement of electrodes and/or capillaries without reconstruction of the entire capillary/electrode set- up. Fig. 1a shows the design of the whole detection unit. A guide for the working electrode and capillary holder is situated inside the outlet vial (Fig. 1b).
Figure 1.
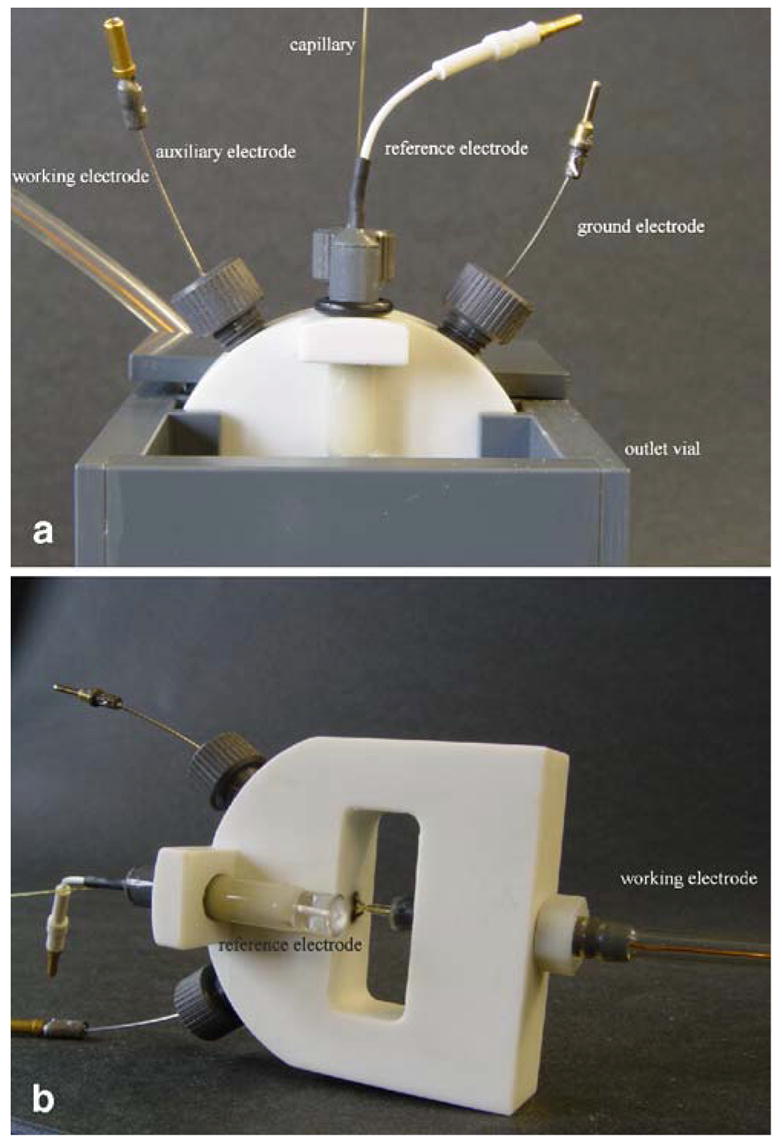
(a) Design of the detection unit; (b) design of the detection cell [12].
Microelectrodes are relatively less popular in end-capillary-detection schemes, although they generally have higher signal-to- noise ratio. One can imagine that, when the inner diameter of the separation capillary and the working electrode size are in the same range (usually tens of micrometers), it requires accurate electrode alignment to get reproducibility. In fact, the detector current is a function of the placement of the electrode relative to the capillary opening when using a small-diameter microelectrode. A scanning EC microscope (SECM), which can produce an image of the concentration of an electrochemically active species, can be used to measure the solute-concentration profile when it elutes from the capillary. Anderson [13] measured the peak-current decay as the electrode is moved both laterally and vertically away from the capillary opening and found that the best signal-to-noise is obtained when the detector electrode is placed just outside the capillary opening and does not suffer appreciable decrease as the electrode is moved away from the capillary up to a distance of 20 μm with a 10-μm ID separation capillary.
2.2.2. In-capillary
In-capillary detection schemes can be realized by placing a carbon- fiber microelectrode inside the capillary end with an enlarged inside diameter via HF etching [14,15] (Fig. 2). Electrophoretic resolution of 14 biogenic amines and metabolites in the fruit fly was accomplished with a micellar electrokinetic capillary chromatography–EC (MEKC-EC)-detection system. In addition to the work with populations of flies, Ewing [15] also achieved the determination of biogenic amine variability among individual fly heads with enhanced sensitivity in MEKC-EC.
Figure 2.
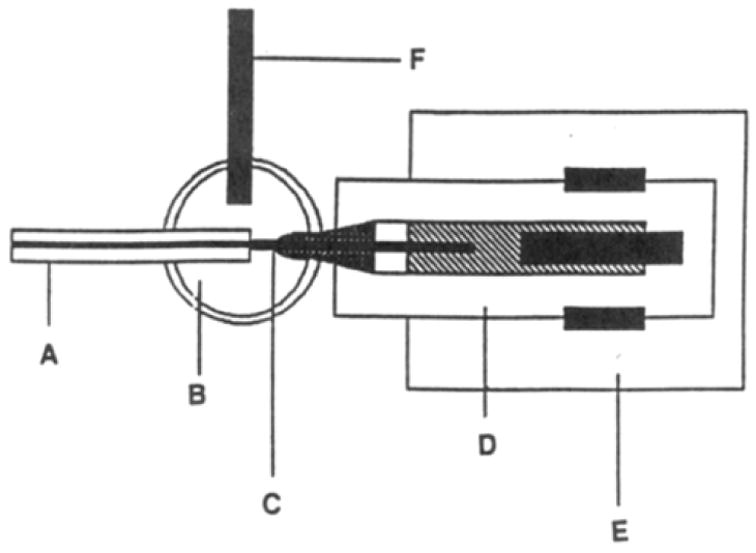
End-column amperometric detector: (A) separation capillary; (B) electrochemical cell; (C) carbon-fiber electrode; (D) electrode assembly: (E) micromanipulator; (F) SCE reference electrode [91].
Weber’s lab used an in-capillary detection scheme combined with post-column biuret derivatization to detect non-electroactive peptides after capillary LC separation[16]. The carbon-fiber microelectrode was placed in a post-column flow reactor built with fluorinated ethylene propylene and fused-silica capillary tubing [17]. The post-column flow reactor allows the post-column reaction to take place witho ut adding significant peak band-spreading, which is a common problem associated with post-column reactors in capillary separations. The biuret reaction was also used in pre-column derivatization with an in-capillary ECD scheme [18]. Because the biuret reagent is basic, which will complicate the separation with columns packed with silica particles, special base-resistant, polymer-based reversed-phase particles were used in this case. The authors were able to use this method for determination of vasopressin and bradykinin in dialysates collected from the rat supraoptic nucleus.
2.2.3. Electrode material
Besides the work on EC-cell design, researchers have also worked on modificatio ns of the electrode especially when selective detection is required. Most of the electrodes used in CE-ECD are based on carbon materials owing to their low background, low cost, high stability and resistance to passivation.
Apart from the commonly- used glassy-carbon-disk electrodes [1,3–11] and carbon-fiber electrodes [13–15,19], carbon nanotubes are also used as electrode material because of their electrocatalytic properties. Carbon-nanotube-paste electrodes prepared by mixing 20–50-nm multi-walled carbon-nanotube powder and mineral oil have proved [20] to improve the LODs of neurotransmitters compared to classical carbon-paste electrodes. The authors also constructed a new EC cell including a Nafion decoupler for CE-ECD. A melanin-type polymer- modified glassy-carbon electrode and graphite-carbon electrodes showed sensitivities 3–5 times higher than bare-carbon electrodes and LODs at sub-micromolar levels in neurotransmitter CE-EC [21], because of more efficient electron transfer and excellent permselectivity of the melanin polymers.
Metal electrodes are also important electrode materials in CE-EC especially for some specific analytes. The kinetics of 3-chloro-1, 2-propanediol (toxic) hydrolysis to glycerol (non-toxic), which is very important to the food industry, were studied with CE-EC using a copper electrode [22].
Some analytes, such as carbohydrates and amines, tend to foul the surface of the working electrode, especially metal electrodes. Pulsed amperometric detection (PAD) has proven useful in avoiding this problem. For example, EC determination of alkyl polyglucosides in industrial products was carried out on gold electrodes [12].
Using non-aqueous solvents can provide an extended accessible potential window for those analytes that have large overpotentials at ordinary solid electrodes in aqueous media. By proper choice and ratio of suitable non-aqueous solvents, Matysik [2] was able to achieve LODs of hydrazine and its methyl derivatives one to two orders of magnitude lower than that achieved by CE-EC methods in aqueous buffer systems in conjunction with various types of chemically-modified electrodes.
2.3. Electrochemical detection in microchip separations
The detection modes are still pretty much same as those in capillary separatio n, and the cell design is basically divided into on-chip and off-chip formats.
2.3.1. On-chip
On-chip EC detectors include three different designs : end-channel; off-channel; and, in-channel.
2.3.1.1. End-channel
End-channel is the most widely used mode. The electrodes are usually fabricated using electron-beam evaporation. More recently, gold and copper electrodes were fabricated on chip by a simplified electroless deposition. Wang [23] used the same method to prepare nickel electrodes on a glass substrate, resulting in a non-uniform nickel layer consisting of about 1–10-μm metal microrods and flakes. The behavior of the on-chip electroless-nickel detector was demonstrated for the anodic detection of ethanol and glucose with LODs of 0.6 mM and 0.03 mM, respectively.
On-chip usually involves permanently integrated working electrodes close to the channel exit, which brings the disadvantage that the electrode cannot be polished. Chen [24] developed an integrated CE-ED chip with an on-chip electrode-orientating bore that was used to mount and align a replaceable micro-disk working electrode (Fig. 3), so that the working electrode could be replaced in a couple of minutes without any off-chip device. The reproducibility of the electrode alignment was better than 6% RSD. The influence of cross section and channel-to-electrode distance on working electrode potential was studied using dopamine and catechol as model analytes. The smaller the channel cross section, the lower the iR drop formed in the detection area, thus the lower the half-wave potential.
Figure 3.
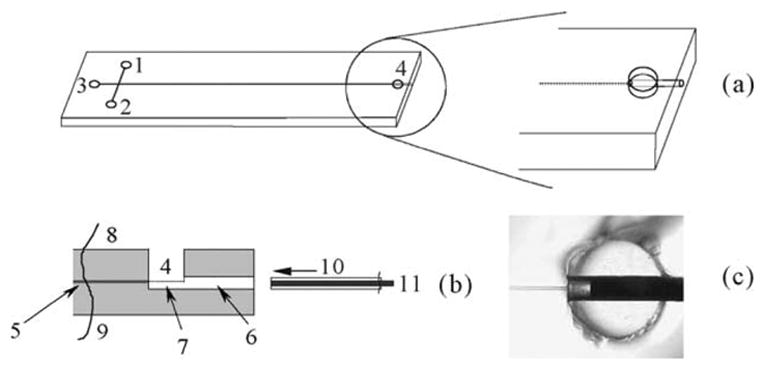
Schematic diagram of the microchip with integrated electrochemical detection cell (a), the sectional view of the detection cell (b), and CCD image (bottom view) of the detection cell with a micro-disk-electrode positioning at a channel-to-electrode distance of about 400 μm (c) [24].
2.3.1.2. In-channel and off-channel
In-channel and off-channel detection both include placing the working electrode directly in the separation channel. While, in the case of in-channel detection, the electrophoretic field is separated from the detection cell by use of an electrically isolated potentiostat, the EC detector is isolated from the separation voltage by means of a decoupler in off-channel detection. The decoupler provides a current path to ground just before the working electrode. Researchers have made noticeable progress in these EC-cell designs too.
A poly(dimethylsiloxane) (PDMS)/glass microchip with a fully-integrated ECD system was developed in Schoening’s lab [25]. The electrodes, including all the detector electrodes as well as the high-voltage separation electrodes, were incorporated directly into a glass substrate via traditional microfabrication techniques, while the top PDMS plate contained the separation and injection channels for CE (Fig. 4). Because PDMS has high chemical and mechanical stability and provides good support of the electroosmotic flow, while the glass substrate supports photolithographically patterned metal electrodes, the hybrid PDMS/glass-chip design can rapidly prototype separation microsystems.
Figure 4.
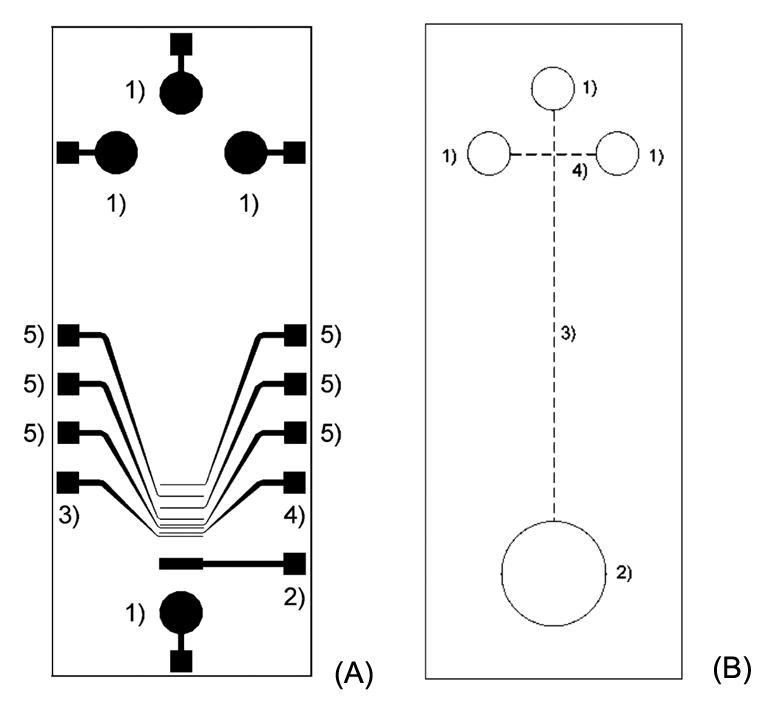
Schematic diagram of the glass chip (A) with: (1) high-voltage electrodes; (2) counter electrode; (3) reference electrode; (4) working electrode; and, (5) decoupler electrodes. Schematic diagram of the PDMS chip (B) with: (1) buffer and sample reservoirs; (2) waste and detection reservoir; (3) separation channel; and, (4) injection channel [25].
Using screen-printing technology, carbon and silver electrodes are fabricated on a cleaned poly(methyl methacrylate) (PMMA) substrate [26]. Carbon served as the working electrode, while the silver electrode was treated with 15% H2O2 followed by 3 M KCl to form a stable AgCl coating for the reference electrode. A thick photoresist layer was spun onto the other PMMA piece and a microfluidic system was formed using a photolithographic process. The two layers were bonded using a bonding machine with 15 psi bonding pressure and 120ºC bonding temperature. This device is special in that the thick photoresist was used as both the adhesion layer and the microfluidic system.
2.3.2. Off-chip
Off-chip means that electrodes are externally positioned and aligned. It usually involves some kind of clamp or screw for accurate alignment with the channel. The electrode piece can be cleaned and/or replaced if anything goes wrong in the system (e.g., electrode fouling from the analytes). Only end-channel alignment can be realized with this approach, as all the other modes involve electrodes interfaced with the chip before the chip is completely bonded. Electrode materials used in this detection scheme can be more diverse, as electrode fabrication is independent of the chip-fabrication process.
Wang [27,28] used screen-printing for carbon-electrode fabrication and was able to detect synthetic estrogen- mimicking compounds and V-type nerve agents. Boron-doped diamond thin- film electrodes can be deposited with a high-pressure microwave plasma-assisted chemical-vapor-deposition (CVD) system. For determinations of aromatic amines, important in the chemical industry and many of which are highly toxic and suspected to be carcinogenic, the diamond electrode displayed a favorable analytical performance compared to commonly- used screen-printed carbon and glassy-carbon electrodes. The latter have higher overpotentials and surface passivation by adsorbed polymeric by-products. The LODs for 4-aminophenol (4-AP) and 2-aminonaphthalene (2-AN) were 2.0 and 1.3 μM, respectively [29].
Surface modification of electrodes is also possible with this detector design. A screen-printed carbon electrode modified with poly-5, 2′-5′, 2′-terthiophene-3′- carboxylic acid (poly- TTCA), which can promote electron transfer in the oxidation of DNA moieties, was used in analysis of DNA fragments amplified by the polymerase chain reaction (PCR) [30]. In this experiment, sample adsorption onto the inner surface of the capillary wall was minimized by coating the channel with an acrylamide solution.
Microelectrodes, either commercially available or home- made, can be aligned and positioned accurately at the end of a separation channel with the aid of a micromanipulator and a microscope. A Pt ultramicroelectrode with a diameter of 10 μm was used in a PDMS microchip for detection of acetaminophen and its hydrolysate [31]. The same research group recently also made a Plexiglass holder integrated with a three-dimensional manipulator for housing the detector and reservoirs with a plasticized poly(ethylene terephthalate) (PET)-toner microchip (Fig. 5), which shows higher stability and durability at very low cost compared to PDMS [32].
Figure 5.
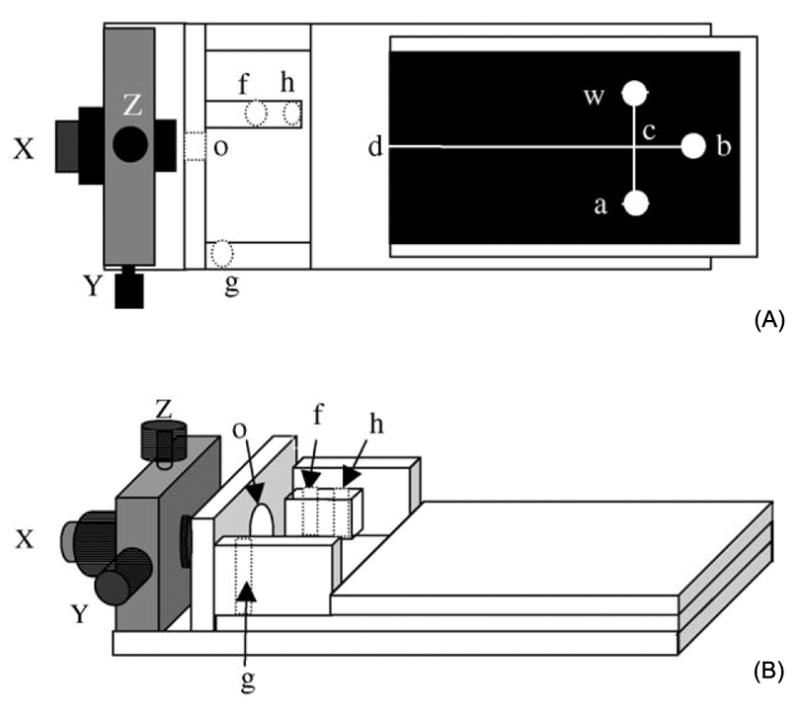
Side three-dimensional view of the home-made Plexiglass holder integrated with a three-dimensional micromanipulator (X-, Y-, Z- direction adjustor) and a PET-toner microchip (A) and top view of the holder and PET-toner microchip (B); (a) sample reservoir; (b) buffer reservoir; (c) injection crossing; (d) end-channel detection point; (w) sample-waste reservoir; (o) working-electrode hole; (f) auxiliary-electrode hole; (h) reference-electrode hole; and, (g) CE-ground-electrode hole [32].
As with conventional CE-EC, positioning of the electrodes is crucial to detector performance. SECM can be used to discover the influence of the detector position on the shape of the electropherograms and hydrodynamic voltammograms [33].
3. Optical detection
In capillary separations, the small injection volume remains a great challenge to detection and identification of materials of interest. Conventional optical-detection methods, such as absorbance, have limited sensitivity due to the short optical path length dictated by the capillary inner diameter, which is normally 50 μm or 75 μm. Thus, a lot of attention has been given to developing better detection methods after capillary separations. The most widely- used optical methods in capillary systems are ultraviolet/visible (UV/Vis) detection, fluorescence detection, and other luminescence detection.
3.1. UV detection
UV/Vis detectors are broadly used in capillary and chip separation systems because of their simplicity and flexibility. However, the LOD for UV/Vis detectors is only 10−5–10−6 M for very good absorbers, so a lot of research work has been done to improve it. Two main methods have been used: increasing the amount of analyte; and, improving the sensitivity of the detector [34–37].
Pre-concentration techniques (e.g., sample stacking, sweeping, field-amplified sample injection/stacking, or on-line solid-phase extraction) have been developed to increase the amount of analyte [34–37]. For example, Mejuto and co-workers [38] used large-volume sample-stacking injection with the electroosmotic flow pump to stack trace amounts of tetrabromobisphenol A and other phenolic compounds in environmental studies. As a result, the sensitivity was greatly improved. However, the pre-concentration technique is restricted by the matrix composition (e.g., a sample with high salt concentration is unsuitable for the stacking method [39]).
To improve the sensitivity of the detector, bubble cells (Fig. 6) or z-shaped cells (Fig. 7) have been used in order to increase the optical path length for optical detection. However, the detector also increased band-broadening, so the sensitivity improvement is limited to a factor of 10.
Figure 6.
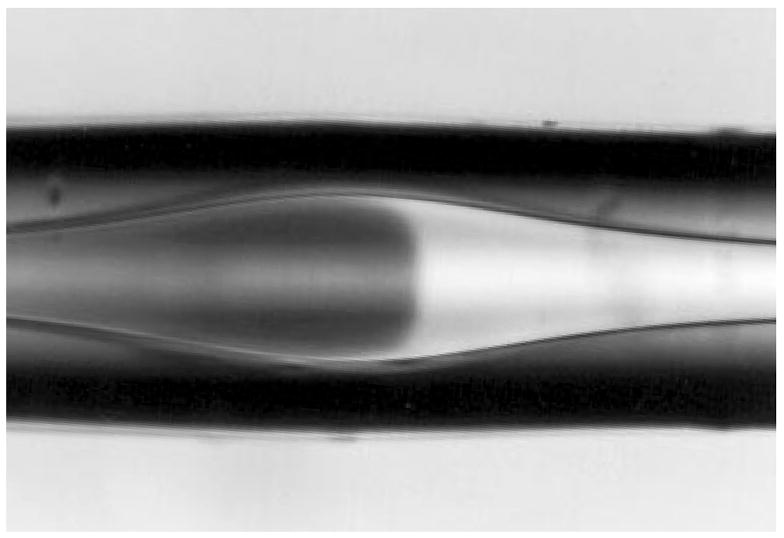
Design of a bubble cell (commercially available from Hewlett-Packard) [34].
Figure 7.
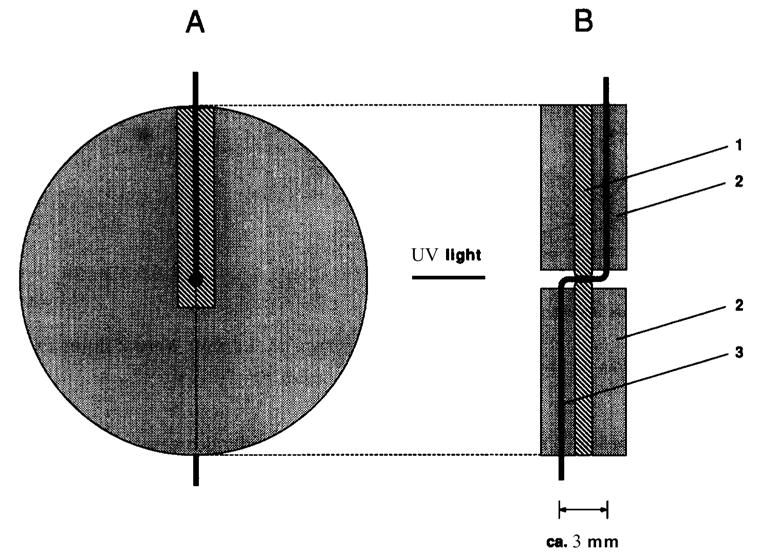
Design of a Z-shaped capillary flow cell: (A) front view; and, (B) cross-sectional view. 1 = Shim (alumina) with centered 300-pm I.D. hole; 2 = plastic disks; 3 = fused-silica capillary of 50-pm or 75-pm I.D., 280-pm O.D. [92].
In addition, some molecules, such as saccharides, do not have UV absorbance, so they cannot be detected by direct UV detection. As a result, alternative detection systems are required.
3.2. Fluorescence detection
Fluorescence offers better sensitivity and selectivity than absorbance because few molecules fluoresce, thus backgrounds are low. The accompanying disadvantage is that there is often a need to derivatize analytes to create a fluorescent species. Notwithstanding this need, fluorescence is extensively used in capillary and chip separations.
Laser-induced fluorescence (LIF) detection has served as a highly sensitive detection scheme in capillary and chip separation systems, with the LODs as low as 10−10–10−12 M. In typical LIF systems, an argon-ion laser (488 nm) is used as the excitation source, and the laser beam is collected and focused by a microscope lens into a photomultiplier tube (PMT) for detection. An aperture and interference filters for rejection of scatter and creation of a confocal system may be used.
LIF detection has been coupled with capillary HPLC. For example, Jung et al. in our group [40,41] developed the photoluminescence- following electron-transfer (PFET) technique to study rat-brain- microdialysis samples with a capillary HPLC system. LODs of about 100 pM for metabolic acids and 200 pM for monoamines were obtained in 500-nL samples. The non- luminescent tris(2,2′-bipyridine)osmium3+ (13+) was reduced to 12+, which, upon laser excitation, luminesced and was detected by PMT. The PFET technique integrates the advantages of both the selectivity obtained by EC reactivity and the sensitivity achieved by fluorescence detection.
LIF detection has been used widely in CE systems to detect derivatized amino acids [42], proteins and peptides [43], and DNA [44]. In recent years, LIF detection has also been introduced into microchip CE (MCE) systems. For example, Mathies’s group [45–49] successfully employed a confocal LIF system to perform at high speed and high throughput on chip DNA sequencing.
Despite impressive performance, the size and the power requirements of LIF are not consistent with the vision of the “lab on a chip ”. The use of light-emitting diodes (LEDs) as a light source has been blooming in recent years due to the ir compact size, low price, low-power consumption and variable detection wavelength. Commercially available LEDs have wavelengths ranging from the UV and visible to the near-infrared regions (350–950 nm). However, they suffer from high-background signals and low-detection efficiency due to the light reflecting and scattering from the capillary surface. The optical fiber has therefore been utilized as a light guide to eliminate the reflecting and scattering, making optical- fiber LED- induced fluorescence (LED-IF) a good detection method in capillary and chip separation systems. Segura-Carretero et al. [50] obtained LODs of 2.6 μM fluorescein, 160 nM FITC- labeled 1,6-diaminohexane, and 2.7 μM gallic acid in an LED-IF-CE system, based on a blue LED (470 nm), a bifurcated optical fiber and a charge-coupled device (CCD) camera. Lin and Cai [51] used an LED- induced fluorescence- microchip electrophoresis (LED-IF-MCE) system to separate and detect catecholamines. As shown in Fig. 8, a 473- nm blue diode laser, focused into an optical fiber, was used as the illumination source while the other end of the optical fiber was inserted into a channel of the chip. The emitted fluorescence passed through a 400-μm diameter pinhole and several filters, and was finally detected by a PMT.
Figure 8.
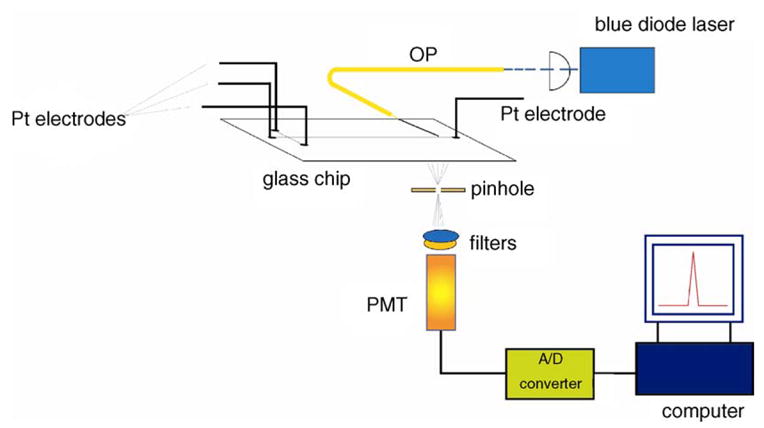
Schematic diagram of a light-emitting-diode-induced-fluorescence microchip capillary electrophoresis (LED-IF-MCE) system [51].
Xiao and co-workers [52] utilized a similar LED-IF-MCE system with a violet or blue LED as the excitation source, and obtained LODs of 17–23 nM for DNA-tagged amino acids and 8–12 nM for FITC-labeled amino acids.
Despite its high sensitivity, the LOD of LED-IF is still lower than that of LIF. The LED source guided by an optical fiber also lacks proper focusing. Efforts have been made to achieve better detection (vide post).
In LIF-MCE and LED-IF-MCE systems, the optical arrangement plays a very important role. There are typically two major types of arrangements in the MCE system, as shown in Fig. 9 (a–f) [53]. The confocal LIF system [45–49,54–56] (Fig. 9a) exhibited high sensitivity in microchip separation.
Figure 9.
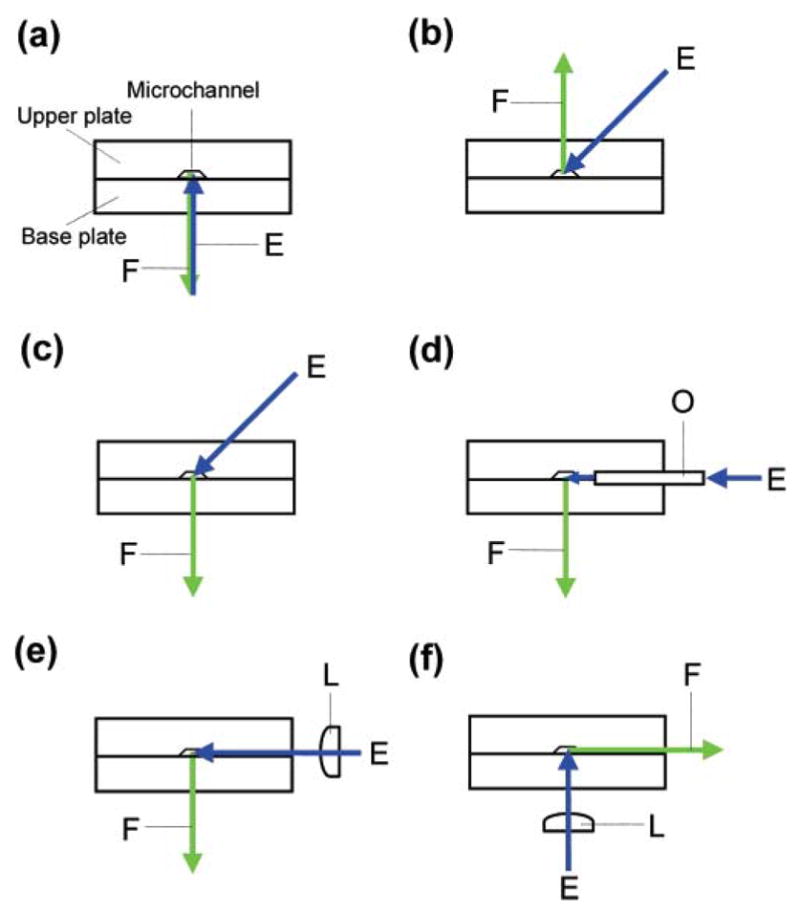
Schematic diagrams of typical optical arrangements of microfluidic chip laser-induced fluorescence (LIF) detection systems: E, excitation source; F, fluorescence; L, lens; O, optical fiber [53].
As shown in Fig. 10, Harrison’s group [54,55] used a confocal LIF system for the determination of fluorescein and cyanine-5 (Cy-5). The laser beam, which was generated by a 635-nm diode laser, was reflected onto the microscope objective by a dichroic mirror and then focused into the chip channel. The excited fluorescence passed through a pinhole and several filters before the PMT. The LOD was 300 fM fluorescein [54] and 9 pM Cy-5 [55].
Figure 10.
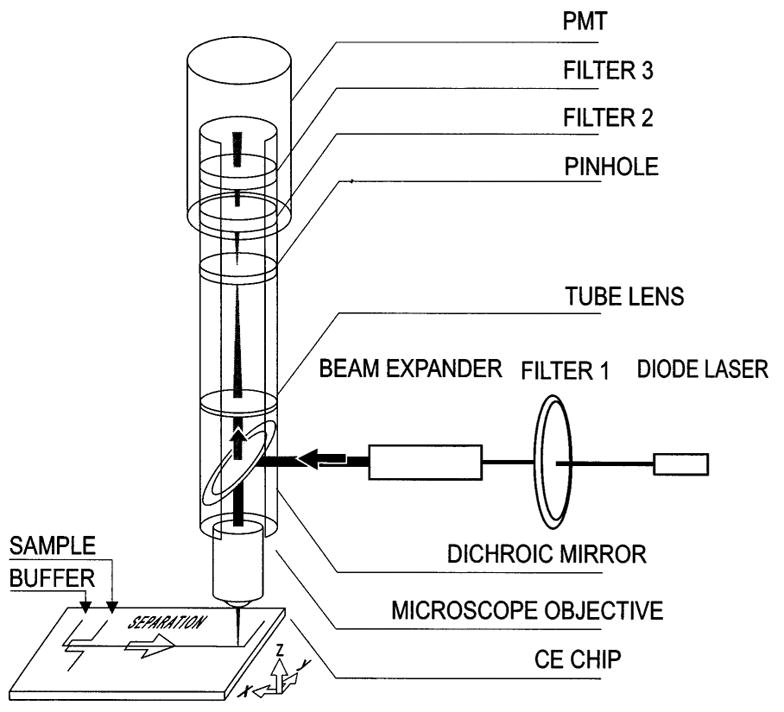
Schematic diagram of the confocal laser-induced-fluorescence microchip capillary electrophoresis (LIF-MCE) system. [55]
Ramsey’s group [56] used an MCE-confocal LIF system, based on an argon-ion laser, a microscope objective, and a single-photon avalanche diode (SPAD), to separate and detect rhodamine 6G and rhodamine B, with the LODs for rhodamine 6G and rhodamine B being 1.7 pM and 8.5 pM, respectively.
In spite of the low LOD achieved in the confocal LIF system, the application of the system in microchip CE is still limited because the whole system is complicated and hard to construct. Also, there is interference from scattering of the beam in these configurations. As a result, non-confocal optical arrangements, including bevel- incident laser and orthogonal optical arrangements, are used; in these, the interference from the excitation light to emitted fluorescence was eliminated. In a bevel- incident laser system [57–62], as shown in Fig. 9(b and c), the laser beam was positioned to minimize scatter while the fluorescence was detected perpendicular to the chip.
Dandliker’s group [60] used a non- focal LIF system (Fig. 11) in which the HeNe laser beam was at 45° to the chip surface, and the emitted fluorescence was then collected and focused perpendicular to the chip surface by a microlens into the photodetector. The LOD for Cy5 solution was 3.3 nM.
Figure 11.
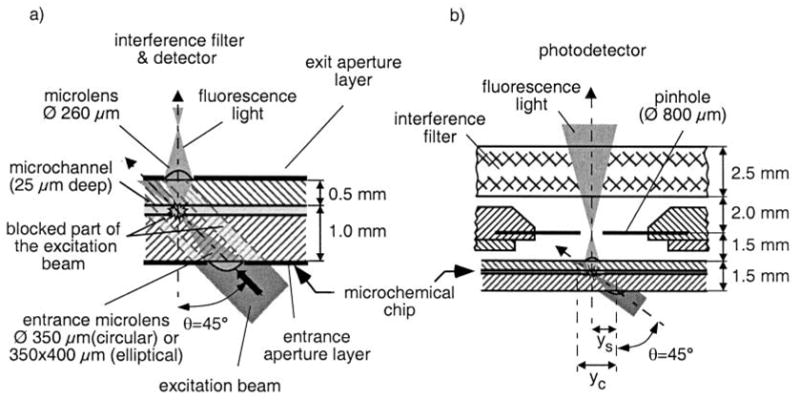
Cross-sectional view of: (a) detection system deposited onto a chip; and, (b) microchemical/microoptical chip, pinhole and interference filter [60].
As for the orthogonal optical arrangement [63–66] (Fig. 9(d–f)), the laser beam was guided by an optical fiber, inserted into the chip channel from a horizontal direction, and the emitted fluorescence was detected in the perpendicular direction with respect to the chip surface.
Fang’s group [53] developed an LIF system based on an orthogonal optical arrangement (Fig. 12). The laser beam was guided and focused into an optical fiber, which was inserted into a microchannel in the microchip, followed by the detection (by PMT) of the excited fluorescence, which was perpendicular to the chip surface. The LOD of fluorescein was 1.1 pM, which paralleled that of confocal LIF systems.
Figure 12.
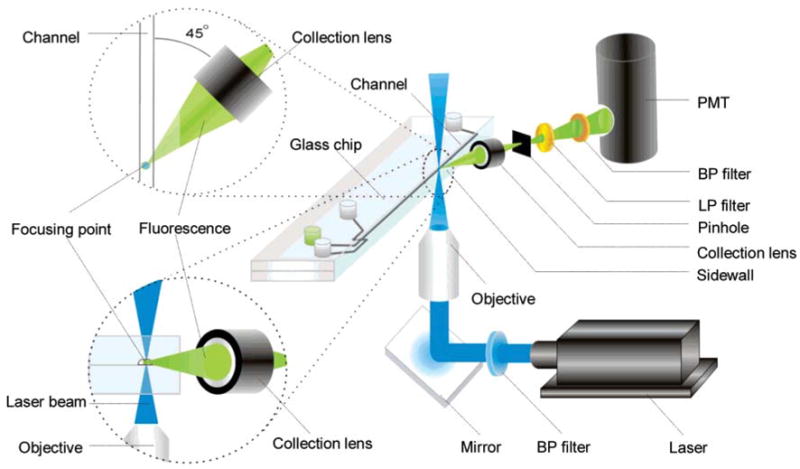
Schematic diagram of the optical arrangement in an orthogonal optical system [53].
3.3. Other luminescence approaches
Chemiluminescence (CL) is defined as the emission of light resulting from a chemical reaction, and bioluminescence (BL) is generated by an enzyme-catalyzed CL reaction. In CL-detection schemes, no light source is required, resulting in low background signal and noise, high S/N ratio and high sensitivity. As a result, CL serves as a good candidate for detection in capillary and chip separations [40,41,67–74]. Several CL reagents have been used (e.g., luminol l [71–73], peroxyoxalate [68,70], and tris(2,2′-bipyridyl)ruthenium (II) [67,74]).
CL has been widely utilized in CE and MCE systems [69]. Liu’s group [75,76] used a CE-CL system based on luminol-NaBrO reaction to detect agmatine in biological tissue samples. As shown in Fig. 13, a four-way tee was used to connect the separation capillary and the reaction capillary, and the CL emission was collected by the PMT, obtaining an LOD of 4.3 μM for agmatine.
Figure 13.
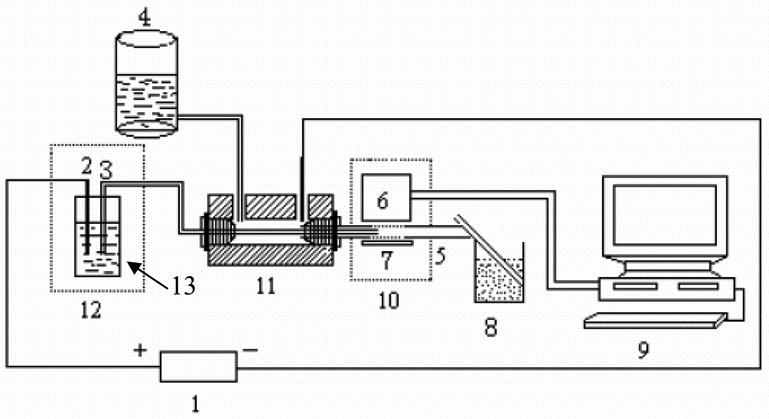
Schematic diagram of the capillary electrophoresis-chemiluminescence (CE -CL) system. (1) High-voltage power; (2) Pt electrode; (3) electrophoretic capillary; (4) CL solution reservoir; (5) reaction capillary; (6) photomultiplier tube (PMT); (7) reflection mirror; (8) waste-solution reservoir; (9) computer; (10) black box; (11) reaction tee; (12) glass cover; and, (13) buffer reservoir. [76]
A novel aerosol CL-CE device, based on the CL emission of saccharides on the surface of porous alumina, has been developed by Zhang’s group [77] for the detection of saccharides. (Fig. 14) The aerosol, which was formed from mixing the CE buffer with a sheath liquid in a T-piece, was sprinkled onto the surface of porous alumina to produce the CL signal.
Figure 14.
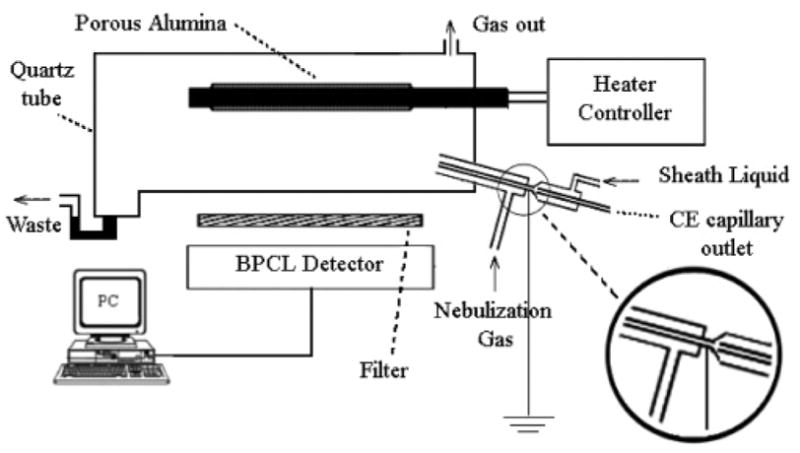
Schematic diagram of the aerosol-cataluminescence-detection system. [77]
A batch-type BL detector (Fig. 15), in conjunction with CE, was utilized by Tsukagoshi and co-workers [78,79] for the determination of biomolecules; the LODs were 10 μM for glutamate, 17 μM for glycylglycine, and 12 μM for hemoglobin, respectively.
Figure 15.
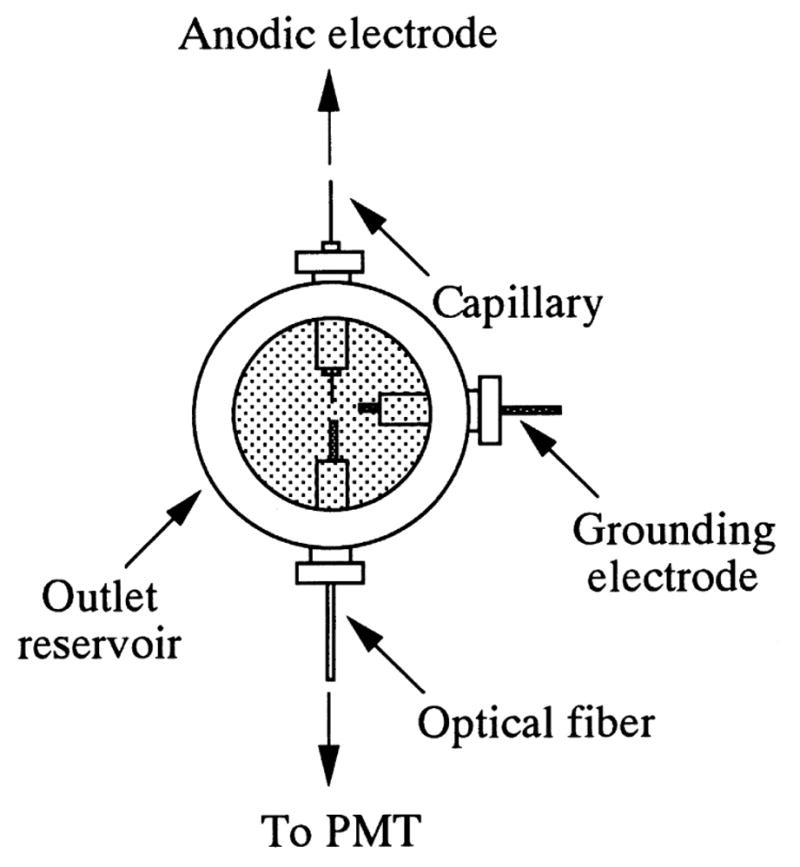
Schematic diagram of chemiluminescence (CL)-detection cell. [78]
Later, Tsukagoshi et al. [80] used a batch-type BL-detection cell to detect ATP using the firefly luciferase reaction, with an LOD of 1 μM ATP.
The major limitation for CL detectors is that few molecules are able to generate CL.
3.4. Liquid-core waveguide
Liquid-core waveguides (LCWs) [81–85] operate by using a channel as a waveguide. This can only work if the liquid in the channel has a higher refractive index (RI) than its surroundings. The LCW technique was first introduced by Fujiwara [84,85] into fluorimetric detection. At that time, no materials had an RI lower than water, so quartz (RI 1.46) was used as the coating material while carbon disulfide (RI 1.63) served as the liquid core. In 1999, with the introduction of Teflon AF (RI 1.29), water (RI 1.33) could be used in this way. Dasgupta et al. [86] initiated the application of Teflon AF as the coating material for LCWs coupled with fluorimetric detection. Since then, more and more researchers have applied the LCW technique in fluorescence detection schemes to decrease the LOD of the system.
Fang and co-workers [82] used an LCW-LED-induced-fluorescence system, comprising a green InGaN LED (520 nm) laser, a Teflon-AF-coated LCW capillary, combined with lock- in amplifier-based detection following PMT detection for DNA-fragment separation and detection, with LODs comparable to those achieved by MCE-LIF systems.
Kostal et al. [83] used an argon- ion laser as an excitation source, a Teflon-AF-coated capillary as LCW and a fiber-coupled CCD as detector for protein detection, in which the LOD was 9 nM.
3.5. Signal-producing reactions
Ramsey’s group [87] used post-column derivatization of amino acids with o-phthaldialdehyde, with LODs of 200 fmol, 130 fmol and 120 fmol for Arg, Glu and Asp, respectively.
Later, Kennedy’s group [88] used a pre-column reactor for the derivatization and obtained LODs of 0.13 fmol, 0.08 fmol and 0.09 fmol for Arg, Glu and Asp, respectively.
Lunte’s group also studied post-column and on-column reactions for the determination of amino acids and peptides.
Andrew et al. [89] utilized both post-column and on-column derivatization of neuropeptides with copper complex followed by UV detection, showing that on-column derivatization afforded better sensitivity than post-column derivatization.
Huynh et al. [90] employed on-column derivatization of amino acids and peptides with 2,3-dicarboxaldehyde and 2-mercaptoethanol followed by LIF detection, achieving LODs 2–3 orders of magnitude higher than the above- mentioned pre-column derivatization by Kennedy’s group.
Recently, Jung et al. in our group [40,41] used a PEFT technique for the detection of metabolic acids and monoamines with tris(2,2′-bipyridine)osmium(III) as the post-column derivatization reagent, and the LODs of about 100 pM for metabolic acids and 200 pM for monoamines were obtained in 500-nL samples of microdialyside from rate brain.
Acknowledgments
We are grateful to the NIH (USA) for financial support through grant R01 GM044842.
Footnotes
Publisher's Disclaimer: This is a PDF file of an unedited manuscript that has been accepted for publication. As a service to our customers we are providing this early version of the manuscript. The manuscript will undergo copyediting, typesetting, and review of the resulting proof before it is published in its final citable form. Please note that during the production process errors maybe discovered which could affect the content, and all legal disclaimers that apply to the journal pertain.
References
- 1.Chicharro M, Moreno M, Bermejo E, Ongay S, Zapardiel A. J Chromatogr. 2005;A 1099:191. doi: 10.1016/j.chroma.2005.08.087. [DOI] [PubMed] [Google Scholar]
- 2.Guo L, Matysik FM, Glaeser P, Engewald W. Electrophoresis. 2005;26:3341. doi: 10.1002/elps.200500188. [DOI] [PubMed] [Google Scholar]
- 3.Chu Q, Fu L, Cao Y, Ye J. Phytochem Anal. 2006;17:176. doi: 10.1002/pca.897. [DOI] [PubMed] [Google Scholar]
- 4.Chen G, Zhang L, Yang P. Anal Sci. 2005;21:1161. doi: 10.2116/analsci.21.1161. [DOI] [PubMed] [Google Scholar]
- 5.Peng Y, Yuan J, Liu F, Ye J. J Pharm Biomed Anal. 2005;39:431. doi: 10.1016/j.jpba.2005.03.033. [DOI] [PubMed] [Google Scholar]
- 6.Cao Y, Wang Y, Ye J. J Pharm Biomed Anal. 2005;39:60. doi: 10.1016/j.jpba.2005.03.006. [DOI] [PubMed] [Google Scholar]
- 7.Peng Y, Yuan J, Ye J. Electroanalysis (NY) 2005;17:1091. [Google Scholar]
- 8.Chu Q, Fu L, Wu T, Ye J. Biomed Chromatogr. 2005;19:149. doi: 10.1002/bmc.431. [DOI] [PubMed] [Google Scholar]
- 9.Chu QC, Cao YH, Peng YY, Fu L, Ye JN. Chromatographia. 2004;60:125. [Google Scholar]
- 10.Wang W, Qiu B, Xu X, Zhang L, Chen G. Electrophoresis. 2005;26:903. doi: 10.1002/elps.200406099. [DOI] [PubMed] [Google Scholar]
- 11.Xu X, Yu L, Chen G. J Pharm Biomed Anal. 2006;41:493. doi: 10.1016/j.jpba.2006.01.013. [DOI] [PubMed] [Google Scholar]
- 12.Huebner J, Nguyen A, Turcu F, Melchior D, Kling HW, Gaeb S, Schmitz OJ. Anal Bioanal Chem. 2006;384:259. doi: 10.1007/s00216-005-0164-9. [DOI] [PubMed] [Google Scholar]
- 13.Roach DM, Hooper SE, Anderson MR. Electroanalysis (NY) 2005;17:2254. [Google Scholar]
- 14.Paxon TL, Powell PR, Lee HG, Han KA, Ewing AG. Anal Chem. 2005;77:5349. doi: 10.1021/ac050474m. [DOI] [PMC free article] [PubMed] [Google Scholar]
- 15.Powell PR, Paxon TL, Han KA, Ewing AG. Anal Chem. 2005;77:6902. doi: 10.1021/ac050963m. [DOI] [PMC free article] [PubMed] [Google Scholar]
- 16.Beisler AT, Sahlin E, Schaefer KE, Weber SG. Anal Chem. 2004;76:639. doi: 10.1021/ac034785d. [DOI] [PMC free article] [PubMed] [Google Scholar]
- 17.Sahlin E, Beisler AT, Woltman SJ, Weber SG. Anal Chem. 2002;74:4566. doi: 10.1021/ac025622c. [DOI] [PMC free article] [PubMed] [Google Scholar]
- 18.Shen H, Witowski SR, Boyd BW, Kennedy RT. Anal Chem. 1999;71:987. doi: 10.1021/ac9809837. [DOI] [PubMed] [Google Scholar]
- 19.Sun X, Jin W, Li D, Bai Z. Electrophoresis. 2004;25:1860. doi: 10.1002/elps.200305813. [DOI] [PubMed] [Google Scholar]
- 20.Chicharro M, Sanchez A, Bermejo E, Zapardiel A, Rubianes MD, Rivas GA. Anal Chim Acta. 2005;543:84. [Google Scholar]
- 21.Chicharro M, Sanchez A, Zapardiel A, Rubianes MD, Rivas G. Anal Chim Acta. 2004;523:185. [Google Scholar]
- 22.Xing X, Cao Y, Wang L. J Chromatogr. 2005;A 1072:267. doi: 10.1016/j.chroma.2005.03.043. [DOI] [PubMed] [Google Scholar]
- 23.Wang J, Chen G, Chatrathi MP. Electroanalysis (NY) 2004;16:1603. [Google Scholar]
- 24.Wang Y, Chen H. J Chromatogr. 2005;A 1080:192. doi: 10.1016/j.chroma.2005.05.032. [DOI] [PubMed] [Google Scholar]
- 25.Schoening MJ, Jacobs M, Muck A, Knobbe DT, Wang J, Chatrathi M, Spillmann S. Sens Actuators. 2005;B108:688. [Google Scholar]
- 26.Horng RH, Han P, Chen HY, Lin KW, Tsai TM, Zen JM. J Micromech Microeng. 2005;15:6. [Google Scholar]
- 27.Collier A, Wang J, Diamond D, Dempsey E. Anal Chim Acta. 2005;550:107. [Google Scholar]
- 28.Wang J, Zima J, Lawrence NS, Chatrathi MP, Mulchandani A, Collins GE. Anal Chem. 2004;76:4721. doi: 10.1021/ac049658b. [DOI] [PubMed] [Google Scholar]
- 29.Shin D, Tryk DA, Fujishima A, Muck A, Jr, Chen G, Wang J. Electrophoresis. 2004;25:3017. doi: 10.1002/elps.200305965. [DOI] [PubMed] [Google Scholar]
- 30.Shiddiky MJA, Park DS, Shim YB. Electrophoresis. 2005;26:4656. doi: 10.1002/elps.200500447. [DOI] [PubMed] [Google Scholar]
- 31.He FY, Liu AL, Xia XH. Anal Bioanal Chem. 2004;379:1062. doi: 10.1007/s00216-004-2680-4. [DOI] [PubMed] [Google Scholar]
- 32.Liu AL, He FY, Hu YL, Xia XH. Talanta. 2006;68:1303. doi: 10.1016/j.talanta.2005.07.043. [DOI] [PubMed] [Google Scholar]
- 33.Wang K, Xia XH, Chromatogr J. 2006;A 1110:222. doi: 10.1016/j.chroma.2006.01.056. [DOI] [PubMed] [Google Scholar]
- 34.Hempel G. Electrophoresis. 2000;21:691. doi: 10.1002/(SICI)1522-2683(20000301)21:4<691::AID-ELPS691>3.0.CO;2-U. [DOI] [PubMed] [Google Scholar]
- 35.Tomlinson AJ, Benson LM, Guzman NA, Naylor S. J Chromatogr. 1996;A 744:3. [Google Scholar]
- 36.Osbourn DM, Weiss DJ, Lunte CE. Electrophoresis. 2000;21:2768. doi: 10.1002/1522-2683(20000801)21:14<2768::AID-ELPS2768>3.0.CO;2-P. [DOI] [PMC free article] [PubMed] [Google Scholar]
- 37.Shihabi ZK, Deyl Z. J Chromatogr. 2000;A 902:1. doi: 10.1016/s0021-9673(00)00743-3. [DOI] [PubMed] [Google Scholar]
- 38.Blanco E, Casais MC, Mejuto MC, Cela R. J Chromatogr. 2005;A 1071:205. doi: 10.1016/j.chroma.2004.10.075. [DOI] [PubMed] [Google Scholar]
- 39.Huhn C, Neusuess C, Pelzing M, Pyell U, Mannhardt J, Puetz M. Electrophoresis. 2005;26:1389. doi: 10.1002/elps.200410163. [DOI] [PubMed] [Google Scholar]
- 40.Jung MC, Shi G, Borland L, Michael AC, Weber SG. Anal Chem. 2006;78:1755. doi: 10.1021/ac051183g. [DOI] [PMC free article] [PubMed] [Google Scholar]
- 41.Jung MC, Munro N, Shi G, Michael AC, Weber SG. Anal Chem. 2006;78:1761. doi: 10.1021/ac051182o. [DOI] [PMC free article] [PubMed] [Google Scholar]
- 42.Poinsot V, Lacroix M, Maury D, Chataigne G, Feurer B, Couderc F. Electrophoresis. 2006;27:176. doi: 10.1002/elps.200500512. [DOI] [PubMed] [Google Scholar]
- 43.Lacroix M, Poinsot V, Fournier C, Couderc F. Electrophoresis. 2005;26:2608. doi: 10.1002/elps.200410414. [DOI] [PubMed] [Google Scholar]
- 44.Lin YW, Chiu TC, Chang HT. Chromatogr JB. 2003;793:37. doi: 10.1016/s1570-0232(03)00363-5. [DOI] [PubMed] [Google Scholar]
- 45.Medintz IL, Paegel BM, Mathies RA. J Chromatogr. 2001;A 924:265. doi: 10.1016/s0021-9673(01)00852-4. [DOI] [PubMed] [Google Scholar]
- 46.Woolley AT, Sensabaugh GF, Mathies RA. Anal Chem. 1997;69:2181. doi: 10.1021/ac961237+. [DOI] [PubMed] [Google Scholar]
- 47.Woolley AT, Mathies RA. Proc Natl Acad Sci USA. 1994;91:11348. doi: 10.1073/pnas.91.24.11348. [DOI] [PMC free article] [PubMed] [Google Scholar]
- 48.Haab BB, Mathies RA. Anal Chem. 1999;71:5137. doi: 10.1021/ac990644t. [DOI] [PubMed] [Google Scholar]
- 49.Ju J, Kheterpal I, Scherer JR, Ruan C, Fuller CW, Glazer AN, Mathies RA. Anal Biochem. 1995;231:131. doi: 10.1006/abio.1995.1512. [DOI] [PubMed] [Google Scholar]
- 50.Arraez-Roman D, Fernandez-Sanchez JF, Cortacero-Ramirez S, Segura-Carretero A, Fernandez-Gutierrez A. Electrophoresis. 2006;27:1776. doi: 10.1002/elps.200500701. [DOI] [PubMed] [Google Scholar]
- 51.Li HF, Cai Z, Lin JM. Anal Chim Acta. 2006;565:183. [Google Scholar]
- 52.Zhao S, Yuan H, Xiao D. Electrophoresis. 2006;27:461. doi: 10.1002/elps.200500300. [DOI] [PubMed] [Google Scholar]
- 53.Fu JL, Fang Q, Zhang T, Jin XH, Fang ZL. Anal Chem. 2006;78:3827. doi: 10.1021/ac060153q. [DOI] [PubMed] [Google Scholar]
- 54.Ocvirk G, Tang T, Jed Harrison D. Analyst (Cambridge, UK) 1998;123:1429. [Google Scholar]
- 55.Jiang G, Attiya S, Ocvirk G, Lee WE, Harrison DJ. Biosens Bioelectron. 2000;14:861. doi: 10.1016/s0956-5663(99)00056-1. [DOI] [PubMed] [Google Scholar]
- 56.Fister JC, III, Jacobson SC, Davis LM, Ramsey JM. Anal Chem. 1998;70:431. doi: 10.1021/ac9707242. [DOI] [PubMed] [Google Scholar]
- 57.Fang Q, Xu GM, Fang ZL. Anal Chem. 2002;74:1223. doi: 10.1021/ac010925c. [DOI] [PubMed] [Google Scholar]
- 58.Fister JC, III, Jacobson SC, Ramsey JM. Anal Chem. 1999;71:4460. [Google Scholar]
- 59.Jacobson SC, Ramsey JM. Anal Chem. 1996;68:720. doi: 10.1021/ac951230c. [DOI] [PubMed] [Google Scholar]
- 60.Roulet JC, Voelkel R, Herzig HP, Verpoorte E, de Rooij NF, Daendliker R. Anal Chem. 2002;74:3400. doi: 10.1021/ac0112465. [DOI] [PubMed] [Google Scholar]
- 61.Sanders JC, Huang Z, Landers JP. Lab Chip. 2001;1:167. doi: 10.1039/b107835f. [DOI] [PubMed] [Google Scholar]
- 62.Schrum DP, Culbertson CT, Jacobson SC, Ramsey JM. Anal Chem. 1999;71:4173. doi: 10.1021/ac990372u. [DOI] [PubMed] [Google Scholar]
- 63.Liang Z, Chiem N, Ocvirk G, Tang T, Fluri K, Harrison DJ. Anal Chem. 1996;68:1040. doi: 10.1021/ac9604090. [DOI] [PubMed] [Google Scholar]
- 64.Li HF, Lin JM, Su RG, Uchiyama K, Hobo T. Electrophoresis. 2004;25:1907. doi: 10.1002/elps.200305867. [DOI] [PubMed] [Google Scholar]
- 65.Chabinyc ML, Chiu DT, McDonald JC, Stroock AD, Christian JF, Karger AM, Whitesides GM. Anal Chem. 2001;73:4491. doi: 10.1021/ac010423z. [DOI] [PubMed] [Google Scholar]
- 66.Camou S, Fujita H, Fujii T. Lab Chip. 2003;3:40. doi: 10.1039/b211280a. [DOI] [PubMed] [Google Scholar]
- 67.Barnett NW, Hindson BJ, Lewis SW, Purcell SD. Anal Commun. 1998;35:321. [Google Scholar]
- 68.Hashimoto M, Tsukagoshi K, Nakajima R, Kondo K, Arai A. J Chromatogr. 2000;A 867:271. doi: 10.1016/s0021-9673(99)01169-3. [DOI] [PubMed] [Google Scholar]
- 69.Huang X, Ren J. Trends Anal Chem. 2006;25:155. [Google Scholar]
- 70.Kuyper C, Denham K, Dickson J, Murray J, Milofsky R. Chromatographia. 2001;53:173. [Google Scholar]
- 71.Liu EB, Liu YM, Cheng JK. Anal Chim Acta. 2001;443:101. [Google Scholar]
- 72.Liu EB, Liu YM, Cheng JK. Anal Chim Acta. 2002;456:177. [Google Scholar]
- 73.Liu YM, Liu EB, Cheng JK, Chromatogr J. 2001;A 939:91. doi: 10.1016/s0021-9673(01)01329-2. [DOI] [PubMed] [Google Scholar]
- 74.Tsukagoshi K, Okuzono N, Nakajima R. J Chromatogr. 2002;A 958:283. doi: 10.1016/s0021-9673(02)00321-7. [DOI] [PubMed] [Google Scholar]
- 75.Zhao S, Xie C, Lu X, Liu YM. J Chromatogr. 2006;B 832:52. doi: 10.1016/j.jchromb.2005.12.026. [DOI] [PubMed] [Google Scholar]
- 76.Zhao SL, Xie C, Lu X, Song YR, Liu YM. Electrophoresis. 2005;26:1745. doi: 10.1002/elps.200410338. [DOI] [PubMed] [Google Scholar]
- 77.Huang G, Lv Y, Zhang S, Yang C, Zhang X. Anal Chem. 2005;77:7356. doi: 10.1021/ac0511290. [DOI] [PubMed] [Google Scholar]
- 78.Hashimoto M, Tsukagoshi K, Nakajima R, Kondo K. J Chromatogr. 1999;A 832:191. doi: 10.1016/s0021-9673(99)00645-7. [DOI] [PubMed] [Google Scholar]
- 79.Tsukagoshi K, Nakahama K, Nakajima R. Anal Chem. 2004;76:4410. doi: 10.1021/ac030344i. [DOI] [PubMed] [Google Scholar]
- 80.Tsukagoshi K, Tahira M, Nakajima R. J Chromatogr. 2005;A 1094:192. doi: 10.1016/j.chroma.2005.09.048. [DOI] [PubMed] [Google Scholar]
- 81.Wang SL, Fang ZL. Anal Bioanal Chem. 2005;382:1747. doi: 10.1007/s00216-005-3298-x. [DOI] [PubMed] [Google Scholar]
- 82.Wang SL, Fan XF, Xu ZR, Fang ZL. Electrophoresis. 2005;26:3602. doi: 10.1002/elps.200500139. [DOI] [PubMed] [Google Scholar]
- 83.Kostal V, Zeisbergerova M, Slais K, Kahle V. Chromatogr J A. 2005;1081:36. doi: 10.1016/j.chroma.2005.05.039. [DOI] [PubMed] [Google Scholar]
- 84.Fujiwara K, Simeonsson JB, Smith BW, Winefordner JD. Anal Chem. 1988;60:1065. doi: 10.1021/ac00161a023. [DOI] [PubMed] [Google Scholar]
- 85.Fujiwara K, Ito S. Trends Anal Chem. 1991;10:184. [Google Scholar]
- 86.Dasgupta PK, Zhang G, Li J, Boring CB, Jambunathan S, Al-Horr R. Anal Chem. 1999;71:1400. doi: 10.1021/ac981260q. [DOI] [PubMed] [Google Scholar]
- 87.Jacobson SC, Koutny LB, Hergenroder R, Moore AW, Ramsey JM. Anal Chem. 1994;66:3472. [Google Scholar]
- 88.Sandlin ZD, Shou MS, Shackman JG, Kennedy RT. Anal Chem. 2005;77:7702. doi: 10.1021/ac051044z. [DOI] [PubMed] [Google Scholar]
- 89.Gawron AJ, Lunte SM. Electrophoresis. 2000;21:2067. doi: 10.1002/1522-2683(20000601)21:10<2067::AID-ELPS2067>3.0.CO;2-5. [DOI] [PubMed] [Google Scholar]
- 90.Huynh BH, Fogarty BA, Nandi P, Lunte SM. J Pharm Bio med Anal. 2006;42:529. doi: 10.1016/j.jpba.2006.05.014. [DOI] [PubMed] [Google Scholar]
- 91.Sloss S, Ewing AG. Anal Chem. 1993;65:577. [Google Scholar]
- 92.Chervet JP, Van Soest REJ, Ursem M. J Chromatogr. 1991;A 543:439. [Google Scholar]