

Abstract
Background
Community levels of air pollution have been associated with variability in mortality rates, but previous studies have inferred exposure to pollutants on a citywide basis. We investigated mortality in relation to neighbourhood levels of income and air pollution in an urban area.
Methods
We identified 5228 people in the Hamilton–Burlington area of southern Ontario who had been referred for pulmonary function testing between 1985 and 1999. Nonaccidental deaths that occurred in this group between 1992 and 1999 were ascertained from the Ontario Mortality Registry. Mean household income was estimated by linking the subjects' postal codes with the 1996 census. Mean neighbourhood levels of total suspended particulates and sulfur dioxide were estimated by interpolation from data from a network of sampling stations. We used proportional hazards regression models to compute mortality risk in relation to income and pollutant levels, while adjusting for pulmonary function, body mass index and diagnoses of chronic disease. Household incomes and pollutant levels were each divided into 2 risk categories (low and high) at the median.
Results
Mean pollutant levels tended to be higher in lower-income neighbourhoods. Both income and pollutant levels were associated with mortality differences. Compared with people in the most favourable category (higher incomes and lower particulate levels), those with all other income–particulate combinations had a higher risk of death from nonaccidental causes (lower incomes and higher particulate levels: relative risk [RR] 2.62, 95% confidence interval [CI] 1.67–4.13; lower incomes and lower particulate levels: RR 1.82, 95% CI 1.30–2.55; higher incomes and higher particulate levels: RR 1.33, 95% CI 1.12–1.57). Similar results were observed for sulfur dioxide. The relative risk was lower at older ages.
Interpretation
Mortality rates varied by neighbourhood of residence in this cohort of people whose lung function was tested. Two of the broader determinants of health — income and air pollution levels — were important correlates of mortality in this population.
In the past decade, the concept of environmental justice has received increased attention.1,2 This concept refers to the possibility of inequitable distribution of environmental hazards by socioeconomic class or race. One such hazard — community levels of air pollution — is associated with variability in mortality rates. Significant associations between air pollution and mortality were observed in a comparison of 6 American cities.3 In a study involving respondents to an American Cancer Society survey,4 data on ambient air pollution from 151 metropolitan areas in the United States were linked to data on individual risk factors for 552 138 adults. During 16 years of follow-up, exposure to fine particulate matter and sulfur-oxide–related pollution was associated with death from all causes, lung cancer and cardiopulmonary disease. The authors estimated that mortality risk associated with fine particulate air pollution at levels found in more polluted US cities was comparable to that associated with being moderately overweight.
In each of these studies, pollution was measured at central sampling stations, and all residents were assigned the same exposure level. One might suspect that exposure to air pollution would vary with socioeconomic status. For example, residents of poorer neighbourhoods might be closer to point sources of industrial pollution or be exposed to greater amounts of vehicular emissions from higher traffic density.5 We hypothesized that there would be intra-urban variability in mortality associated with socioeconomic status and pollution exposure. To test this hypothesis, we followed a cohort of residents in the Hamilton–Burlington area of southern Ontario.
Methods
The study group comprised residents of Hamilton and Burlington who had been referred for pulmonary function testing between 1985 and 1999 at the Firestone Institute for Respiratory Health in Hamilton. They included people referred for specialist assessment and those referred for spirometry testing only. Information available in the database of the pulmonary function testing laboratory included Ontario Health Insurance number, postal code, age, sex, body mass index (BMI) and pulmonary function test measures, including forced vital capacity (FVC) and forced expiratory volume in the first second (FEV1). Smoking history was not recorded. Predicted FVC and FEV1 volumes were computed using the equations in Neas and Schwartz.6 The Ontario Health Insurance number was used to link people with Ontario Health Insurance Plan (OHIP) billing files for 1992–1999. (Ontario replaced family-based medicare numbers with personal health insurance numbers in 1992.)
Mortality was monitored beginning Jan. 1, 1992, or the date of the subject's first visit to the Firestone Institute, whichever was later. To ensure that all subjects were alive at the start of follow-up, we excluded 64 people without an OHIP transaction after 1991. Deaths occurring in the cohort between 1992 and 1999 were ascertained from the Ontario Mortality Registry. Because only 27 deaths occurred among people under 40 years of age, the study was limited to people aged 40 years and over. We excluded 22 deaths from accidental causes. In addition, we excluded people with cancer diagnosed either before or within 45 days after the initial visit. This left 5228 people available for analysis of the initial 13 863. This study was approved by the Research Ethics Board at St. Joseph's Healthcare, Hamilton.
OHIP records were used to classify underlying respiratory disease status through the diagnostic codes submitted by specialist physicians (International Classification of Diseases, ninth revision7 [ICD-9] codes 491, 492 and 496 [chronic obstructive pulmonary disease (COPD)], 493 [asthma], 494 [bronchiectasis], 501 [asbestosis], 502 [silicosis] and 515 [postinflammatory pulmonary fibrosis]). The OHIP records and the Ontario hospital discharge database were also searched for diagnoses of diabetes mellitus (ICD-9 code 250) and chronic ischemic heart disease (ICD-9 codes 412–414). Patients were classified with these disorders if the diagnosis had been made in 2 or more claim submissions by a general practitioner, 1 claim submission by a specialist or in any admission to hospital.
Postal codes were used in the estimation of household income and air pollution levels. The ArcView geographic information system (version 3.2; ESRI, Redlands, Calif.) was used with the Statistics Canada 1999 postal code conversion file; locations were related to mean household income estimated in enumeration-area data gathered in the 1996 census. The ArcView geographic information system was also used to estimate mean air pollutant levels in the vicinity of the patients' residences. The spatial domain was limited to the Hamilton–Burlington urban airshed. Available pollution data were 24-hour measurements of total suspended particulates (1992–1994), sampled every sixth day in accordance with the North American synoptic cycle, and mean daily sulfur dioxide levels (1993–1995), calculated from continuous hourly measurements (see Appendix 1 for a description of these pollutants). We used pollution data for only these 3 years because it was a period when the Ontario Ministry of the Environment's monitoring network in the Hamilton–Burlington urban airshed had the maximum number of monitoring stations (9 for sulfur dioxide and 23 for total suspended particulates).
Levels of both pollutants are known to decrease outward from the heavy industrial zone in north-central and northeastern Hamilton.8 To model the pollution concentration gradients more accurately in peripheral areas, data from the Ministry of the Environment's monitoring stations in neighbouring municipalities were also used, increasing the total number of stations to 19 for sulfur dioxide and 29 for total suspended particulates. Universal kriging — a stochastic geostatistical method that takes into account spatial dependence9 — was used for spatial interpolation between monitoring stations. GS+ geostatistics software (version 2.1; Gamma Design Software, Plainwell, Mich.) was used to generate the interpolation estimates. The 3-year means were applied to the entire observation period, 1992–1999.
The Cox proportional hazards model10 was used to model risk of death from nonaccidental causes and from cardiopulmonary disease (ICD-9 codes 401–440 and 480–519). The Cox models were stratified by sex and 5-year age groups to allow a baseline hazard measure for each category. Interactions between independent and stratification variables were examined. Model diagnostics included examination of Cox–Snell residuals and the assumption of proportional hazards. Cox regression analysis gives hazard ratios (relative instantaneous risk of death) as outputs; in this report, we refer to these as relative risks.
The study population was not a random sample of residents of Hamilton–Burlington municipalities, and there may have been a geographic selection bias, although subjects were drawn from throughout the Hamilton–Burlington region (Fig. 1). To account for possible clustering of mortality rates in neighbourhoods, we used the Hamilton neighbourhood definitions derived by Luginaah and colleagues11 to adjust the estimates of variance for clustering in neighbourhoods. Calculations were performed with the use of the Stata Statistical Software (version 7.0, Stata Corp., College Station, Tex.).
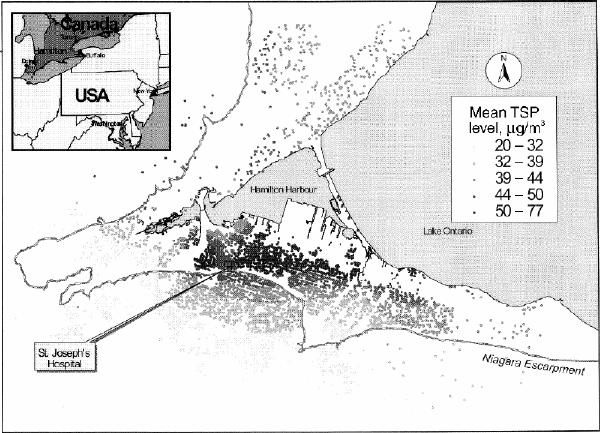
Fig. 1: Distribution of residence locations of the study population in the Hamilton–Burlington municipalities in southern Ontario. Shading shows the estimated mean levels of total suspended particulates (TSP) by residence location (the distribution of the mean levels of sulfur dioxide by residence location was qualitatively similar).
Results
Study population, household income and pollution levels
Of the 5228 study subjects, 626 died during the follow-up period, 604 of nonaccidental causes. Of the respiratory disease diagnoses derived from the OHIP records, COPD was diagnosed in 2035 subjects (431 died), asthma in 604 (28 died), bronchiectasis in 141 (31 died), asbestosis in 39 (4 died), silicosis in 24 (3 died) and postinflammatory pulmonary fibrosis in 240 (75 died). Those with diagnoses of both asthma and COPD were classified in the COPD group. Because there were only 21 deaths among subjects with only asthma, and because preliminary analysis showed that their relative risk of death was similar to that of people without a respiratory diagnosis, people with only asthma and those without a respiratory diagnosis were classified in one group. In this article, we refer to all chronic pulmonary diseases, excluding asthma, as CPD.
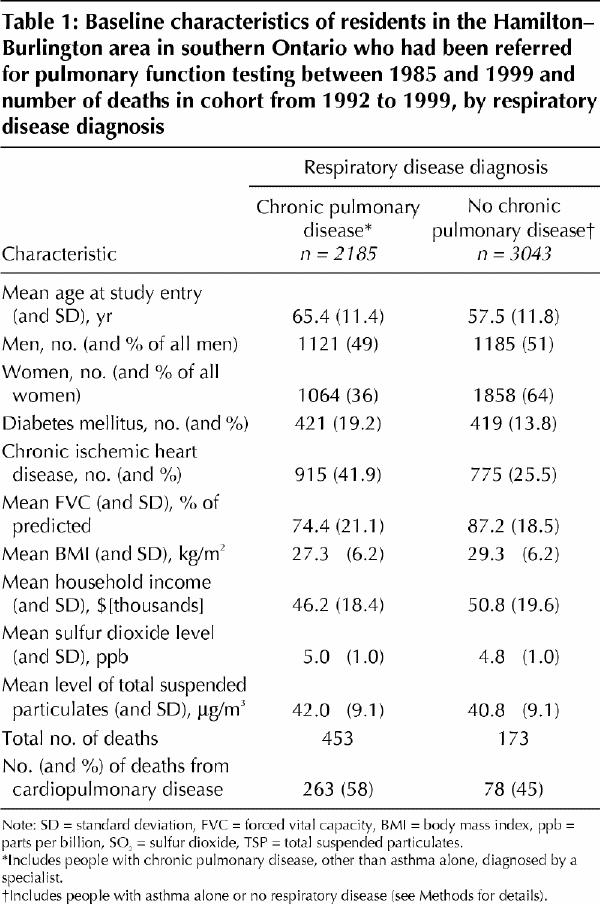
The distribution of the study population by respiratory disease diagnosis is shown in Table 1, along with mean values of clinical and spatial variables. About half of the cohort did not have CPD or asthma diagnosed by a specialist. On average, subjects with CPD were older, had poorer lung function and a lower BMI than those without CPD. Those with CPD were estimated to have lower household income, consistent with the inverse relation between smoking prevalence and income.12 Exposure to pollutants of those with CPD was similar to that of people without CPD.
Table 1
The distribution of mean levels of total suspended particulates by residence location of the study population is shown in Fig. 1. The distributions of the estimated concentrations of total suspended particulates and sulfur dioxide (Fig. 2, top panel) reveal mean, median and interquartile ranges of 41.3, 40.8 and 13.0 μg/m3 respectively for total suspended particulates, and 4.9, 4.6 and 1.3 parts per billion for sulfur dioxide. The graphs in the bottom panel of Fig. 2 show the relation between pollutant levels and income (the solid lines are means estimated with the use of a locally weighted regression [LOESS] smoother13): the mean pollutant levels tended to be higher in the lower-income neighbourhoods.
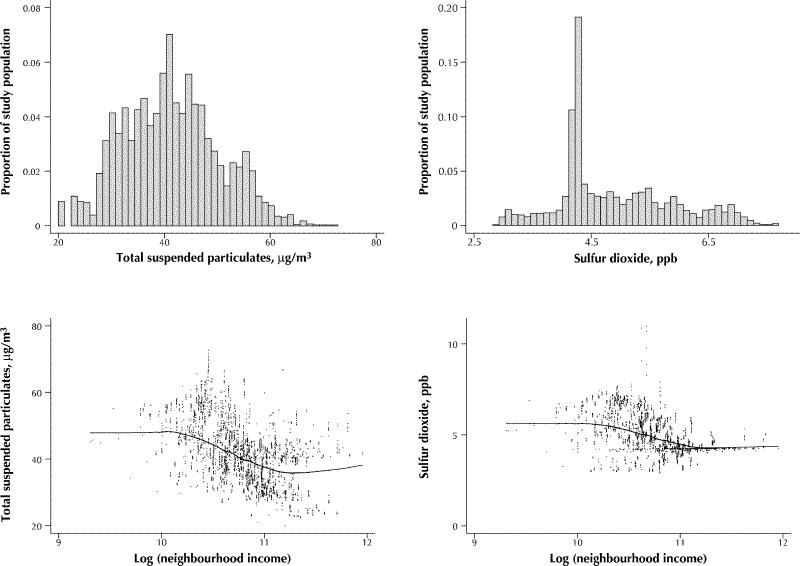
Fig. 2: Top panel: Distribution of mean levels of total suspended particulates and sulfur dioxide in study population. Bottom panel: Relation between mean levels of pollutants and household income; solid lines are means estimated with the use of locally weighted regression (LOESS) smoother.13
Mortality in relation to household income and pollution levels
To investigate the relations between mortality, income and pollution levels, we divided the study population into those above and those below the median for household income and for level of the 2 pollutants measured. Cox models for death from nonaccidental causes and from cardiopulmonary disease were applied using these variables (Table 2). All models were adjusted for age, sex, FVC, FEV1, BMI, the square of BMI, and diagnoses of CPD, ischemic heart disease and diabetes. There were no significant violations of the proportional hazards assumption.
Table 2
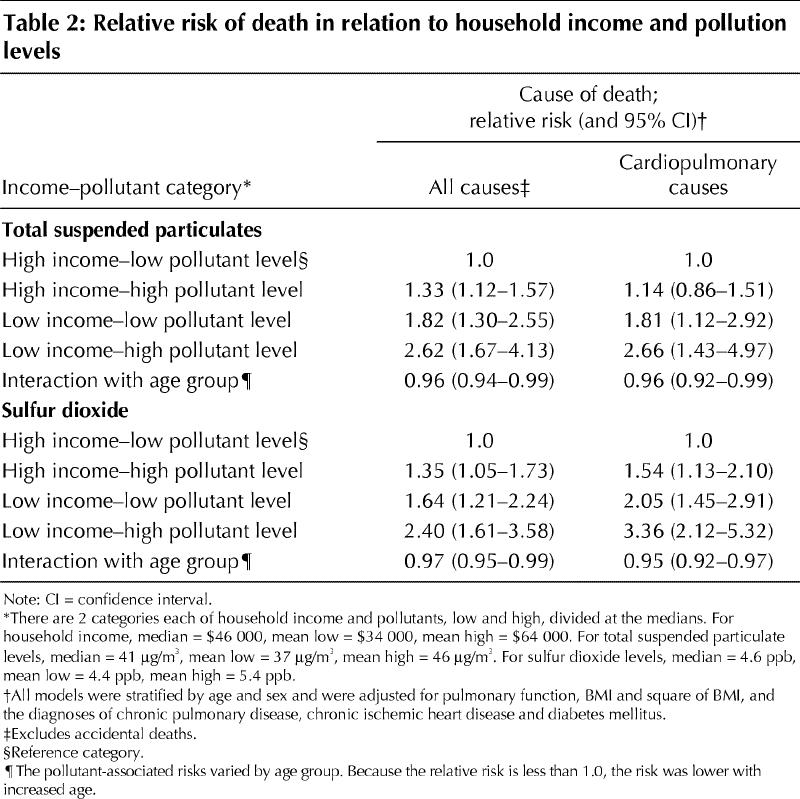
The reference category was the most favourable one (i.e., above the median income level and below the median pollution level). Subjects with all other income–pollutant combinations had a higher risk of death than those in the reference category (Table 2). In all models, age was a significant effect modifier. The interaction term was less than 1.0, so that the relative risk was lower with increased age. Both income and exposure to pollutants were associated with differences in mortality. If income is constant, either high or low, then those living in neighbourhoods with above-median pollution levels had higher mortality rates than those in neighbourhoods with below-median levels.
We computed the relative risk of death from nonaccidental causes by income category. Among people with below-median income, the relative risk for those with above-median exposure to total suspended particulates was 1.14 (95% confidence interval [CI] 1.07–1.20) and for those with above-median exposure to sulfur dioxide 1.18 (95% CI 1.11–1.26); the corresponding relative risks among subjects with above-median income were 1.04 (95% CI 1.01–1.06) and 1.03 (95% CI 0.83–1.28). Similarly, if pollutant category is held constant, then people in neighbourhoods with below-median income had higher mortality rates than those in neighbourhoods with above-median income. The highest mortality rates were observed among people with below-median income and above-median pollution exposure.
Because of the effect modification by age, relative risk was not independent of age but was highest among the youngest subjects.
Interpretation
Mortality rates in a cohort of patients undergoing pulmonary function testing in Hamilton, Ont., varied by location of residence. After adjustment for age, sex, lung function, BMI and the diagnosis of chronic diseases, we found that people living in lower-income neighbourhoods had higher mortality rates than those living in wealthier neighbourhoods.
Explanations for income-associated differences in mortality include biological and sociological factors. Surveys have found that lower-income Canadians have the highest prevalence of cardiovascular risk factors, particularly smoking and excess weight.14 We did not have information about individual smoking habits and attempted adjustment for biological risk factors by controlling for BMI, lung function and the diagnosis of chronic diseases. Dockery and associates15 reported that “smokers suffer an irreversible loss of FVC and FEV1, which is described by a linear function of their cumulative cigarette smoking as measured in pack-years.”
We believe that inclusion of lung function and the diagnosis of chronic pulmonary and ischemic heart diseases controls for much of the effect of smoking. However, it is likely that some residual confounding of the income–mortality relation remains.
Raphael16 has argued that the most important factors pertaining to income-associated differences in mortality are the broader determinants of health, including education, employment, and physical and social environments. In the Hamilton–Burlington urban airshed, we found an association between income and estimated air pollution exposure in the vicinity of the study population's residences. People living in lower-income neighbourhoods tended to have higher mean levels of pollution exposure than those living in higher-income neighbourhoods. Those living in neighbourhoods with above-median levels of particulate and sulfur dioxide air pollution had higher mortality rates than those living in neighbourhoods with below-median levels of such pollution.
Our study population, derived from the database of a lung function testing laboratory, was enriched with subjects with CPD. It has been suggested that people with COPD are more susceptible to the effects of acute increases in levels of air pollution.17 In our population, the relative risk of death for those with CPD was 1.4 in the Cox regression analysis; however, the mortality risk associated with residence in neighbourhoods with long-term exposure to above-median levels of air pollution was independent of underlying CPD status.
Although our patients were not a randomly selected sample of the population, we believe that our results can be generalized. The variability of mortality rates by socioeconomic status has been observed elsewhere in Canada.18 The variation of pollution levels by neighbourhood income in Hamilton was independent of the identities of people in our study population. Neither of the American air pollution cohort studies3,4 used estimates of income level and instead used education level as the measure of socioeconomic status. In both of the American studies, increased mortality risk was observed only in the subset of the population without a postsecondary education (41.1% of those in the American Cancer Society study and 66% in the 6-city study).19 Explanations for this finding of apparent immunity to the adverse effects of pollution among the better educated have been discussed.20,21 An important longitudinal study of a nationally representative sample of 3617 Americans reported that differences in mortality by education level were explained in full by the strong association between education and income.22 We thus suspect that the educational differential in the American studies reflects a misclassification introduced by assigning the same exposure level to all subjects. Less educated people probably lived in poorer neighbourhoods and experienced higher exposures than the better educated people. Their higher mortality rates are consistent with our findings in Hamilton.
Our study had a number of limitations. Household income was estimated from census data, so some misclassification is likely. Information was unavailable about change of residence during the observation period. The levels of pollution exposure were estimated by interpolation from a network of fixed sampling stations; this measurement error would tend to bias the regression slope toward null. In addition, we used mean levels of total suspended particulates and sulfur dioxide measured during the 3 years when there were maximum numbers of sampling stations and applied the levels to the entire 8-year observation period. There was little change in pollution levels in this airshed during the late 1990s;8,23,24,25,26 thus, it is unlikely that substantial error was introduced. Other pollutants (e.g., carbon monoxide, nitrogen dioxide and ozone) are also likely to be associated with differences in mortality,27 but data were unavailable to perform intra-urban interpolations for these pollutants.
In conclusion, mortality rates varied by neighbourhood of residence in our study cohort. At least part of this variation is likely related to differences in biologic risk factors that were not controlled for. Two of the broader determinants of health — income and air pollution levels — were important correlates of mortality in this population.
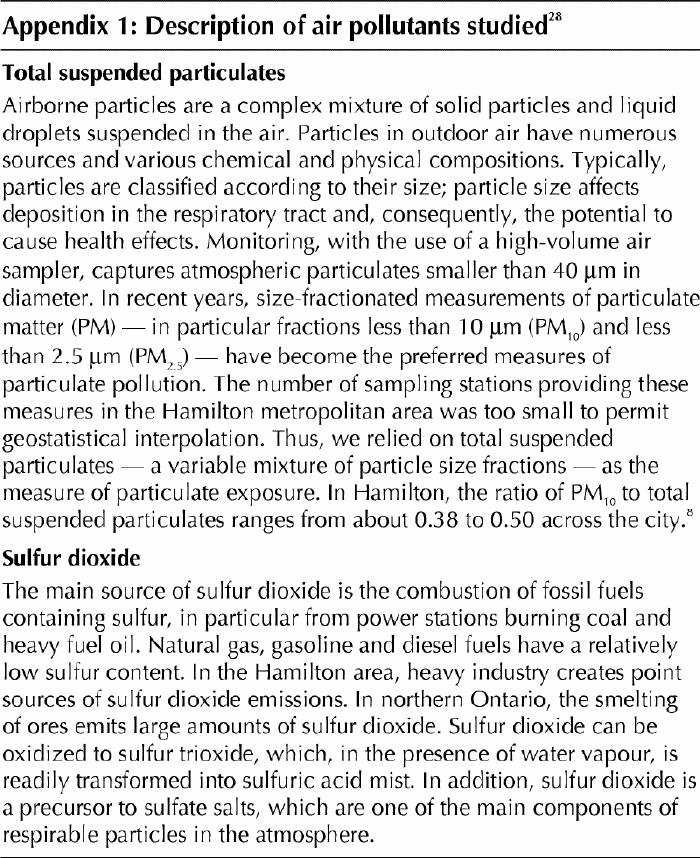
Appendix 1.
Footnotes
This article has been peer reviewed.
Contributors: Murray Finkelstein designed the study, participated in the acquisition, analysis and interpretation of the data and drafted the paper. Michael Jerrett, Patrick DeLuca and Norm Finkelstein participated in the analysis and interpretation of the data and revision of the paper. Dave Verma and Kenneth Chapman participated in the design of the study and revision of the paper. Malcolm Sears participated in the acquisition and interpretation of the data and revision of the paper. All of the authors approved the final version of the manuscript.
Acknowledgement: This work was supported by a grant from the Toxic Substances Research Initiative, a program jointly administered by Health Canada and Environment Canada.
Competing interests: None declared.
Correspondence to: Dr. Murray M. Finkelstein, Family Medicine Centre, Ste. 413, Mount Sinai Hospital, Toronto ON M5G 1X5; fax 416 326-7761; murray.finkelstein@utoronto.ca
References
- 1.Brown P. Race, class, and environmental health: a review and systematization of the literature. Environ Res 1995;69:15-30. [DOI] [PubMed]
- 2.American Lung Association. Urban air pollution and health inequities: a workshop report. Environ Health Perspect 2001;109(Suppl 3):357-74. [PMC free article] [PubMed]
- 3.Dockery DW, Pope CA III, Xu X, Spengler JD, Ware JH, Fay ME, et al. An association between air pollution and mortality in six U.S. cities. N Engl J Med 1993;329:1753-9. [DOI] [PubMed]
- 4.Pope CA III, Burnett RT, Thun MJ, Calle EE, Krewski D, Ito K, et al. Lung cancer, cardiopulmonary mortality, and long-term exposure to fine particulate air pollution. JAMA 2002;287:1132-41. [DOI] [PMC free article] [PubMed]
- 5.Roemer WH, van Wijnen JH. Daily mortality and air pollution along busy streets in Amsterdam, 1987–1998. Epidemiology 2001;12:649-53. [DOI] [PubMed]
- 6.Neas LM, Schwartz J. Pulmonary function levels as predictors of mortality in a national sample of U.S. adults. Am J Epidemiol 1998;147:1011-8. [DOI] [PubMed]
- 7.World Health Organization. International classification of diseases. 9th rev. Geneva: WHO; 1978.
- 8.Dobroff F. 1994 air quality data summary, Regional Municipality of Hamilton–Wentworth. Toronto: Ontario Ministry of the Environment; 1996.
- 9.Burrough PA, McDonnell RA. Principles of geographical information systems. New York: Oxford University Press; 1998.
- 10.Hosmer DW, Lemeshow S. Applied survival analysis. New York: John Wiley & Sons; 1999.
- 11.Luginaah I, Jerrett M, Elliott S, Eyles J, Parizeau K, Birch S, et al. Health profiles of Hamilton: spatial characteristics of neighbourhoods for health investigations. GeoJournal 2001;53:135-47.
- 12.Mao Y, Hu J, Ugnat AM, Semenciw R, Fincham S. Socioeconomic status and lung cancer risk in Canada. Int J Epidemiol 2001;30:809-17. [DOI] [PubMed]
- 13.Fox J. Multiple and generalized nonparametric regression. Thousand Oaks (CA): Sage Publications; 2000.
- 14.Squires BP. Cardiovascular disease and socioeconomic status. CMAJ 2000; 162 (9 Suppl):S3. [PMC free article] [PubMed]
- 15.Dockery DW, Speizer FE, Ferris BG Jr, Ware JH, Louis TA, Spiro A III. Cumulative and reversible effects of lifetime smoking on simple tests of lung function in adults. Am Rev Respir Dis 1988;137:286-92. [DOI] [PubMed]
- 16.Raphael D. Increasing poverty threatens the health of all Canadians. Can Fam Physician 2001;47:1703-6. [PMC free article] [PubMed]
- 17.Sunyer J, Schwartz J, Tobias A, Macfarlane D, Garcia J, Anto JM. Patients with chronic obstructive pulmonary disease are at increased risk of death associated with urban particle air pollution: a case-crossover analysis. Am J Epidemiol 2000; 151:50-6. [DOI] [PubMed]
- 18.Pampalon R, Raymond G. A deprivation index for health and welfare planning in Quebec. Chronic Dis Can 2000;21(3):104-13. [PubMed]
- 19.Krewski D, Burnett RT, Goldberg M, Hoover K, Siemiatycki J, Jerrett M, et al. Reanalysis of the Harvard six-cities study and the American Cancer Society study of air pollution and mortality, phase II: sensitivity analysis. Cambridge (MA): Health Effects Institute; 2000.
- 20.Finkelstein MM. Pollution-related mortality and educational level [letter]. JAMA 2002;288:830. [DOI] [PubMed]
- 21.Pope CA III, Burnett RT, Thurston GD. Pollution-related mortality and educational level [letter]. JAMA 2002;288:830. [DOI] [PubMed]
- 22.Lantz PM, House JS, Lepkowski JM, Williams DR, Mero RP, Chen J. Socioeconomic factors, health behaviors, and mortality: results from a nationally representative prospective study of U.S. adults. JAMA 1998;279:1703-8. [DOI] [PubMed]
- 23.Dobroff F. 1995 air quality data summary, Regional Municipality of Hamilton–Wentworth. Toronto: Ontario Ministry of the Environment; 1997.
- 24.Dobroff F. 1996 air quality data summary, Regional Municipality of Hamilton–Wentworth. Toronto: Ontario Ministry of the Environment; 1998.
- 25.Dobroff F. 1997 air quality data summary, Regional Municipality of Hamilton–Wentworth. Toronto: Ontario Ministry of the Environment; 1999.
- 26.Dobroff F. 1998 air quality data summary, Regional Municipality of Hamilton–Wentworth. Toronto: Ontario Ministry of the Environment; 2000.
- 27.Burnett RT, Cakmak S, Brook JR. The effect of the urban ambient air pollution mix on daily mortality rates in 11 Canadian cities. Can J Public Health 1998;89:152-6. [DOI] [PMC free article] [PubMed]
- 28.Bates DV, Caton RB. A citizen's guide to air pollution. 2nd ed. Vancouver: David Suzuki Foundation; 2002.