Abstract
In several cases, inorganic salts have been used to induce partly structured states in protein folding. But what is the nature of these states: Do they represent key stepping stones in the folding process, or are they circumstantial pitfalls in the energy landscape? Here we report that, in the case of the two-state protein S6, the salt-induced collapsed state is off the usual folding routes in the sense that it is prematurely collapsed and slows down folding by several orders of magnitude. Although this species is over-compact, it is not a dead-end trap but may fold by alternative channels to the native state.
Keywords: 2-state, intermediate, collapse, protein engineering
Certain inorganic salts such as phosphates and sulfates favor compact protein conformations because of preferential exclusion from the protein surface (1, 2). This makes them potent stabilizers of the native state and also provides a useful tool for characterizing partially structured states in the refolding process. These may otherwise go undetected even at low [GdmCl] but can be induced to accumulate transiently at sufficiently high salt concentrations (3, 4). A central issue has been whether such structures represent on-pathway or off-pathway intermediates, i.e., whether they are obligate stepping-stones in the conformational search. Kinetic data are often compatible with both scenarios (5). In the case of ubiquitin, fitting the folding rates and amplitudes to an off-pathway model leads to unrealistically fast folding rates whereas a conventional on-pathway model gives more plausible values (3). Provided the intermediate forms and decays slowly, pulse–chase competition experiments can distinguish between on- and off-pathway schemes, based on the assumption that an off-pathway species must unfold to reach the native state. Baldwin and coworkers have used this technique to infer that RNase A’s intermediate is indeed on-pathway (6). A triangular folding pathway was recently proposed for hen egg-white lysozyme, in which the denatured state can fold to the native state either directly or somewhat slower via an intermediate. Two relaxation phases are resolved in the refolding reaction, and a comprehensive global analysis fits better to an on-pathway than an off-pathway model (7, 8). In triangular schemes, the distinction between on- and off-pathway is not clear-cut. However, in other cases, it is clear that the protein has to back-track from partly structured states, at least to some extent, to find the native conformation. Examples include cytochrome c, where the heme cofactor can misligate (9), bovine pancreatic trypsin inhibitor, where covalent side chain cross links can give rise to incorrect disulfide pairing (10, 11), and U1A, where intermolecular association takes place during refolding at protein concentrations >1 μM (12).
Here, we investigate a salt-induced collapsed state of the 101-residue ribosomal protein S6 from Thermus thermophilus. This collapsed species is off-pathway in the sense that it is over-compact. However, it need not always reverse back to the starting point but also may fold via an alternative and overall more compact route, albeit much more slowly.
Materials and Methods
S6 was produced by overexpression in Escherichia coli and was purified as described (13). S6 was unfolded in 4.4 M guanidinium chloride (GdmCl). Stopped-flow fluorescence experiments were performed on an Applied Photophysics (Surrey, U.K.) SX-18.MV apparatus in 50 mM Mes (pH 6.3) at 25°C with a final protein concentration of 0.5 μM, unless otherwise stated. Stopped-flow CD was performed by using the Aviv Associates (Lakewood, NJ) SF CD spectrometer 202SF with a bandwidth of 1.5 nm, a time constant of 10 ms, and a final protein concentration of 20 μM; experiments were performed at 7°C to slow the observed process and improve the signal.
Data Analysis.
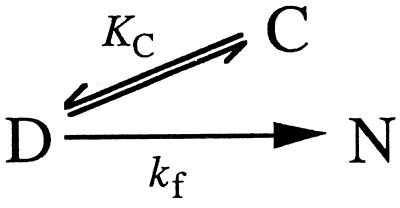
Dead-end scheme (C⇔D⇔N) (Scheme S1).
Scheme 1.
If, as is common practice (5), we assume rapid equilibrium between the collapsed state C and the denatured state D, the following relationship holds:
 |
1 |
where kobs is the measured rate constant, KC =[C]/[D], and kf is the refolding rate constant for the D→N step. This gives the following equation:
 |
2 |
where X is [GdmCl] and mC and mf are the linear dependencies of log KC and log kf on [GdmCl] (and in some stated cases on [Na2SO4]) (14). mf and log kf are not linked to mC and log KC; the two pairs of parameters are determined independently by virtue of the long stretches of linearity, particularly in 1.0 M Na2SO4 (cf. Fig. 1B) above and below the “rollover” region.
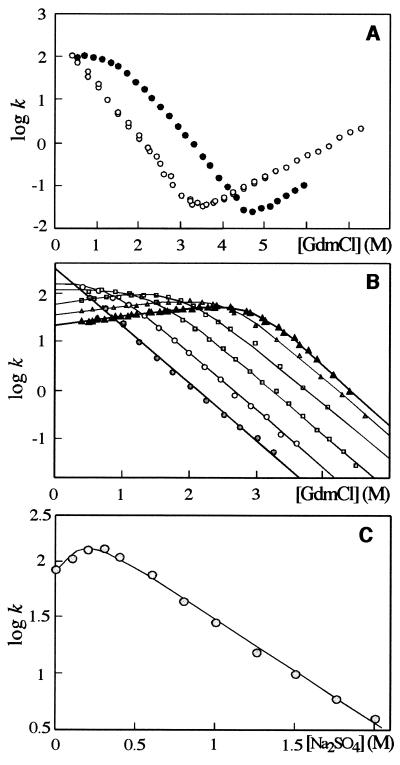
Figure 1.
(A) Chevron plots for S6 wild-type in the absence of Na2SO4 (○) and in 0.4 M Na2SO4 (●). (B) Refolding of 0.5 μM wild-type S6 from 4.4 M GdmCl into lower [GdmCl] at different [Na2SO4]: 0 M ( ), 0.2 M (○), 0.4 M (
 ), 0.6 M (□), 0.8 M (
 ), and 1.0 M (▴). Note that the positive slope at low [GdmCl] becomes more pronounced as [Na2SO4] increases. The lines represent the best fits to Eq. 2, in which [GdmCl], rather than [Na2SO4], is varied. (C) Refolding of wild-type S6 into 0.4 M GdmCl at different [Na2SO4]. The solid line represent the best fit to Eq. 2. All rates are in units of s−1.
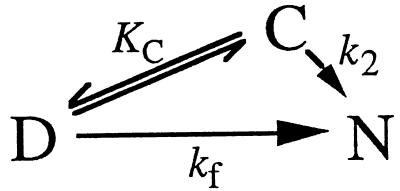
Triangular scheme between D, C, and N (Scheme S2).
Scheme 2.
Again assuming rapid equilibrium between D and C, we obtain
 |
3 |
where k2 is the refolding rate constant for the C→N step, giving
 |
4 |
where m2 is the linear dependency of log k2 on [GdmCl].
Φ-values for the collapsed state (ΦC) are calculated according to (15):
 |
5 |
For each mutant, ΔΔGD−C is obtained by using Eq. 3 for refolding data in 1 M Na2SO4 and 0.4–4.4 M GdmCl. ΔΔGD−N, the destabilization of N, is calculated from equilibrium denaturation data (16) measured in the absence of salt because of limitations in GdmCl solubility. Data on the stability of the transition state in the absence and presence of salt suggest that this is unlikely to affect the value of ΔΔGD−N (see Results and Discussion).
Results and Discussion
Using Salt To Collapse the Denatured Ensemble.
S6 has no co-factors, disulfide bridges or cis-prolines (17). Refolding is described by two phases: a fast major phase that corresponds to gain of native structure and a 10-fold slower minor phase that could be associated with folding-assisted cis-trans isomerization in the unfolded state (13) or refolding from the aggregated state, as observed for CI2 (18). The analysis in this study is based on the true refolding phase only, i.e., the major phase that describes two-state folding with a V-shaped chevron plot (Fig. 1A). It accounts for at least 90% of the total amplitude for all refolding experiments in the presence of Na2SO4. Although S6 has no detectable intermediates, it has been proposed that intermediates may still occur in the folding process but are too unstable to accumulate in the absence of stabilizing salts. To investigate this, we measured refolding rates as a function of both denaturant (GdmCl) and stabilizing salt (Na2SO4). S6 responds in an unusual manner to this treatment. At low [Na2SO4] (0.2 M), the chevron plot levels off at low [GdmCl] in a manner compatible with the accumulation of a folding intermediate I (D⇔I⇔N) (5). As I accumulates in the mixing time at low [GdmCl], the rate-limiting step becomes the conversion of I to N rather than the conversion of D to N via I. Above 0.4 M Na2SO4, however, the folding rate is augmented by low [GdmCl] (Fig. 1B). A similar effect has been observed previously for carbonic anhydrase in the absence of salt (19) and has been predicted independently from theory (30). From mass-action, a positive dependence of a given rate on [GdmCl] shows that more denaturant binds to the transition state than to the kinetic ground state C. This means that the transition state exposes more surface area than C, which accordingly is prematurely collapsed. Thus, C appears to be off the ideal route. The point is made even clearer when the refolding of S6 is measured at increasing [Na2SO4] and constant [GdmCl] (Fig. 1C): Although its refolding rate initially increases by 50% as [Na2SO4] increases to 0.3 M, it subsequently plummets to a value that amounts to 5% of the rate in the absence of salt. In a progressive folding scheme (D⇔I⇔N), the major transition state between I and N (TS) will be more stabilized by Na2SO4 than the less compact intermediate, leading to a monotonic increase in the refolding rate with increasing [Na2SO4]. This is in clear contrast to the experimental data (Fig. 1C). Note that it is necessary to go above 0.2 M Na2SO4 to reveal this over-compact character.
To a first approximation, the data are consistent with a minimalist dead-end scheme in which the over-compact species C equilibrates with the denatured state in the dead-time of the experiment (Eq. 2)
This rapid equilibration is consistent with general views on the formation of compact species (5). The dead-end scheme also may be solved without the assumption of a rapid equilibrium between D and C, using simulated microscopic rate constants, k1 and k−1, for the interconversion of D and C. The characteristic equation gives two relaxation rates. The faster phase corresponds to the establishment of equilibrium within the dead-time of the experiment. The slower phase matches the rate constant derived from Eq. 2, provided k1 > 10kf. The equation for Scheme S1 (Eq. 2) is also based on the general view that both log KC and log kf depend linearly on [GdmCl] (with slopes mC and mf) as well as on [Na2SO4] (Table 1) (14). This is in line with the view that GdmCl and Na2SO4 both affect protein stability through weak interactions in which the cosolutes are either preferentially bound to or excluded from the protein surface (1). The values of mC and mf are significantly lower for GdmCl than for Na2SO4, probably because the guanidinium ion is larger than the sulfate ion and therefore has less access to the protein surface. Note that, in 0 M Na2SO4, log KC = −0.41 ± 0.07 in 0.4 M GdmCl (the lowest [GdmCl] under which refolding is measured). Thus, C becomes 29% populated during the dead-time of mixing even in the absence of salt. This is within the experimental error of two-state behavior (13).
Table 1.
Effect of Na2SO4 and GdmCl on the stability of C (KC) and the refolding rate (kf)
| Parameters in 1 M Na2SO4 extrapolated to 0 M GdmCl* | |||
| log KC | mCGdmCl, M−1 | log kf | mfGdmCl, M−1 |
| 4.38 ± 0.06 | −1.47 ± 0.02 | 5.71 ± 0.07 | −1.30 ± 0.02 |
| Parameters extrapolated to 0 M GdmCl and 0 M Na2SO4† | |||
| log KC | mCNa2SO4, M−1 | log kf | mfNa2SO4, M−1 |
| −0.02 ± 0.11 | 4.34 ± 0.14 | 2.56 ± 0.12 | 3.10 ± 0.17 |
Data were obtained by fitting refolding data over 0.4–4.4 M GdmCl at fixed [Na2SO4] (1 M) to Eq. 1. kf was measured in s−1.
Although Scheme S1 turns out to be an over-simplification (see below), it can be used to determine the compactness of C and TS as follows. The m-value for each step is a rough indication of the change in solvent-exposure associated with the step (Table 1) (14). As mC = −1.47 M−1 and mf = −1.30 M−1, C is ≈10% more compact than TS. Because mD−N = 1.75 M−1 (13), we conclude that C and TS have reached 85% and 75% of the native state’s amount of surface area burial.
An alternative explanation for the decline in refolding rate at low [GdmCl] is aggregation, which is known to occur transiently in other systems (12). Although this cannot be entirely excluded for S6, it plays a minor role because a 40-fold increase in protein concentration (to 20 μM) has no significant effect on the folding kinetics (data not shown).
Another noticeable effect of high salt folding is that kf turns out very fast (0.15 × 10⁶ s−1) when extrapolated to 0.4 M GdmCl, the lowest concentration at which refolding was measured. Scheme S1 implies that the formation of the species C must be even faster than this to allow the intermediate to accumulate; i.e., the D⇔C relaxation must be in the nanosecond–microsecond regime. Such collapse rates for the denatured ensemble are reported from laser-induced temperature jumps (20) and also are observed for reconfiguration of the denatured state on ligation of heme (21, 22). However, it is plausible that the extrapolated value of kf is an overestimate because previous studies show that S6 is prone to transition state movements (13): The S6 transition state in 1.0 M Na2SO4 could well be shifted to an earlier part of the activation barrier at low [GdmCl] (23). In effect, this will cause a downward kink or curvature of the refolding limb of the chevron plot, lowering the folding rate in water (24).
Recently, trifluoroethanol and hexafluoroisopropanol also have been used to convert apparent two-state folding into multistate behavior (25). These alcohols are generally thought to stabilize secondary structure, and their effect on folding is attributed to enhanced levels of secondary structure in the denatured ensemble. The kinetic effects of the alcohols is very similar to that of salt (compare Fig. 1C with Fig. 2A in ref. 25), although the maximum in kf is suggested to coincide with native-like levels of secondary structure in the denatured ensemble. In contrast to Na2SO4, however, high alcohol concentrations unfold the protein by weakening the intramolecular hydrophobic interactions, so we do not a priori expect them to induce the same conformational states as salt. This is also supported by the lack of the characteristic rollover at low [GdmCl] when S6 is refolded in high concentrations of trifluoroethanol (data not shown). It may therefore be important to distinguish between effects on secondary structure alone and in conjunction with overall compaction.
Snapshots of a Prematurely Collapsed State.
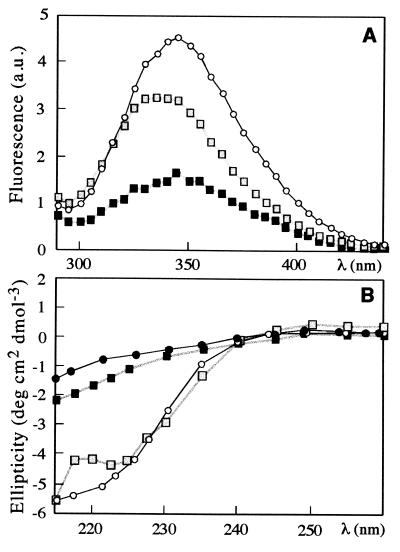
S6 contains a single Trp that we used to probe the level of structure in C. The spectrum of the dead-time species during refolding in 0.4 M GdmCl and 1.0 M Na2SO4 (which is 99.98% C) is intermediate between D and N in terms of intensity and is blue-shifted beyond N (Fig. 2A). This suggests a compact state with non-native contacts. The blue-shift, in particular, implies that Trp62 is less solvent-accessible in C than in N, where it is only partly buried. Reconstruction of the far-UV CD-spectrum under these conditions indicates a substantial accumulation of secondary structure that does not occur in the absence of salt (Fig. 2B). The GdmCl-dependent decrease in folding amplitude obtained by CD and fluorescence coincide (data not shown), which indicates that the collapse is cooperative. But, although high levels of secondary and tertiary structure are the spectroscopic hallmarks of a classical folding intermediate (26), the accumulation of C is kinetically disadvantageous in the case of S6.
Figure 2.
(A) Fluorescence dead-time spectra for refolding of wild-type S6 into 0.4 M GdmCl at 0 M (■) and 1.0 M ( ) Na2SO4. The spectrum of the native state (○) is included for comparison. With increasing [Na2SO4], the fluorescence intensity of the dead-time species increases and becomes more blue-shifted, indicating a structure more compact than the unfolded state in the absence of Na2SO4. (B) Far-UV CD dead-time spectra for refolding into 0.9 M GdmCl at 0 M Na2SO4 (●) and 1.0 M Na2SO4 (
 ). The equilibrium spectra of native S6 (○, 0.9 M GdmCl) and unfolded S6 (■), 4.4 M GdmCl) are included for comparison.
Protein Engineering Analysis of the Structure of C.
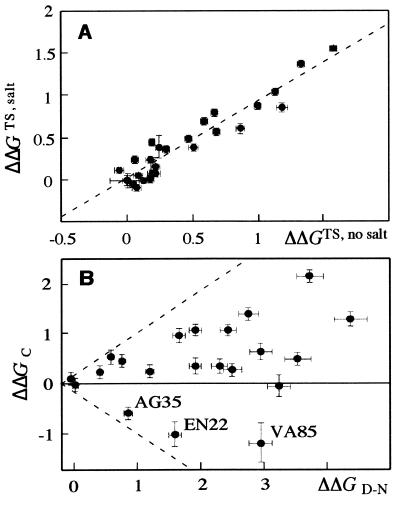
We have also characterized the structure of C by protein engineering using a large number of mutants. Judging from the refolding kinetics, the transition state structure in the direct route between D and N is not significantly affected by Na2SO4 because it is destabilized by mutations to the same extent in the absence and presence of 1 M Na2SO4 (Fig. 3A). Based on the Φ-value formalism (15), this transition state contains a rather diffuse nucleus with decreasing levels of structure at the edges; the highest Φ-value is ≈0.4† (data not shown). As concerns the Φ-value analysis of C, there is no clear correlation between the mutational destabilizations of C and N (Fig. 3B). With all caveats attributable to the intrinsic complexities in carrying out Φ-value analysis on non-native-like species, the mutants fall into three distinct classes. The first class has ΦC-values around 0.6 whereas the second class has ΦC-values below 0.2 (Table 2 and Fig. 4). Mutants in the third class (EQ22, AG35, and VA85) stabilize C despite destabilizing N and are discussed in more detail below.
Figure 3.
(A) Effect of salt on the structure of the transition state of folding. ΔΔGTS, the mutational destabilization of the transition state for folding under given conditions, is calculated as −1.36RT (logkfmutant − logkfwild type). Values in 3 M GdmCl and 1 M Na2SO4 are plotted versus values in 1 M GdmCl in the absence of salt. There is a clear linear correlation, with intercept 0.05 ± 0.04 and slope 0.91 ± 0.06, showing that the direct refolding step is the same in the absence and presence of Na2SO4. (B) Change in the free energy of formation of the collapsed state of S6 in 1 M GdmCl relative to the wild type (ΔΔGC) versus the change in the free energy of unfolding (ΔΔGD−N, from equilibrium denaturation experiments in the absence of salt). The dashed lines through Origo have slopes of 1 and −1, respectively, and are drawn purely for reference. There is no correlation between the two parameters, and there are three mutations that stabilize the collapsed state while destabilizing the native state. This suggests that the collapsed state contains specific but non-native interactions. All values are in units of kcal⋅mol−1.
Table 2.
Data for refolding of S6 mutants in M Na2SO4
| Mutant | log KCwater* | mCGdmCl, M−1 | log kf3M GdmCl, s−1* | mfGdmCl, M−1 | ΔΔGD−N, kcal⋅mol−1† | ΦC‡ |
|---|---|---|---|---|---|---|
| Wild-type | 4.37 ± 0.06 | −1.47 ± 0.01 | 1.82 ± 0.02 | −1.29 ± 0.02 | ≡ 0 | |
| VA6 | 4.01 ± 0.08 | −1.54 ± 0.02 | 0.80 ± 0.02 | −1.44 ± 0.02 | 3.56 ± 0.16 | 0.14 ± 0.1 |
| VA8 | 2.78 ± 0.07 | −1.17 ± 0.02 | 0.69 ± 0.02 | −1.18 ± 0.02 | 3.74 ± 0.17 | 0.59 ± 0.02 |
| VA9 | 3.64 ± 0.10 | −1.45 ± 0.02 | 1.64 ± 0.02 | −1.27 ± 0.03 | 1.65 ± 0.08 | 0.61 ± 0.02 |
| LA21 | 4.30 ± 0.13 | −1.50 ± 0.03 | 1.76 ± 0.03 | −1.29 ± 0.03 | 0.57 ± 0.03 | 0.19 ± 0.05 |
| EQ22 | 5.11 ± 0.18§ | −1.67 ± 0.07 | 1.82 ± 0.07‡ | −1.34 ± 0.05 | 1.60 ± 0.08 | −0.64 ± 0.03 |
| IA26 | 3.33 ± 0.06 | −1.40 ± 0.02 | 1.05 ± 0.02 | −1.22 ± 0.02 | 2.76 ± 0.13 | 0.53 ± 0.01 |
| LA30 | 4.38 ± 0.15 | −1.58 ± 0.04 | 1.18 ± 0.04 | −1.42 ± 0.04 | 3.26 ± 0.15 | −0.00 ± 0.01 |
| YA33 | 4.19 ± 0.06 | −1.45 ± 0.01 | 1.77 ± 0.02 | −1.26 ± 0.02 | 0.38 ± 0.02 | 0.67 ± 0.03 |
| AG35 | 4.78 ± 0.07 | −1.55 ± 0.02 | 1.83 ± 0.02 | −1.39 ± 0.02 | 0.84 ± 0.04 | −0.67 ± 0.02 |
| VA37 | 4.14 ± 0.09 | −1.52 ± 0.02 | 1.53 ± 0.02 | −1.35 ± 0.02 | 2.50 ± 0.19 | 0.13 ± 0.01 |
| VA40 | 3.97 ± 0.10 | −1.45 ± 0.02 | 1.64 ± 0.03 | −1.29 ± 0.03 | 0.59 ± 0.04 | 0.96 ± 0.04 |
| IA48 | 4.04 ± 0.06 | −1.43 ± 0.01 | 1.79 ± 0.02 | −1.27 ± 0.02 | 0.77 ± 0.04 | 0.61 ± 0.02 |
| FA60 | 4.19 ± 0.07 | −1.51 ± 0.02 | 1.71 ± 0.02 | −1.29 ± 0.02 | 1.21 ± 0.06 | 0.21 ± 0.01 |
| VA65 | 3.89 ± 0.10 | −1.52 ± 0.03 | 1.17 ± 0.02 | −1.37 ± 0.03 | 2.95 ± 0.13 | 0.23 ± 0.01 |
| MA67 | 4.11 ± 0.09 | −1.49 ± 0.02 | 1.40 ± 0.02 | −1.33 ± 0.02 | 2.30 ± 0.11 | 0.16 ± 0.01 |
| LA75 | 4.11 ± 0.11 | −1.55 ± 0.03 | 1.31 ± 0.03 | −1.27 ± 0.03 | 1.92 ± 0.10 | 0.19 ± 0.01 |
| LA79 | 3.41 ± 0.09 | −1.32 ± 0.02 | 1.23 ± 0.02 | −1.15 ± 0.03 | 4.39 ± 0.20 | 0.30 ± 0.01 |
| VA85 | 5.24 ± 0.23§ | −1.84 ± 0.09 | 1.49 ± 0.01‡ | −1.13 ± 0.04 | 2.97 ± 0.15 | −0.40 ± 0.01 |
| VA88 | 3.57 ± 0.04 | −1.33 ± 0.01 | 1.53 ± 0.10 | −1.18 ± 0.01 | 1.93 ± 0.09 | 0.58 ± 0.02 |
| VA90 | 3.57 ± 0.06 | −1.37 ± 0.01 | 1.55 ± 0.02 | −1.23 ± 0.02 | 2.44 ± 0.12 | 0.46 ± 0.01 |
Figure 4.
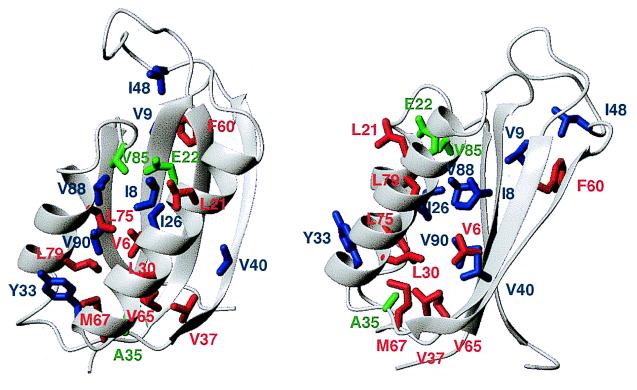
Two views of S6 (17), showing the ΦC-values of different mutated residues, calculated according to Eq. 3. Residues 8,9, 26, 33, 40, 48, 88, and 90 (blue) have Φ-values around 0.6 whereas residues 6, 21, 30, 37, 60, 65, 67, 75, and 79 (red) have Φ-values below 0.2. Residues 22, 35, and 85 (green) have negative Φ-values (see text).
The first two classes of mutations are not randomly distributed throughout the protein (Fig. 4). Although they do not show a conventional nucleation pattern, they still form contiguous patches; the highly structured region centers around strands 1 and 4 and the “hook region” between strands 2 and 3 whereas the unstructured region involves strands 2 and 3 and α-helix 1. If the residues in the structured region indeed are close in space, then C must be significantly different from the native state. According to the CD spectra (Fig. 2B), this could involve native-like secondary structure in a non-native tertiary context (cf. ref. 25). The high level of structure in C, which yields an average ΦC-value of 0.33,‡ contrasts with TS, which has an average Φ-value of 0.15 and a very delocalized nucleus (data not shown). Thus, C is more structured than TS, both in terms of side-chain interactions and overall compactness. The latter parameter is much higher than the average Φ-values, in line with the view that burial of hydrophobic surface area precedes orderly side chain arrangement (27).
Prefactor Effects.
A relevant question concerns whether the salt-induced retardation of the folding rate could be explained simply by changes in the kinetic prefactor, i.e., an increase in the diffusional reconfiguration time as the polypeptide becomes more compact and experiences a higher degree of internal friction and steric conflicts (28). Although the build-up of native-like interactions in this case need not differ from that in the absence of salt, such a collapse would still be considered a compact detour because it restricts the protein to more compact regions of conformational space. However, the mutations’ specific effects on the refolding kinetics suggest that the detour also involves ordered contact patterns as well as backbone configurations that are normally disfavored. Nevertheless, the reconfiguration time is expected to be closely coupled to the compactness of the polypeptide, and experiments to deconvolute these contributions are underway.
Alternative Folding Routes.
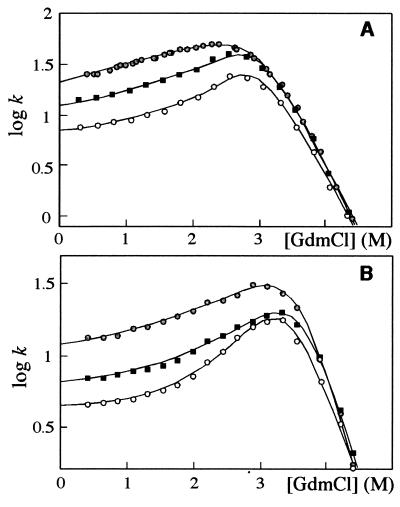
The C-stabilizing mutants EQ22 and VA85 deviate from conventional dead-end behavior. At low [GdmCl], the positive slope flattens out, reaching an apparently constant value for the observed rate constant (Fig. 5A). The most plausible explanation for this is the opening of a direct route between C and D (Scheme S2 and Eq. 4). The rate constant for this new passage (k2) is 10.5 ± 0.6 for EQ22 and 7.4 ± 0.2 s−1 for VA85. Again, analysis including microscopic rate constants for the D⇔C relaxation matches Eq. 4, provided k1 > 10 kf. Interestingly, the effect also may be provoked in wild-type S6 by increasing [Na2SO4] above 1 M; in 1.25 M Na2SO4, wild-type and certainly the two mutants show a distinct flattening at low [GdmCl] (Fig. 5B).
Figure 5.
Refolding of S6 wild-type ( ), VA85 (○), and EQ22 (■) in 1 M Na2SO4 (A) and 1.25 M Na2SO4 (B). At 1 M Na2SO4, wild-type data were fitted to the dead-end model (Scheme S1 and Eq. 2). All other data were fitted to the triangular folding model (Scheme S2 and Eq. 4). Rates are in units of s−1.
The kinetic m-value for the C→N conversion (m2) is ≈0, suggesting that the associated change in solvent exposure is very small (m2 is −0.02 ± 0.08 for VA85, the mutant with the highest degree of stabilization of C). In view of the compact nature of C, this is not surprising. Note that this C → N conversion, which appears only to involve internal reconfiguration, could even represent a case of “glassy” downhill folding, cf. Sabelko et al. (29). AG35, the third mutation that stabilizes C, does not show flattening at low [GdmCl]. An explanation could be that AG35 does not stabilize C to the same degree as EQ22 and VA85 (Table 2). Of interest, E22, V85, and A35 have Φ-values close to zero in the transition state for the normal folding reaction (TS) and thus have no significant effect on the stability of this state (data not shown). Nor are they involved in stabilizing interactions in C because side-chain truncations increase the stability of C. Assuming that D is unstructured, it is more likely that these residues act as gatekeepers that steer the wild-type protein away from the “wrong” route by destabilizing C. The mutations EQ22 and VA85 may open up the “wrong” route by removing electrostatic or steric clashes whereas AG35 may favor C by increasing the flexibility of the backbone. Consistent with this idea, all three residues separate sequences of low and high ΦC-values, suggesting that they obstruct the docking of substructures rearranging in a non-native fashion (Table 4). Because the premature collapse of the denatured ensemble profoundly decreases the folding rate (28–34), it seems reasonable that evolution selects gatekeeping residues that actively disfavor these rugged delays. Such a selection mechanism also explains the seemingly smooth folding funnels (28) of small proteins, where the folding behavior is well described by native interactions alone (35, 36).
In summary, there appear to be several folding routes available to S6. The stabilization of C by mutations or by excessive amounts of salt makes the swelling required for folding through the normal two-state route too costly. It is then better to continue folding through more compact conformations. Thus, all ways lead to Rome, also in the energy landscape; some are just very slow and arduous.
Acknowledgments
We thank Professor A. Fersht and Dr. C. Johnson for providing access to stopped-flow CD apparatus. This work was supported by the S. and E.-C. Hagbergs Foundation (The Royal Swedish Academy of Sciences), the Swedish Natural Science Research Council, and Kungliga Fysiografiska Sällskapet i Lund. D.E.O. gratefully acknowledges support from the Wenner-Grenska Foundation and the European Molecular Biology Organization.
Abbreviations
- C
collapsed state
- D
denatured state
- GdmCl
guanidinium chloride
- N
native state
- TS
transition state
Footnotes
This paper was submitted directly (Track II) to the PNAS office.
Φ = 0 indicates that the mutated side chain is just as unstructured as in the denatured state whereas Φ = 1 indicates native-like structure (15).
Excepting the three non-native mutations EQ22, AG35, and VA85 (see below).
References
- 1.Timasheff S N. Annu Rev Biophys Biomol Struct. 1993;22:67–97. doi: 10.1146/annurev.bb.22.060193.000435. [DOI] [PubMed] [Google Scholar]
- 2.Baldwin R L. Biophys J. 1996;71:2056–2063. doi: 10.1016/S0006-3495(96)79404-3. [DOI] [PMC free article] [PubMed] [Google Scholar]
- 3.Khorasanizadeh S, Peters I D, Roder H. Nat Struct Biol. 1996;3:193–205. doi: 10.1038/nsb0296-193. [DOI] [PubMed] [Google Scholar]
- 4.Parker M J, Dempsey C E, Lorch M, Clarke A R. Biochemistry. 1997;36:13396–13405. doi: 10.1021/bi971294c. [DOI] [PubMed] [Google Scholar]
- 5.Baldwin R. Fold Des. 1996;1:R1–R8. doi: 10.1016/S1359-0278(96)00003-X. [DOI] [PubMed] [Google Scholar]
- 6.Laurents D V, Bruix M, M, J, Baldwin R L. J Mol Biol. 1998;283:669–678. doi: 10.1006/jmbi.1998.2118. [DOI] [PubMed] [Google Scholar]
- 7.Kiefhaber T. Proc Natl Acad Sci USA. 1995;92:9029–9033. doi: 10.1073/pnas.92.20.9029. [DOI] [PMC free article] [PubMed] [Google Scholar]
- 8.Wildegger G, Kiefhaber T. J Mol Biol. 1997;270:294–304. doi: 10.1006/jmbi.1997.1030. [DOI] [PubMed] [Google Scholar]
- 9.Yeh S-R, Rousseau D L. Nat Struct Biol. 1998;5:222–228. doi: 10.1038/nsb0398-222. [DOI] [PubMed] [Google Scholar]
- 10.Creighton T E. J Mol Biol. 1975;95:167–199. doi: 10.1016/0022-2836(75)90389-7. [DOI] [PubMed] [Google Scholar]
- 11.Weissman J S, Kim P S. Science. 1991;253:1386–1393. doi: 10.1126/science.1716783. [DOI] [PubMed] [Google Scholar]
- 12.Silow M, Oliveberg M. Proc Natl Acad Sci USA. 1997;94:6084–6086. doi: 10.1073/pnas.94.12.6084. [DOI] [PMC free article] [PubMed] [Google Scholar]
- 13.Otzen D E, Kristensen O, Proctor M, Oliveberg M. Biochemistry. 1999;38:6499–6511. doi: 10.1021/bi982819j. [DOI] [PubMed] [Google Scholar]
- 14.Tanford C. Adv Protein Chem. 1970;24:1–95. [PubMed] [Google Scholar]
- 15.Fersht A R, Matouschek A, Serrano L. J Mol Biol. 1992;224:771–782. doi: 10.1016/0022-2836(92)90561-w. [DOI] [PubMed] [Google Scholar]
- 16.Clarke J, Fersht A R. Biochemistry. 1993;32:4322–4329. doi: 10.1021/bi00067a022. [DOI] [PubMed] [Google Scholar]
- 17.Lindahl M, Svensson L A, Liljas A, Sedelnikova S E, Eliseikina I A, Fomenkova N P, Nevskaya N, Nikonov S V, Garber M B, Muranova T A, et al. EMBO J. 1994;13:1249–1254. doi: 10.2210/pdb1ris/pdb. [DOI] [PMC free article] [PubMed] [Google Scholar]
- 18.Silow, M., Tan, Y.-J., Fersht, A. R. & Oliveberg, M. (1999) Biochemistry, in press. [DOI] [PubMed]
- 19.McCoy L F, Rowe E S, Wong K-P. Biochemistry. 1980;19:4738–4743. doi: 10.1021/bi00562a003. [DOI] [PubMed] [Google Scholar]
- 20.Gruebele M, Sabelko J, Ballew R, Ervin J. Acc Chem Res. 1998;31:699–707. [Google Scholar]
- 21.Hagen S J, Hofrichter J, Szabo A, Eaton W A. Proc Natl Acad Sci USA. 1996;93:11615–11617. doi: 10.1073/pnas.93.21.11615. [DOI] [PMC free article] [PubMed] [Google Scholar]
- 22.Parker M J, Lorch M, Sessions R B, Clarke A R. Biochemistry. 1998;37:2538–2545. doi: 10.1021/bi972459k. [DOI] [PubMed] [Google Scholar]
- 23.Silow M, Oliveberg M. Biochemistry. 1997;36:7633–7637. doi: 10.1021/bi970210x. [DOI] [PubMed] [Google Scholar]
- 24.Oliveberg M. Acc Chem Res. 1998;31:765–772. [Google Scholar]
- 25.Chiti F, Taddei N, Webster P, Hamada D, Fiaschi T, Ramponi G, Dobson C M. Nat Struct Biol. 1999;6:380–387. doi: 10.1038/7616. [DOI] [PubMed] [Google Scholar]
- 26.Ptitsyn O B. Protein Eng. 1994;7:593–596. doi: 10.1093/protein/7.5.593. [DOI] [PubMed] [Google Scholar]
- 27.Itzhaki L S, Otzen D E, Fersht A R. J Mol Biol. 1995;254:260–288. doi: 10.1006/jmbi.1995.0616. [DOI] [PubMed] [Google Scholar]
- 28.Bryngelson J, Onuchic J N, Socci N D, Wolynes P. Proteins Struct Funct Genet. 1995;21:167–195. doi: 10.1002/prot.340210302. [DOI] [PubMed] [Google Scholar]
- 29.Sabelko T, Ervin T, Gruebele M. Proc Natl Acad Sci USA. 1999;96:6031–6036. doi: 10.1073/pnas.96.11.6031. [DOI] [PMC free article] [PubMed] [Google Scholar]
- 30.Camacho C J, Thirumalai D. Protein Sci. 1996;5:1826–1832. doi: 10.1002/pro.5560050908. [DOI] [PMC free article] [PubMed] [Google Scholar]
- 31.Sali A, Shakhnovich E I, Karplus M. Nature (London) 1994;369:248–251. doi: 10.1038/369248a0. [DOI] [PubMed] [Google Scholar]
- 32.Gutin A M, Abkevich V I, Shakhnovich E I. Biochemistry. 1995;34:3066–3076. doi: 10.1021/bi00009a038. [DOI] [PubMed] [Google Scholar]
- 33.Dill K A, Bromberg S, Yue K, Fiebig K M, Yee D P, Thomas P D, Chan H S. Protein Sci. 1995;4:561–602. doi: 10.1002/pro.5560040401. [DOI] [PMC free article] [PubMed] [Google Scholar]
- 34.Bryngelson J D, Wolynes P G. J Chem Phys. 1989;93:6902–6915. [Google Scholar]
- 35.Shoemaker B A, Wang J, Wolynes P G. J Mol Biol. 1999;287:657–674. doi: 10.1006/jmbi.1999.2612. [DOI] [PubMed] [Google Scholar]
- 36.Shoemaker B A, Wang J, Wolynes P G. J Mol Biol. 1999;287:675–694. doi: 10.1006/jmbi.1999.2613. [DOI] [PubMed] [Google Scholar]


