

Abstract
Obesity is a major factor central to the development of insulin resistance and type 2 diabetes. The identification and characterization of genes involved in regulation of adiposity, insulin sensitivity, and glucose uptake are key to the design and development of new drug therapies for this disease. In this study, we show that the polarity kinase Par-1b/MARK2 is required for regulating glucose metabolism in vivo. Mice null for Par-1b were lean, insulin hypersensitive, resistant to high-fat diet-induced weight gain, and hypermetabolic. 18F-FDG microPET and hyperinsulinemic–euglycemic clamp analyses demonstrated increased glucose uptake into white and brown adipose tissue, but not into skeletal muscle of Par-1b null mice relative to wild-type controls. Taken together, these data indicate that Par-1b is a regulator of glucose metabolism and adiposity in the whole animal and may be a valuable drug target for the treatment of both type 2 diabetes and obesity.
Keywords: glucose, obesity, EMK
The Par-1b/MARK2/Emk gene product is implicated in the regulation of a number of cellular processes, including the generation and/or maintenance of cell polarity. Originally identified in Caenorhabdhitis elegans as a critical player in early embryonic polarity, Par-1 has since been shown to regulate cell polarity in yeast, Drosophila, Xenopus, and several mammalian cell types (1–13). Par-1 is a regulator of microtubule stability, the Wnt signaling pathway and also plays a role in vesicular trafficking (2, 8, 12, 14–19). Two critical regulators of Par-1, LKB1 (Par-4) and atypical PKCζ/λ (aPKC), have been identified in multiple systems. LKB1 catalyzes phosphorylation of an activation loop Thr residue in the kinase domain of the Par-1, whereas aPKC phosphorylates a conserved Thr residue in the “spacer” domain of the Par-1 kinases (20–22). In contrast to the activating phosphorylation catalyzed by LKB1, aPKC negatively regulates localization and activity of Par-1 (22–25).
In mammals, four Par-1 family members exist (Par-1b/MARK2/Emk, Par-1a/C-TAK1/MARK3, PAR-1c/MARK1, and Par-1d/MARK4/MARKL1), each encoded by distinct genes and each expressed selectively in multiple tissues (26–29). Two studies have been published on the generation and characterization of mice null for one of these genes, Par-1b/MARK2/Emk (30, 31). Bessone et al. (30) characterized defects in growth and fertility, whereas we previously reported a role for Par-1b in immune system homeostasis (31). Here, we demonstrate that Par-1b null mice display a number of striking metabolic disorders. These include reduced adiposity, hypoinsulinemia, insulin hypersensitivity, resistance to high-fat diet-induced weight gain, and increased glucose uptake into white (WAT) and brown (BAT) adipose tissue. These findings elucidate a role for Par-1b in the regulation of both glucose homeostasis and energy balance and suggest that this kinase may be a useful target for the treatment of type 2 diabetes and obesity.
Results
Par-1b Null Mice Have Reduced Body Weight and Decreased Adiposity.
Generation of Par-1b kinase null mice (Par-1b−/−) has been described previously (31). Par-1b−/− mice (males and females) weighed ≈20% less than their wild-type littermates during both embryonic (118 ± 12 mg vs. 150 ± 16 mg, 13.5 days post coitus, P < 0.005) and postnatal growth (Fig. 1 A–C). Par-1b heterozygotes (Par-1b+/−) also displayed statistically significant reductions in body weight at 1 year of age. Nose to anus length at 1 year of age was significantly reduced (≈8%) in null males (9.35 cm ± 0.57 Par-1b−/− vs. 10.10 cm ± 0.42 Par-1b+/+, P = 0.04) and females (9.08 cm ± 0.35 Par-1b−/− vs. 9.75 cm ± 0.32 Par-1b+/+, P = 0.01).
Fig. 1.

Par-1b null mice are growth retarded and have disproportionate reductions in adiposity. (A) Body weights of embryos from 13.5 to 18.5 days postcoitus (d.p.c.) (n = 5–13 per genotype per time point). (B) Body weights of mice from birth to 3 weeks of age (n = 4–19 per genotype per time point). (C) Body weights of Par-1b wild-type (Par-1b+/+, black bars), heterozygous (Par-1b+/−, red bars), or null (Par-1b−/−, gray bars) mice at 1 year of age (n = 7–13 per genotype per sex). (D) Comparison of Par-1b wild-type and null inguinal (I) and epidydymal (E) fat pads. (E) Scatter plot depiction of adiposity in 10- to 12-week-old male Par-1b wild-type and null mice expressed as a ratio of fat mass to body mass as determined by 1H-MRS. Individual mice for each genotype are shown with averages and P value indicated (n = 18–20 per genotype). (F) Hematoxylin and eosin stain of BAT and WAT from Par-1b wild-type and null mice. (Scale bar, 50 μm.) All values are presented as the averages ± standard error. Student's t test was performed for comparisons between groups. P value designations are as follows: ****, P < 0.05; ***, P < 0.01; **, P < 0.005; *, P < 0.001.
Par-1b−/− mice have been reported to have reduced serum levels of IGF-1 (30). Because both pre- and postnatal growth retardation can result from IGF-1 deficiencies, we assayed levels of IGF-1 in Par-1b null and wild-type mice. An ≈25% reduction in IGF-1 levels was measured in Par-1b null mice relative to wild-type littermates at 7 weeks of age (535.5 ng/ml Par-1b−/− vs. 682.0 ng/ml Par-1b+/+, P = 0.015). Postnatally, IGF-1 transcription is driven primarily by growth hormone. Therefore, we quantitated serum growth hormone levels at 7 weeks of age (n = 10 mice per genotype) and found no significant differences in single time point measurements (93.5 ± 117 ng/ml Par-1b−/− vs. 56.2 ± 111 ng/ml Par-1b+/+, P = 0.464). These data must be considered with the caveat that growth hormone is released in a pulsatile manner and that single time point measurements may not be an accurate readout of daily average growth hormone levels.
As reported (30), measurements of organ weight in Par-1b−/− mice indicated that decreased organ weights were consistent with decreases in body mass (data not shown). However, proton magnetic resonance spectroscopy (1H-MRS) and dissection of adipose tissue showed that Par-1b null mice had disproportionate decreases in fat mass relative to wild-type mice (2.47 g in Par-1b−/− vs. 6.85 g Par-1b+/+ epididymal fat pads, P < 0.0001) at 12 weeks of age (Fig. 1D). Similarly, quantitation of BAT from intrascapular depots indicated 0.17 ± 0.05 g in Par-1b−/− mice vs. 0.44 ± 0.14 g in Par-1b+/+ mice, n = 10 mice per genotype, P < 0.0001. The decrease in fat mass corresponded to ≈14% body fat in Par-1b−/− mice vs. ≈23% body fat in wild-type littermates (P < 0.0001) (Fig. 1E). Histological analysis of adipose tissue indicated that adipocyte size (WAT and BAT) was comparable in Par-1b null and wild-type mice (Fig. 1F). Adipocyte counts from multiple independent samples of WAT indicated no differences in adipocyte numbers per field of view from Par-1b wild-type and null WAT (72.4 ± 3.7 adipocytes Par-1b+/+ vs. 72.2 ± 2.2 Par-1b−/−, n = 5 and 9, respectively, P = 0.96). Thus, the observed decrease in adiposity of Par-1b−/− mice was due to decreases in total adipocyte cell number, not cell size.
Par-1b Null Mice Are Resistant to Diet-Induced Obesity and Are Hypermetabolic.
Based on the finding that Par-1b null mice are disproportionately lean, we sought to determine whether Par-1b−/− mice are resistant to weight gain when fed a high-fat diet. Par-1b null and wild-type mice were placed on a high-fat diet (42% fat by caloric content) for 16 weeks and monitored for body weight changes and food intake. Par-1b−/− male mice were resistant to weight gain relative to wild-type controls (21.37g Par-1b−/− vs. 38.25g Par-1b+/+ at 20 weeks, P = 0.005, Fig. 2A). Female Par-1b null mice did not exhibit resistance to high-fat diet-induced weight gain (data not shown), although female Par-1b−/− mice, like Par-1b−/− males, were lean on a regular chow diet (data not shown). Serum levels of insulin, leptin, adiponectin, free fatty acids, triglycerides, and cholesterol were measured to elucidate potential mechanisms by which Par-1b−/− mice were resistant to high-fat diet induced weight gain (Table 1). Leptin, an adipocyte-secreted hormone, is known to reduce feeding responses and increase insulin responsiveness and energy expenditure (32). Par-1b-null mice exhibited 5-fold lower levels of leptin relative to wild-type mice after high-fat diet feeding (6.94 ng/ml Par-1b−/− vs. 34.75 ng/ml Par-1b+/+, P = 0.012). This reduction in leptin levels was consistent with reduced adiposity in Par-1b null mice. A 5-fold reduction in serum insulin levels (0.75 ng/ml Par-1b−/− vs. 3.80 ng/ml Par-1b+/+, P = 0.057) was observed, whereas triglyceride (76.50 mg/dl Par-1b−/− vs. 117.80 mg/dl Par-1b+/+, P = 0.057) and cholesterol (141.6 mg/dl Par-1b−/− vs. 206.6 mg/dl Par-1b+/+, P = 0.019) levels were also lower in Par-1b−/− mice. Levels of adiponectin, unlike leptin, were not statistically different in Par-1b null mice, although there was a trend toward lower levels of adiponectin in Par-1b null mice (12.89 μg/ml Par-1b−/− vs. 17.38 μg/ml Par-1b+/+, P = 0.477). Histological analysis of aged mice (6-month-old males, normal chow diet) also indicated that Par-1b−/− mice were resistant to the onset of hepatic steatosis observed in wild-type littermates [supporting information (SI) Fig. 5]. This lack of hepatic fat accumulation in Par-1b−/− mice was consistent with their resistance to high-fat diet-induced obesity and reduction in white and brown fat depots.
Fig. 2.

Par-1b null mice are resistant to weight gain and are hypermetabolic on a high-fat diet. Par-1b wild-type and null males (n = 5 per genotype) were fed a high-fat diet for 16 weeks starting at 3 weeks of age. (A) Body weight of Par-1b wild-type and null mice during the high-fat diet. Averages are plotted ± standard error. All data points represent statistical differences between wild-type and null mice with P < 0.05. In an independent experiment, male Par-1b null (filled bars) and wild-type mice (open bars) (n = 8–12 per genotype) were fed a high-fat diet for 8 weeks, followed by analysis. Par-1b null mice exhibit increased metabolic rate (B), energy expenditure (C), and food intake (D) on a high-fat diet. (E) Respiratory quotient (VCO2/VO2) of Par-1b null mice is not statistically different from wild-type controls. Student t test P values are indicated.
Table 1.
Metabolic characteristics of Par-1b wild-type (WT) and null (KO) animals fed a high-fat diet for 16 weeks
| Mice | Insulin, ng/ml | Leptin, ng/ml | Adiponectin, μg/ml | Free fatty acids, μmol/liter | Triglycerides, mg/dl | Cholesterol, mg/dl |
|---|---|---|---|---|---|---|
| WT | 3.81 ± 1.19 | 34.75 ± 7.23 | 17.38 ± 4.92 | 1,550.20 ± 160.11 | 117.80 ± 15.70 | 206.6 ± 17.16 |
| KO | 0.75 ± 0.09 | 6.94 ± 1.21 | 12.89 ± 2.44 | 1,179.25 ± 184.05 | 76.50 ± 3.78 | 141.00 ± 10.76 |
| P | 0.057 | 0.012* | 0.477 | 0.171 | 0.057 | 0.019* |
Twenty-week-old male mice (n = 12 per genotype) were fasted for 5 h. Serum values are expressed as the mean ± SEM of measurements obtained. P represents P value of Student's t test (asterisk indicates significance).
Decreased adiposity and resistance to weight gain suggested that Par-1b−/− mice might exhibit alterations in metabolic rate and energy expenditure. We measured total daily energy expenditure (EE), total metabolic rate (MR), and respiratory quotients (RQ) of male mice fed a high-fat diet. Par-1b−/− mice exhibited higher MR (7% increase), daily EE (27% increase), and food intake (2-fold increase) than wild-type littermates (Fig. 2 B–E). The respiratory quotient (RQ = VCO2/VO2) was similar in wild-type and Par-1b null mice, suggesting that although null mice were hypermetabolic, they used similar ratios of carbohydrate and fats as food energy (Fig. 2E). Par-1b−/− mice were not significantly more or less active than wild-type mice (89.5 ± 30.0 Par-1b+/+ vs. 83.5 ± 20.7 Par-1b−/− activity counts). Body temperatures of Par-1b−/− mice were slightly higher than wild-type littermates, although this difference was not statistically significant (96.4°C Par-1b+/+ vs. 96.9°C Par-1b−/−, P = 0.13, n = 10 mice per genotype).
Enhanced Insulin Sensitivity and Glucose Uptake in Adipose Tissue in Par-1b−/− Mice.
Because Par-1b null mice were lean, hypermetabolic, and had reduced serum insulin levels when fed a high-fat diet, we hypothesized that these mice might have enhanced sensitivity to insulin. Consistent with measurements made in mice fed a high-fat diet (Table 1), serum insulin levels were significantly lower in Par-1b null mice relative to their wild-type littermates under both fed and fasting conditions on a standard chow diet (Fig. 3A). Despite being hypoinsulinemic, Par-1b−/− mice were normo-glycemic under fasting conditions and mildly hypoglycemic under fed conditions (Fig. 3B). Insulin tolerance tests revealed that Par-1b null mice were indeed more sensitive to insulin than their wild-type littermates (Fig. 3C). Par-1b null mice also exhibited enhanced glucose tolerance as assessed by glucose tolerance tests (Fig. 3D), indicating that pancreatic β cell function was more than sufficient to cope with an exogenously supplied glucose bolus. To further analyze insulin sensitivity in Par-1b null mice, hyperinsulinemic-euglycemic clamp studies were performed as described (33). The glucose infusion rate necessary to maintain euglycemia in the presence of a constant infusion of insulin (2.5 milliunits/kg/min) was 35% higher (P = 0.0284) in Par-1b null mice when compared with wild-type littermates (Table 2). Accordingly, the insulin-stimulated whole-body glucose turnover was increased in Par-1b null mice relative to wild-type mice (P = 0.0364). These experiments confirmed the ITT analyses (Fig. 3C), indicating that Par-1b null mice exhibited enhanced peripheral insulin sensitivity. Basal and clamp hepatic glucose production were not significantly different in Par-1b null mice. Because insulin clamp resulted in a complete suppression of hepatic glucose production in both groups of mice, we cannot exclude the possible effects of a lower-dose insulin clamp on hepatic glucose production in Par-1b null mice.
Fig. 3.

Enhanced insulin sensitivity and glucose tolerance in Par-1b null mice. (A) Retro-orbital bleeds were obtained from fed or fasted (12 h) Par-1b+/+ (open bars) and Par-1b−/− (filled bars) mice, and serum insulin levels were measured by RIA (n = 18 mice per genotype). (B) Blood glucose levels were determined for fed or fasted mice (n = 18 mice per genotype). Par-1b+/+ (open bars) and Par-1b−/− (filled bars). (C) Insulin tolerance tests (ITT) were performed by i.p. injection of 0.30 unit/kg insulin into Par-1b+/+ (diamonds) and Par-1b−/− (circles) littermates (n = 14 mice per genotype). Tail bleeds were obtained and glucose levels were monitored at 15-min intervals after insulin injection. Data are plotted as % blood glucose at time 0 before injection. (D) Glucose tolerance tests were performed by intrperitoneal injection of d-glucose at 1 mg/g body weight into Par-1b+/+ and Par-1b−/− littermates (n = 10 mice per genotype). Tail bleeds were obtained, and glucose levels were monitored at 20-min intervals after glucose injection. Data are plotted as % blood glucose at time 0 before injection. Standard error is plotted on the y axis for all values in A–D. Student's t test was performed for comparisons between two groups. P values were as follows: ****, P < 0.05; ***, P < 0.01; **, P < 0.005; *, P < 0.001.
Table 2.
Par-1b null mice (KO) exhibit increased glucose infusion rate and turnover during hyperinsulinemic–euglycemic clamp relative to wild-type mice (WT)
| Mice | Basal glucose, mg/dl | Clamp glucose, mg/dl | Glucose infusion rate, mg/kg/min | Basal HGP, mg/kg/min | Clamp HGP, mg/kg/min | Glucose turnover, mg/kg/min | Whole body glycolysis, mg/kg/min | Glycogen synthesis, mg/kg/min |
|---|---|---|---|---|---|---|---|---|
| WT | 105 ± 5 | 109 ± 6 | 45.1 ± 4.5 | 16.6 ± 2.3 | 0.6 ± 2.8 | 45.4 ± 2.9 | 29.1 ± 3.5 | 17.3 ± 2.9 |
| n | 22 | 12 | 9 | 12 | 9 | 12 | 11 | 11 |
| KO | 94 ± 5 | 113 ± 5 | 61.0 ± 4.6 | 16.1 ± 1.9 | −0.1 ± 4.5 | 58.9 ± 5.6 | 30.7 ± 4.1 | 28.2 ± 4.4 |
| n | 19 | 10 | 7 | 10 | 7 | 10 | 10 | 10 |
| P | 0.12224 | 0.6878 | 0.0284* | 0.8769 | 0.8954 | 0.0364* | 0.7576 | 0.0515 |
Mice were fed a standard chow diet (4.5% fat). Twenty-week-old male mice were subjected to clamp as described (33). Values are stated as mean ± SEM. Sample number (n) and P values from a Student's t test are indicated (asterisk indicates significance).
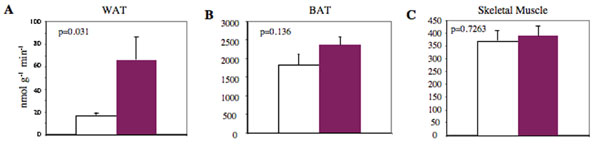
To identify the tissue(s) responsible for the observed increase in insulin sensitivity, we quantified glucose uptake into insulin-responsive tissues during hyperinsulinemic–euglycemic clamp experiments. Insulin-stimulated glucose uptake in epididymal WAT was increased ≈4-fold (66 ± 21 nmol/g/min Par-1b−/− vs. 17 ± 2 nmol/g/min Par-1b+/+, P = 0.0312) (SI Fig. 6A). A trend toward increased brown fat uptake was also observed (SI Fig. 6B). In contrast, insulin-stimulated glucose uptake in skeletal muscle (gastrocnemius) was not significantly different between Par-1b null and wild-type mice (SI Fig. 6C).
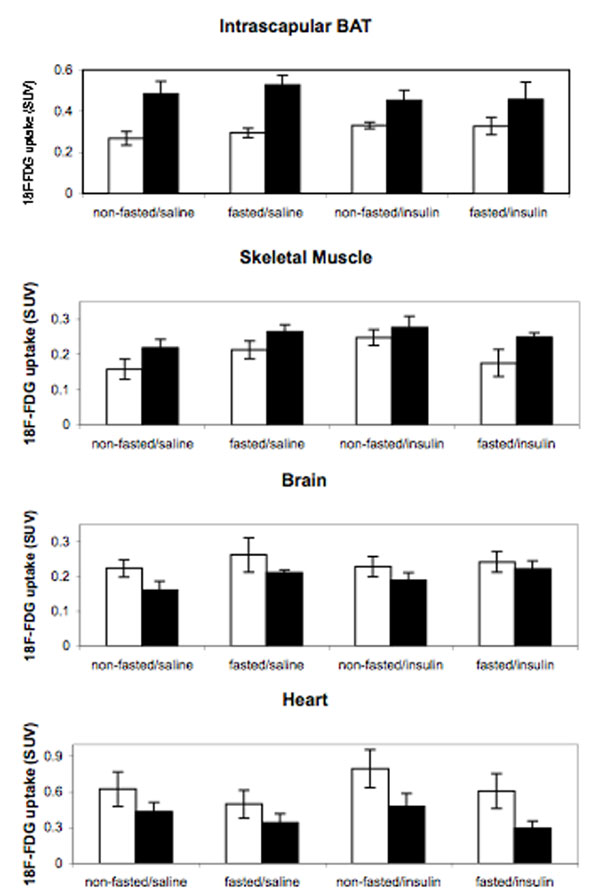
Use of the hyperinsulinemic–euglycemic clamp approach to determine 2-14C-deoxyglucose uptake indicated a dramatic increase in WAT uptake of Par-1b null mice relative to wild-type mice, but only a trend toward increased uptake in BAT. Because the level of glucose uptake in BAT in all mice tested was high relative to both WAT and skeletal muscle during clamp experiments, we reasoned that small increases in BAT uptake in the Par-1b null mice might make a significant contribution to insulin sensitivity. Consequently, we assessed BAT uptake in male mice using an alternative method to either confirm or refute the trend toward increased glucose uptake in BAT of Par-1b null mice during clamp experiments. As seen in Fig. 4, 18F-fluorodeoxyglucose (18F-FDG) microPET analyses revealed remarkably enhanced uptake in the intrascapular BAT of Par-1b null mice relative to wild-type mice. Quantitation of glucose uptake into Par-1b null BAT indicated a statistically significant 2-fold increase relative to wild-type mice in both fasting and nonfasting conditions (ANOVA, P ≪ 0.0001) (SI Fig. 7). This enhancement of glucose uptake into BAT of Par-1b null mice provided additional evidence that adipose tissue plays a significant role in altered glucose metabolism in these mice. In addition, differences observed with microPET imaging were seen in the absence of acute insulin challenge, indicating that there is a constitutive increase in glucose uptake in BAT from Par1b null mice. WAT could not be analyzed by noninvasive microPET imaging especially in the lean Par-1b null mice and thus, WAT was not included in these analyses. There was a statistically significant increase in glucose uptake in skeletal muscle in Par-1b null mice overall by ANOVA (P = 0.01). However, consistent with hyperinsulinemic–euglycemic clamp experiments, this did not reach statistical significance within individual conditions both in the absence and presence of acute insulin challenge (P ≥ 0.1). In contrast, both brain and heart tissue of Par-1b null mice showed overall reduced basal glucose uptake by microPET (ANOVA, P = 0.03 and 0.005, respectively). In brain, this was independent of insulin challenge or fasting. In fasted heart, glucose uptake was lower in both wild-type and Par-1b null mice compared with nonfasted heart, consistent with myocardial conversion to fatty acid metabolism. Par-1b null heart tissue appeared nonresponsive to insulin and thus, lower glucose uptake by Par-1b null heart tissue relative to control was accentuated by acute insulin challenge, reaching statistical significance (P = 0.05). Insulin treatment in either fasted or fed mice was predicted to result in increased SUV by microPET in BAT and skeletal/cardiac muscle because comparable insulin doses during tolerance tests indicate significant (albeit submaximal) glucose clearance from the blood. Dramatically increased 18F-FDG accumulation in response to insulin is not seen in any of these tissues, although nonfasted, insulin-treated skeletal muscle of both wild-type and knockout mice do indicate increased glucose uptake compared with saline injected mice. It is possible that the high basal rate of glucose uptake in BAT far exceeds an insulin-induced effect in this tissue. It is also possible that the 0.5 unit/kg dose of insulin is not sufficiently high to record significant changes in uptake by microPET. Manipulation of insulin dosing may provide better comparisons of insulin vs. saline conditions.
Fig. 4.

microPET analysis of 18F-FDG uptake in Par-1b+/+ and Par-1b−/− mice. Representative coronal section image of Par-1b+/+ and Par-1b−/− mice 1 h after 18F-FDG injection. Par-1b−/− exhibit consistently elevated levels of uptake in intrascapular brown fat (BAT) pads.
Analysis of Protein Expression and Insulin Signaling in Par-1b Null Adipocytes.
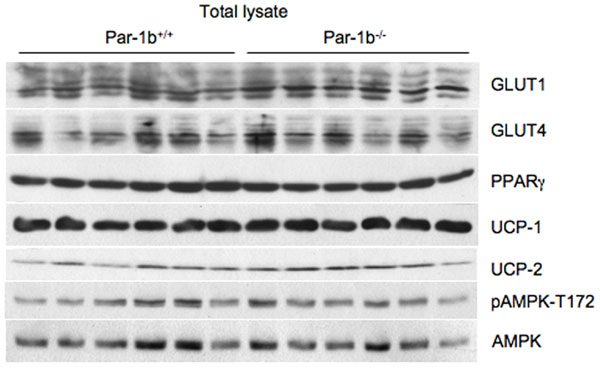
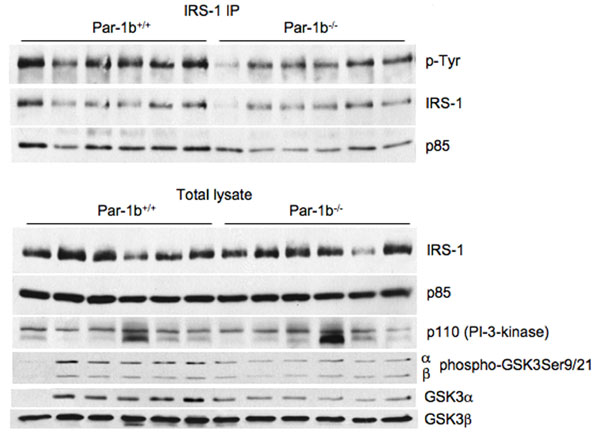
Next, we assessed Par-1b expression in insulin-sensitive tissues using a β-galactosidase reporter driven by the endogenous Par-1b promoter (SI Fig. 8) and Western blot analysis (data not shown). Par-1b is highly expressed in BAT, WAT, and liver, with no significant expression in skeletal muscle. Based on this expression pattern, it is plausible that Par-1b regulates glucose uptake via an adipocyte-autonomous mechanism. We monitored the expression of several metabolic regulators from adipose tissues of Par-1b−/− and Par-1b+/+ mice. Consistent differences in UCP1, UCP2, PPARγ or GLUT4 protein levels in BAT (SI Fig. 9) and WAT (data not shown) were not observed. GLUT1 levels appeared to be slightly higher in Par-1b null mice relative to wild-type (SI Fig. 9). We also evaluated the insulin signaling pathway in Par-1b−/− mice by injecting wild-type and null mice i.p. with 0.4 unit/kg insulin (SI Fig. 10). We did not detect increased IRS-1 tyrosine phosphorylation, IRS-1 associated PI-3 kinase, AKT activation, or GSK-3 activation, suggesting that the proximal insulin signaling pathway was largely unaffected by Par-1b deficiency (SI Fig. 10 and data not shown). Because Par-1b is a member of the AMP activated kinase (AMPK) subfamily, we also monitored phospho-AMPK and phospho-acetyl CoA carboxylase levels, neither or which were altered in the absence of Par-1b (SI Fig. 9 and data not shown).
Discussion
In this study we show that the Ser/Thr protein kinase Par-1b/MARK2/Emk is a novel regulator of adiposity, insulin sensitivity, and glucose metabolism. Par-1b−/− mice are growth retarded during embryogenesis (13.5 days postcoitus onward) and after birth. Postnatally, Par-1b null mice exhibit global reduction in organ size of ≈20%, with the exception of BAT and WAT (40% reduction relative to wild-type at 10 weeks of age). These decreases in organ mass and adiposity are concomitant with 25% reductions in serum IGF-1 levels. IGF-1 signaling is critical for embryonic and postnatal growth (34, 35). Mouse models of an IGF-1 receptor hypomorph and liver specific deletion of IGF-1 also exhibit global growth retardation with disproportionate decreases in adipose tissue (36, 37). IGF-1 signaling has also been shown to be important for the proliferation and differentiation of adipocytes in vitro (38). Taken together our data suggest that Par-1b is essential for IGF-1-mediated growth and may lead to decreased adiposity due to deficits in IGF-1-driven adipogenesis. In contrast to Par-1b−/− mice, both humans and mice deficient in IGF-1/IGF-1R signaling exhibit insulin resistance. Consequently, it is difficult to explain insulin hypersensitivity in Par-1b−/− mice based solely on IGF-1 deficiency. Growth hormone receptor (GHR−/−) deficient mice, like Par-1b nulls, exhibit increased insulin sensitivity and growth retardation. However, unlike Par-1b null mice, GHR−/− mice also display increased adiposity with age, susceptibility to diet-induced obesity, reduced body temperatures and normal embryonic growth (39–41). These data suggest that the Par-1b−/− metabolic phenotypes described here are not likely to be solely a result of GH-mediated effects.
Resistance to weight gain on a high-fat diet and hyperphagy concomitant with increased glucose uptake into WAT and BAT are indicative of a metabolic uncoupling defect. Although we do not detect changes in the protein levels of UCP1, UCP2, or PPARγ, the activities of these and/or other proteins critical for normal metabolic function may be altered in Par-1b−/− mice. Average body temperatures of Par-1b−/− mice are slightly elevated, suggesting that increased energy consumption is most likely dissipated via increased heat generation. Although a physiologically normal increase in BAT-mediated thermogenesis (due to smaller body size and reduced adiposity) might lead to enhanced glucose uptake in BAT, this appears not to be the case because Par-1b−/− mice do not exhibit reduced body temperatures. Recent studies have shown that perturbations in β-adrenergic activity and subsequent BAT-mediated thermogenesis can regulate diet induced obesity and insulin sensitivity in the mouse (42, 43). These studies suggest that a direct effect of Par-1b on β-adrenergic activity and/or BAT-mediated thermogenesis could explain several of the phenotypes described here.
We did not detect significant increases in IRS-1, AKT or GSK3 phosphorylation in insulin-treated Par-1b−/− adipose tissue, indicating that increased glucose uptake into adipose tissue is not due to proximal insulin signaling enhancement. FDG-microPET imaging of Par-1b−/− mice indicates that enhanced glucose uptake in BAT can be observed after fasting, in the absence of an acute insulin challenge. This finding suggests an insulin independent effect in BAT-mediated glucose uptake. It is possible that Par-1b acts downstream of the activation of AKT in glucose transport. Interestingly, the yeast homologues of Par-1b, Kin1, and Kin2, have been shown to play a role in vesicular trafficking via interaction with the exocyst complex and it has been suggested that mammalian Par-1b interacts with syntaxin-4 (2). The exocyst and syntaxin-4 have been implicated in GLUT4 transport (44–49). In addition, Par-3/ASIP, which is a direct downstream target of Par-1b, has been shown by using overexpression studies to inhibit glucose uptake in 3T3L1 adipocytes (50). Both LKB1 and atypical PKC, two upstream regulators of Par-1, have also been shown to play a role in regulation of glucose metabolism (20, 52, 53). AMPK and Par-1b, which share significant homology within their kinase domains, are part of a larger subfamily of kinases that includes 13 members, most of which appear to be regulated at least in part by LKB1. Indeed, as our data suggests for Par-1b, AMPK regulates glucose uptake by a phospatidylinositol 3-kinase independent mechanism (54). Par-1b and AMPK also share a nearly identical phosphorylation consensus sequence as determined by peptide library screening (Reuben Shaw, Ben Turk, and L.C.C., unpublished data). Arguing against a role for Par-1b in GLUT4 mediated transport is a recent RNAi screen performed in 3T3L1 adipocytes (51). This study indicates that knockdown of either Par-1b/MARK2 or C-TAK1/MARK3 had no significant effect on 2-deoxyglucose uptake in either the basal state or in response to insulin. Assuming that the efficacy of RNAi knockdown of these two proteins was sufficient to block their function, these data argue that Par-1b has no direct role in GLUT4-mediated glucose uptake and argues against an adipocyte-autonomous function for Par-1b in glucose uptake. Conclusive determination of the mechanism(s) by which Par-1b regulates glucose uptake will await further analyses, particularly tissue-specific deletion of Par-1b.
The finding that Par-1b regulates glucose metabolism and adiposity presents the exciting possibility that Par-1b kinase inhibitors might be used to improve insulin sensitivity and/or ameliorate obesity. Par-1b should be amenable to targeting by small molecules and inhibition of the kinase might be predicted to improve several symptoms associated with type 2 diabetes.
Materials and Methods
Further Details.
For further details, see SI Text.
Animal Procedures.
All animal procedures were approved by the Washington University School of Medicine Animal Studies Committee. The generation of Par-1b null mice has been described (31). Heterozygous Par-1b mice of the strain background C57BL/6;129 × 1SvJ were interbred to generate the mice used in this study. Mice encoding β-galactosidase in the Par-1b gene were kindly provided by M. Darmon (30). Unless otherwise noted, mice were fed a standard chow diet (Purina Mills, St. Louis, MO, Lab Diet 5053 containing 4.5% fat, 55% carbohydrate, 20% protein, 4.7% fiber).
High-Fat Diet Studies.
At 4 weeks of age, Par-1b KO and wild-type mice were weighed, and their regular rodent chow was replaced with Adjusted Calories Diet (42% fat) from Harlan Teklad (Madison, WI) (88137). The weight of the high-fat chow was recorded and food consumption, and mouse weight was determined for individual mice on a weekly basis for 16 weeks.
MicroPET Studies.
For microPET imaging, cohorts of 8-week-old male wild-type and Par-1b null mice were repetitively imaged once a week for four consecutive weeks, each time under a different condition. Mice were either fasted overnight or allowed access to standard rodent chow (nonfasted). The next morning, either 0.5 unit/kg insulin (Humulin N) (Eli Lilly, Indianapolis, IN) or saline was administered to mice by IP injection. Thirty minutes after the IP injection, mice were lightly anesthetized with isoflurane followed by a tail vein injection of 18F-FDG (≈400–500 μCi). Immediately after injection of radiotracer, mice were placed supine within the microPET scanner (R4, Concorde MicroSystems, Knoxville, TN) and imaged (≈10 min acquisition time; 1 bed position; OSEM reconstruction; isotropic image resolution 1.8 mm at 1 cm, 2.68 mm at 2 cm). Mice were allowed to recover, then anesthetized and imaged again at 1 and 2 h after injection of radiotracer. MicroPET images were corrected for decay, but not attenuation or scatter, and stacked regions-of-interest (ROI) of relevant tissues and organs were analyzed with AnalyzePC 6.0 software. Data for accumulation of 18F-FDG on microPET images were expressed as standard uptake values (SUV), representing counts per gram of tissue divided by injected dose of radioactivity per gram of animal weight (55, 56). Data are presented as mean values ± SEM. Groups were statistically analyzed by one-way NOVA and Student's t test (Microsoft Excel).
Supplementary Material
Acknowledgments
We thank M. Darmon (INSERM, Nice, France) for providing mice encoding β-galactosidase in the Par-1b locus; John Engelbach, Lori Strong, and Jerrel Rutlin for assistance with microPET imaging; the Research Resource for Cancer Imaging for production of 18F-FDG; the Siteman Cancer Center Small Animal Imaging and Embryonic Stem Cell Cores and the Digestive Disease Research Core [National Institutes of Health (NIH) Grant DK52574] for assistance with this study; and Clay Semenkovich, Alan Perlmutt, Ben Neel, Adam Shaywitz and The Metabolic Physiology Core of NIH P30 57521 for helpful suggestions throughout the study. This work was funded in part by NIH Grants P50 CA94056 (to D. P.-W.), RO1 GM56203 (to L.C.C.) and R01 DK40936 (to G.I.S.). The studies conducted at the NIH–Yale Mouse Metabolic Phenotyping Center were supported by grants from the United States Public Health Service Grant U24 DK-59635 (to G.I.S. and J.K.K.) and American Diabetes Association Grant 1-04-RA-47 (to J.K.K.). H.P.-W. and G.I.S. are Investigators of the Howard Hughes Medical Institute.
Abbreviations
- WAT
white adipose tissue
- BAT
brown adipose tissue.
Footnotes
The authors declare no conflict of interest.
This article contains supporting information online at www.pnas.org/cgi/content/full/0701179104/DC1.
References
- 1.Guo S, Kemphues KJ. Cell. 1995;81:611–620. doi: 10.1016/0092-8674(95)90082-9. [DOI] [PubMed] [Google Scholar]
- 2.Elbert M, Rossi G, Brennwald P. Mol Biol Cell. 2005;16:532–549. doi: 10.1091/mbc.E04-07-0549. [DOI] [PMC free article] [PubMed] [Google Scholar]
- 3.Drewes G, Nurse P. FEBS Lett. 2003;554:45–49. doi: 10.1016/s0014-5793(03)01080-9. [DOI] [PubMed] [Google Scholar]
- 4.Cox DN, Lu B, Sun TQ, Williams LT, Jan YN. Curr Biol. 2001;11:75–87. doi: 10.1016/s0960-9822(01)00027-6. [DOI] [PubMed] [Google Scholar]
- 5.Huynh JR, Petronczki M, Knoblich JA, St Johnston D. Curr Biol. 2001;11:901–906. doi: 10.1016/s0960-9822(01)00244-5. [DOI] [PubMed] [Google Scholar]
- 6.Doerflinger H, Benton R, Torres IL, Zwart MF, St Johnston D. Curr Biol. 2006;16:1090–1095. doi: 10.1016/j.cub.2006.04.001. [DOI] [PubMed] [Google Scholar]
- 7.Bayraktar J, Zygmunt D, Carthew RW. J Cell Sci. 2006;119:711–721. doi: 10.1242/jcs.02789. [DOI] [PubMed] [Google Scholar]
- 8.Ossipova O, Dhawan S, Sokol S, Green JB. Dev Cell. 2005;8:829–841. doi: 10.1016/j.devcel.2005.04.011. [DOI] [PubMed] [Google Scholar]
- 9.Bohm H, Brinkman V, Drab M, Henske A, Kurzchalia TV. Curr Biol. 1997;7:603–606. doi: 10.1016/s0960-9822(06)00260-0. [DOI] [PubMed] [Google Scholar]
- 10.Biernat J, Wu YZ, Timm T, Zheng-Fischhofer Q, Mandelkow E, Meijer L, Mandelkow EM. Mol Biol Cell. 2002;13:4013–4028. doi: 10.1091/mbc.02-03-0046. [DOI] [PMC free article] [PubMed] [Google Scholar]
- 11.Cohen D, Brennwald PJ, Rodriguez-Boulan E, Musch A. J Cell Biol. 2004;164:717–727. doi: 10.1083/jcb.200308104. [DOI] [PMC free article] [PubMed] [Google Scholar]
- 12.Cohen D, Rodriguez-Boulan E, Musch A. Proc Natl Acad Sci USA. 2004;101:13792–7. doi: 10.1073/pnas.0403684101. [DOI] [PMC free article] [PubMed] [Google Scholar]
- 13.Chen YM, Wang QJ, Hu HS, Yu PC, Zhu J, Drewes G, Piwnica-Worms H, Luo ZG. Proc Natl Acad Sci USA. 2006;103:8534–8539. doi: 10.1073/pnas.0509955103. [DOI] [PMC free article] [PubMed] [Google Scholar]
- 14.Drewes G, Trinczek B, Illenberger S, Biernat J, Schmitt-Ulms G, Meyer HE, Mandelkow EM, Mandelkow E. J Biol Chem. 1995;270:7679–7688. doi: 10.1074/jbc.270.13.7679. [DOI] [PubMed] [Google Scholar]
- 15.Drewes G, Ebneth A, Preuss U, Mandelkow E-M, Mandelkow E. Cell. 1997;89:297–308. doi: 10.1016/s0092-8674(00)80208-1. [DOI] [PubMed] [Google Scholar]
- 16.Nishimura I, Yang Y, Lu B. Cell. 2004;116:671–682. doi: 10.1016/s0092-8674(04)00170-9. [DOI] [PubMed] [Google Scholar]
- 17.Doerflinger H, Benton R, Shulman JM, St Johnston D. Development (Cambridge, UK) 2003;130:3965–3975. doi: 10.1242/dev.00616. [DOI] [PubMed] [Google Scholar]
- 18.Sun TQ, Lu B, Feng JJ, Reinhard C, Jan YN, Fantl WJ, Williams LT. Nat Cell Biol. 2001;3:628–636. doi: 10.1038/35083016. [DOI] [PubMed] [Google Scholar]
- 19.Ducharme NA, Hales CM, Lapierre LA, Ham AJ, Oztan A, Apodaca G, Goldenring JR. Mol Biol Cell. 2006;17:3625–3637. doi: 10.1091/mbc.E05-08-0736. [DOI] [PMC free article] [PubMed] [Google Scholar]
- 20.Lizcano JM, Goransson O, Toth R, Deak M, Morrice NA, Boudeau J, Hawley SA, Udd L, Makela TP, Hardie DG, Alessi DR. EMBO J. 2004;23:833–843. doi: 10.1038/sj.emboj.7600110. [DOI] [PMC free article] [PubMed] [Google Scholar]
- 21.Alessi DR, Sakamoto K, Bayascas JR. Annu Rev Biochem. 2006;75:137–163. doi: 10.1146/annurev.biochem.75.103004.142702. [DOI] [PubMed] [Google Scholar]
- 22.Hurov JB, Watkins JL, Piwnica-Worms H. Curr Biol. 2004;14:736–741. doi: 10.1016/j.cub.2004.04.007. [DOI] [PubMed] [Google Scholar]
- 23.Suzuki A, Hirata M, Kamimura K, Maniwa R, Yamanaka T, Mizuno K, Kishikawa M, Hirose H, Amano Y, Izumi N, et al. Curr Biol. 2004;14:1425–1435. doi: 10.1016/j.cub.2004.08.021. [DOI] [PubMed] [Google Scholar]
- 24.Vaccari T, Rabouille C, Ephrussi A. Curr Biol. 2005;15:255–261. doi: 10.1016/j.cub.2005.01.033. [DOI] [PubMed] [Google Scholar]
- 25.Kusakabe M, Nishida E. EMBO J. 2004;23:4190–4201. doi: 10.1038/sj.emboj.7600381. [DOI] [PMC free article] [PubMed] [Google Scholar]
- 26.Inglis JD, Lee M, Hill RE. Mamm Genome. 1993;4:401–403. doi: 10.1007/BF00360595. [DOI] [PubMed] [Google Scholar]
- 27.Peng C.-Y., Graves PR, Ogg S, Thoma RS, Byrnes MJ, Wu Z, Stephenson M, Piwnica-Worms H. Cell Growth Differ. 1998;9:197–208. [PubMed] [Google Scholar]
- 28.Kato T, Satoh S, Okabe H, Kitahara O, Ono K, Kihara C, Tanaka T, Tsunoda T, Yamaoka Y, Nakamura Y, Furukawa Y. Neoplasia. 2001;3:4–9. doi: 10.1038/sj.neo.7900132. [DOI] [PMC free article] [PubMed] [Google Scholar]
- 29.Trinczek B, Brajenovic M, Ebneth A, Drewes G. J Biol Chem. 2004;279:5915–5923. doi: 10.1074/jbc.M304528200. [DOI] [PubMed] [Google Scholar]
- 30.Bessone S, Vidal F, Le Bouc Y, Epelbaum J, Bluet-Pajot M.-T., Darmon M. Dev Biol. 1999;214:87–101. doi: 10.1006/dbio.1999.9379. [DOI] [PubMed] [Google Scholar]
- 31.Hurov JB, Stappenbeck TS, Zmasek CM, White LS, Ranganath SH, Russell JH, Chan AC, Murphy KM, Piwnica-Worms H. Mol Cell Biol. 2001;21:3206–3219. doi: 10.1128/MCB.21.9.3206-3219.2001. [DOI] [PMC free article] [PubMed] [Google Scholar]
- 32.Bjorbaek C, Kahn BB. Recent Prog Horm Res. 2004;59:305–331. doi: 10.1210/rp.59.1.305. [DOI] [PubMed] [Google Scholar]
- 33.Kim JK, Fillmore JJ, Sunshine MJ, Albrecht B, Higashimori T, Kim DW, Liu ZX, Soos TJ, Cline GW, O'Brien WR, et al. J Clin Invest. 2004;114:823–827. doi: 10.1172/JCI22230. [DOI] [PMC free article] [PubMed] [Google Scholar]
- 34.Baker J, Liu JP, Robertson EJ, Efstratiadis A. Cell. 1993;75:73–82. [PubMed] [Google Scholar]
- 35.Liu JP, Baker J, Perkins AS, Robertson EJ, Efstratiadis A. Cell. 1993;75:59–72. [PubMed] [Google Scholar]
- 36.Holzenberger M, Hamard G, Zaoui R, Leneuve P, Ducos B, Beccavin C, Perin L, Le Bouc Y. Endocrinology. 2001;142:4469–4478. doi: 10.1210/endo.142.10.8461. [DOI] [PubMed] [Google Scholar]
- 37.Sjogren K, Jansson JO, Isaksson OG, Ohlsson C. Endocrine. 2002;19:249–256. doi: 10.1385/ENDO:19:3:249. [DOI] [PubMed] [Google Scholar]
- 38.Gregoire FM, Smas CM, Sul HS. Physiol Rev. 1998;78:783–809. doi: 10.1152/physrev.1998.78.3.783. [DOI] [PubMed] [Google Scholar]
- 39.Bartke A. Endocrinology. 2005;146:3718–3723. doi: 10.1210/en.2005-0411. [DOI] [PubMed] [Google Scholar]
- 40.Berryman DE, List EO, Kohn DT, Coschigano KT, Seeley RJ, Kopchick JJ. Endocrinology. 2006;147:2801–2808. doi: 10.1210/en.2006-0086. [DOI] [PubMed] [Google Scholar]
- 41.Hauck SJ, Hunter WS, Danilovich N, Kopchick JJ, Bartke A. Exp Biol Med. 2001;226:552–558. doi: 10.1177/153537020122600607. [DOI] [PubMed] [Google Scholar]
- 42.Bachman ES, Dhillon H, Zhang CY, Cinti S, Bianco AC, Kobilka BK, Lowell BB. Science. 2002;297:843–845. doi: 10.1126/science.1073160. [DOI] [PubMed] [Google Scholar]
- 43.Kim H, Pennisi PA, Gavrilova O, Pack S, Jou W, Setser-Portas J, East-Palmer J, Tang Y, Manganiello VC, Leroith D. Am J Physiol. 2006;290:E1227–E1236. doi: 10.1152/ajpendo.00344.2005. [DOI] [PubMed] [Google Scholar]
- 44.Ewart MA, Clarke M, Kane S, Chamberlain LH, Gould GW. J Biol Chem. 2005;280:3812–3816. doi: 10.1074/jbc.M409928200. [DOI] [PubMed] [Google Scholar]
- 45.Inoue M, Chang L, Hwang J, Chiang SH, Saltiel AR. Nature. 2003;422:629–633. doi: 10.1038/nature01533. [DOI] [PubMed] [Google Scholar]
- 46.Spurlin BA, Park SY, Nevins AK, Kim JK, Thurmond DC. Diabetes. 2004;53:2223–2231. doi: 10.2337/diabetes.53.9.2223. [DOI] [PubMed] [Google Scholar]
- 47.Yang C, Coker KJ, Kim JK, Mora S, Thurmond DC, Davis AC, Yang B, Williamson RA, Shulman GI, Pessin JE. J Clin Invest. 2001;107:1311–1318. doi: 10.1172/JCI12274. [DOI] [PMC free article] [PubMed] [Google Scholar]
- 48.Zeigerer A, Lampson MA, Karylowski O, Sabatini DD, Adesnik M, Ren M, McGraw TE. Mol Biol Cell. 2002;13:2421–2435. doi: 10.1091/mbc.E02-02-0071. [DOI] [PMC free article] [PubMed] [Google Scholar]
- 49.Kessler A, Tomas E, Immler D, Meyer HE, Zorzano A, Eckel J. Diabetologia. 2000;43:1518–1527. doi: 10.1007/s001250051563. [DOI] [PubMed] [Google Scholar]
- 50.Kotani K, Ogawa W, Hashiramoto M, Onishi T, Ohno S, Kasuga M. J Biol Chem. 2000;275:26390–26395. doi: 10.1074/jbc.M002537200. [DOI] [PubMed] [Google Scholar]
- 51.Tang X, Guilherme A, Chakladar A, Powelka AM, Konda S, Virbasius JV, Nicoloro SM, Straubhaar J, Czech MP. Proc Natl Acad Sci USA. 2006;103:2087–2092. doi: 10.1073/pnas.0507660103. [DOI] [PMC free article] [PubMed] [Google Scholar]
- 52.Shaw RJ, Lamia KA, Vasquez D, Koo SH, Bardeesy N, Depinho RA, Montminy M, Cantley LC. Science. 2005;310:1642–1646. doi: 10.1126/science.1120781. [DOI] [PMC free article] [PubMed] [Google Scholar]
- 53.Farese RV, Sajan MP, Standaert ML. Biochem Soc Trans. 2005;33:350–353. doi: 10.1042/BST0330350. [DOI] [PubMed] [Google Scholar]
- 54.Long YC, Zierath JR. J Clin Invest. 2006;116:1776–1783. doi: 10.1172/JCI29044. [DOI] [PMC free article] [PubMed] [Google Scholar]
- 55.Luker G, Sharma V, Pica C, Dahlheimer J, Li W, Ochesky J, Ryan C, Piwnica-Worms H, Piwnica-Worms D. Proc Natl Acad Sci USA. 2002;99:6961–6966. doi: 10.1073/pnas.092022399. [DOI] [PMC free article] [PubMed] [Google Scholar]
- 56.Luker GD, Sharma V, Piwnica-Worms D. Methods. 2003;29:110–122. doi: 10.1016/s1046-2023(02)00285-2. [DOI] [PubMed] [Google Scholar]
Associated Data
This section collects any data citations, data availability statements, or supplementary materials included in this article.