Abstract
The intracellular activation of trypsinogen, which is both pH- and calcium-dependent, is an important early step in the development of acute pancreatitis. The cellular compartment in which trypsinogen activation occurs currently is unknown. We therefore investigated the site of intracellular trypsinogen activation by using an established cellular model of acute pancreatitis: supramaximal stimulation of pancreatic acinar cells with cholecystokinin. We used fluorescent dextrans as fluid phase tracers and observed the cholecystokinin-elicited formation and translocation of large endocytic vacuoles. The fluorescent probe rhodamine 110 bis-(CBZ-l-isoleucyl-l-prolyl-l-arginine amide) dihydrochloride (BZiPAR) was used to detect trypsinogen activation. Fluid phase tracers were colocalized with cleaved BZiPAR, indicating that trypsinogen activation occurred within endocytic vacuoles. The development of BZiPAR fluorescence was inhibited by the trypsin inhibitor benzamidine. Fluorescein dextran and Oregon Green 488 BAPTA-5N were used to measure endosomal pH and calcium, respectively. The pH in endocytic vacuoles was 5.9 ± 0.1, and the calcium ion concentration was 37 ± 11 μM. The caged calcium probe o-nitrophenyl EGTA and UV uncaging were used to increase calcium in endocytic vacuoles. This increase of calcium caused by calcium uncaging was followed by recovery to the prestimulated level within ≈100 s. We propose that the initiation of acute pancreatitis depends on endocytic vacuole formation and trypsinogen activation in this compartment.
Keywords: Ca2+, endocytosis, pancreatitis, trypsin
Acute pancreatitis is an important disease that can be triggered by a variety of factors, including excessive alcohol consumption (1–4) and obstruction of the ampulla of Vater by gall stones (5, 6). Supramaximal stimulation with secretagogues [e.g., cholecystokinin-8 (CCK) or caerulein] is one of the established models for inducing experimental acute pancreatitis. Intracellular trypsinogen activation has been found in clinical cases as well as in a number of models of acute pancreatitis and justifiably is considered to be an important early step in the etiology of this disease (7–15). The intracellular distribution of trypsin activation sites can be probed by antibodies for trypsinogen-activation peptide (TAP) (8, 9, 16) and in living cells by rhodamine 110 bis-(CBZ-l-isoleucyl-l-prolyl-l-arginine amide) dihydrochloride (BZiPAR), a substrate for trypsin that becomes fluorescent after cleavage by the protease (10, 12, 17). The activation of trypsinogen occurs in a previously unidentified cellular compartment (18). Experiments with purified enzyme show that Ca2+ is important for activation of anionic and cationic trypsinogen (19). An acidic environment also is important for trypsinogen activation (20–22). The site of activation may be organelles that are formed by fusion of secretory vesicles and lysosomes, and the lysosomal enzyme cathepsin B could be responsible for the trypsinogen activation (9, 16, 23–30). Colocalization of trypsinogen and cathepsin B was reported for zymogen granules (25). Zymogen granules have been considered as a site of activation of trypsinogen (12), but more than one activation site for trypsinogen was suggested (18). A prominent feature of acute pancreatitis is the formation of large cytosolic vacuoles (12, 16, 29, 31, 32). Cytosolic vacuoles are possible sites for the intracellular activation of trypsinogen (9). Preferential accumulation of acridine orange was resolved in large intracellular vacuoles generated in pancreatic acinar cells, suggesting their acidic nature (33). The acidity of vacuoles is compatible both with cathepsin B-dependent activation of trypsinogen and with autoactivation of cationic trypsinogen (19, 23, 25).
Recent studies performed by using two-photon microscopy identified formation of large Ω-shaped postexocytic structures in acinar cells stimulated with calcium-releasing secretagogues (34–36). Disassembly of Ω-shaped structures was shown to occur by slow piecemeal removal of very small endosomes from the surface of these membrane protrusions (36). Interestingly, it was reported that a supramaximal (but not physiological) CCK concentration can induce further expansion of Ω-shaped profiles, leading to formation of large spherical structures (35). Here, we have tested the hypothesis that, after protracted stimulation, these large spherical structures disconnect from the apical membrane and scatter in the cytoplasm, giving rise to large endocytic vacuoles. In our study, we use the term endocytosis in its broadest meaning, “uptake of material into the cell by an invagination of the plasma membrane and its internalization in a membrane-bounded vesicle” (37), without ascribing any specific mechanism to this internalization.
We also have tested whether the activation of trypsinogen occurs in these endocytic vacuoles and characterized the parameters important for the activation of trypsinogen, [Ca2+], and pH in endocytic vacuoles.
Results
Formation, Translocation, and Fusion of Endocytic Vacuoles.
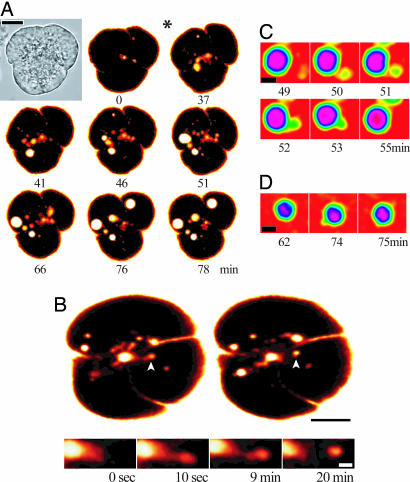
A supramaximal concentration of CCK (10 nM) initiated an expansion of the apical lumen of the acinar cells, which was followed by formation of large endocytic structures (1–6 μm in diameter) filled with the extracellular tracer Texas red dextran (TRD) [Fig. 1A and supporting information (SI) Movie 1]. Importantly, we found that these large endocytic vacuoles were scattered throughout the cytoplasm of the cell and could be detected not only in the apical pole (point of formation) but also in the central and basal regions of the cell (Fig. 1A and SI Movie 1). We even observed vacuoles in close proximity to the basal membrane (Fig. 1A, last two images), but we did not observe fusion of vacuoles with the basal membrane. Further details of the process of formation of endocytic vacuoles were obtained by using two-photon microscopy (Fig. 1B). In particular, we observed a rapid expansion of the pancreatic lumen and the formation of large postexocytic Ω profiles, which was followed by an extension of the channel linking the postexocytic structure with the lumen and finally disconnection of the large endocytic vacuole (Fig. 1B). The observation of the entire process of vacuole formation confirms its endocytic nature and suggests that the large vacuoles are formed “complete” by disconnection of postexocytic structures and not assembled by fusion of small endosomes. This process could not be visualized in sufficient detail by using confocal microscopy because of strong scattering of visible light in the apical part of the cell (in SI Fig. 7, note the strong reflectance from the apical part of the cell).
Fig. 1.
Formation and dynamics of large endocytic vacuoles. (A) Different stages of vacuole formation and translocation. (Scale bar: 10 μm.) A cluster of pancreatic acinar cells (shown in transmitted light in Top Left and fluorescence in the remaining images) was incubated in the presence of TRD. Addition of CCK (10 nM, at 17-min time point as indicated by ∗) resulted in the formation of large endocytic vacuoles. (B) Two-photon imaging of the early stages of vacuole formation elicited by 10 nM CCK. (Scale bar: 10 μm.) Upper Left shows the postexocytic Ω shapes connected to the lumen. Upper Right shows the disconnection of vacuoles. (Lower) Fragments of cells shown above. (Scale bar: 2 μm.) The gallery illustrates the formation of the postexocytic Ω shape (10 s), extension of the channel linking the main part of the postexocytic structure to the lumen (9 min), which finally is followed by the disconnection of the endocytic vacuole (20 min) (the same structure is identified in Upper by white arrowheads). (C) Fusion between two endocytic structures, illustrated by a sequence of confocal images. (D) Formation of protrusion on the surface of large endocytic vacuole. C and D are fragments of the cell cluster shown in Fig. 1A. (Scale bars: 2 μm.)
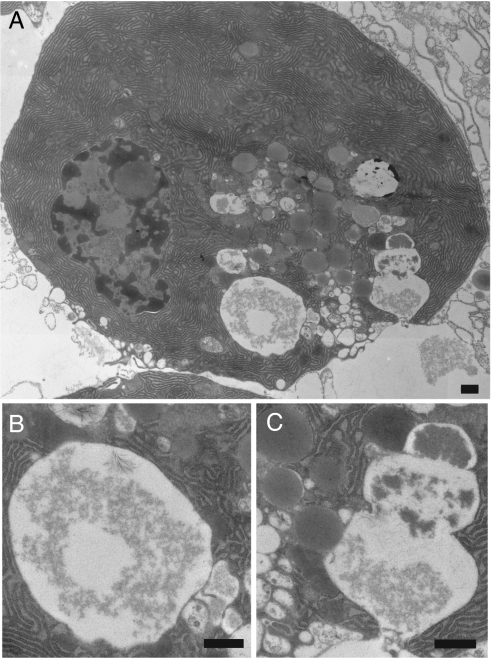
While monitoring endocytic vacuoles in the central and basal regions of the cells, we observed fusion between labeled endocytic compartments (Fig. 1C). We also resolved the formation of protrusions on the surface of large vacuoles that could be interpreted as fusion with small unlabeled organelles (Fig. 1D). Formation of large vacuoles was not observed in the absence of CCK or after prolonged stimulation with a physiological concentration of CCK (10 pM; data not shown). Electron microscopy indicated that, in our condition of supramaximal stimulation (10 nM CCK), both large vacuoles (Fig. 2 A and B) and postexocytic structures (Fig. 2 A and C) indeed can be observed (Fig. 2). Postexocytic structures contained a gradient of electron-dense material and were surrounded (and in some in close contact; see Fig. 2C) with secretory granules. They most likely are formed by compound exocytosis (as reported in ref. 35). Using electron microscopy and our procedure of sample preparation, we were able to visualize the formation of clathrin-coated vesicle in fibroblasts (data not shown), but we were unable to observe clathrin-coating of either postexocytic structures or large vacuoles in pancreatic acinar cells stimulated with 10 nM CCK. This finding indicates that, at variance with endocytosis under physiological conditions, vacuole formation occurs by a clathrin-independent mechanism.
Fig. 2.
Electron microscopy images of vacuoles in pancreatic acinar cell stimulated with 10 nM CCK. (All scale bars: 500 nm.) (A) Acinar cell that was fixed 30 min after CCK application. (B) Fragment of the image in A showing a large vacuole. (C) Fragment of the image in A showing postexocytic structure. Note close contact between the postexocytic structure and the secretory granules (both approaching the postexocytic structure from the left). Also note the gradient of electron-dense material in the postexocytic structure.
Using immunostaining and indicators linked to fixable dextrans, we compared the localization of endocytic vacuoles with the localization of known endocytic markers early endosome antigen 1 (EEA1) and lysosomal-associated membrane protein 1 (LAMP1) in pancreatic acinar cells. We have not found colocalization between endocytosed material and EEA1 (see SI Fig. 8) but observed partial colocalization of LAMP1 with endocytosed dextran (see SI Fig. 9).
Glycyl-phenylalanine-2-naphthylamide (GPN), which is cleaved by lysosomal enzyme cathepsin C, has been shown to destroy lysosomes by osmotic shock (38). In our experiment, GPN indeed dissipated staining of Lyso-Tracker (lysosomal marker) but had no effect on the distribution of endocytosed dextran (n = 8; see SI Fig. 10).
Measurement of Trypsin Activity in Endocytic Vacuoles.
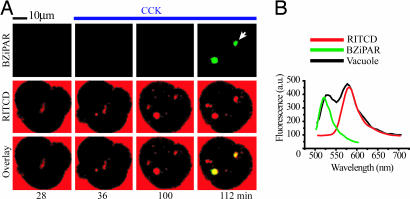
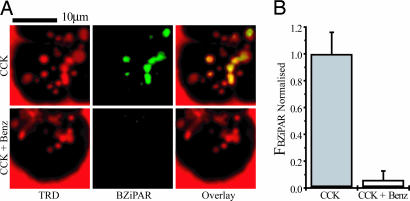
Cells were stimulated with supramaximal CCK (10 nM) in the presence of the trypsin activity probe BZiPAR. The BZiPAR fluorescence developed in 63% of endocytic vacuoles (n = 114), as revealed by colocalization of BZiPAR fluorescence with the fluorescence of endocytosed dextran (Fig. 3A). There was a delay of 4–16 min between vacuole detection and the development of BZiPAR fluorescence. The earliest time at which trypsin activity could be detected in endocytic vacuoles was 28 min after CCK application. It is, however, important to note that we are patrolling only one confocal section, and the formation of vacuoles/activation of trypsinogen could occur earlier in other regions of the cell. Spectral analysis of vacuoles (Fig. 3A, white arrow) revealed two peaks corresponding to the emission spectra of rhodamine B isothiocyanate-dextran (RITCD) and cleaved BZiPAR (Fig. 3B). This finding suggests that the fluorescence generated in the vacuoles occurs specifically because of BZiPAR cleavage. The development of BZiPAR fluorescence in endocytic vacuoles effectively was suppressed (P < 0.05) by the trypsin inhibitor benzamidine (Fig. 4), which was added to the extracellular solution 30 min before CCK stimulation. Notably, benzamidine treatment did not prevent vacuole formation, indicating that trypsin activity is not required for vacuole formation (Fig. 4A). We also failed to observe cleaved BZiPAR fluorescence within endocytic vacuoles formed in the presence of soybean trypsin inhibitor (n = 3). To test the possibility that active trypsin could have been endocytosed, we added trypsin to the extracellular solution containing BZiPAR, which resulted in a bright staining of the basal part of the cells, independently of whether the cells were resting (n = 40; see SI Fig. 7) or stimulated with CCK (n = 20). The distribution of fluorescence was drastically different from that described in the above experiments (Figs. 3 and 4), suggesting that the development of BZiPAR fluorescence within endocytic vacuoles cannot be explained by internalization of extracellular trypsin. Cathepsin B inhibitor CA074me, added to extracellular solution 30 min before supramaximal CCK stimulation, significantly (P < 0.05) decreased the BZiPAR fluorescence in endocytic vacuoles to 34 ± 7% (n = 38) of that in untreated CCK-stimulated cells (n = 34).
Fig. 3.
Trypsin activity in endocytic vacuoles. (A) Colocalization of endocytic tracer and cleaved BZiPAR. Cells were incubated with RITCD (100 μM) and BZiPAR (100 μM). (Left) The fluorescence of the indicators before stimulation. CCK (10 nM) was added after 30 min from the beginning of the experiment and maintained in extracellular solution (blue line at top) throughout the experiment together with both indicators. Note that vacuole formation (RITCD fluorescence, shown in red; Middle) precedes the appearance of cleaved BZiPAR fluorescence (green; Top). Overlay of RITCD fluorescence and BZiPAR fluorescence is shown in Bottom. (B) Emission spectra of endocytic vacuole labeled with RITCD and BZiPAR. The analyzed vacuole is indicated by a white arrow in Fig. 2A. The black trace shows the spectrum recorded from the vacuole. The green trace shows the spectrum of cleaved BZiPAR (recorded from a drop of BZiPAR and trypsin-containing solution placed on cover glass). The red trace shows the spectrum of RITCD.
Fig. 4.
Benzamidine-inhibited trypsin activity in endocytic vacuoles. (A) Endocytic vacuoles formed to CCK (10 nM) stimulation are revealed by TRD fluorescence (Left). In the control (CCK-stimulated, benzamidine-free cells) BZiPAR fluorescence developed within endocytic vacuoles (Upper Center). Upper Right shows the partial colocalization of the probes. In benzamidine (1 mM)-treated cells, CCK induced the formation of endocytic vacuoles (Lower Left) but no activation of BZiPAR fluorescence (Lower Center). In these experiments (Fig. 3 A and B), cells were incubated with CCK for 2 h and 30 min at 35°C in the presence or absence of benzamidine. (B) Graph showing values of normalized BZiPAR fluorescence in CCK-induced endocytic vacuoles. The values of BZiPAR fluorescence were normalized by the mean value for control (benzamidine-free) experiments. The bars, together with corresponding standard errors, represent measurements obtained from the control endocytic vacuoles (Left, n = 29) and endocytic vacuoles formed in the presence of benzamidine (Right, n = 61).
Endosomal pH and Trypsin Activity.
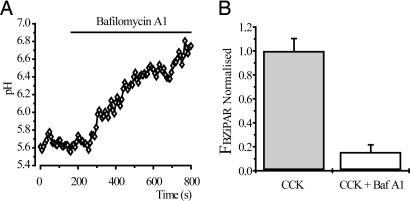
We measured pH in the CCK-induced endocytic vacuoles by using the calibrated ratio of fluorescein and tetramethylrhodamine dextrans. The intravacuole pH, measured by the endocytosed probes, was 5.9 ± 0.1 (n = 19). Application of the vacuolar ATPase inhibitor bafilomycin A1 (100 nM) resulted in alkalization of endocytic vacuoles (Fig. 5A). Treatment of acinar cells with bafilomycin A1 (added 30 min before supramaximal CCK stimulation) substantially reduced the BZiPAR fluorescence of vacuoles (P < 0.05), indicating that vacuole alkalization prevents trypsinogen activation within endocytic vacuoles (Fig. 5B).
Fig. 5.
Trypsin activity in endocytic vacuoles is inhibited by bafilomycin A1. (A) Bafilomycin A1 (100 nM) induced alkalization of a single endocytic vacuole. Endocytic vacuoles were formed (due to stimulation with 10 nM CCK for 60 min) in the presence of FTMRD (100 μM). (B) Graph showing values of normalized BZiPAR fluorescence in CCK-induced endocytic vacuoles. In these experiments, cells were incubated with CCK for 2 h and 30 min at 35°C in the presence or absence of bafilomycin A1. The values of BZiPAR fluorescence were recorded over the regions of interest, determined by fluorescence of endocytosed TRD, and normalized by the mean value for control (bafilomycin A1-free) experiments. The bars, together with corresponding standard errors, represent measurements obtained from control endocytic vacuoles (Left, n = 84) and endocytic vacuoles formed in the presence of bafilomycin A1 (Right, n = 91).
Endosomal [Ca2+].
We measured the [Ca2+] in the CCK-induced endocytic vacuoles by using the calcium indicator Oregon Green 488 BAPTA-5N (OGB5N). TRD was used in our experiments to provide the calcium-independent fluorescence reference for these ratiometric measurements.
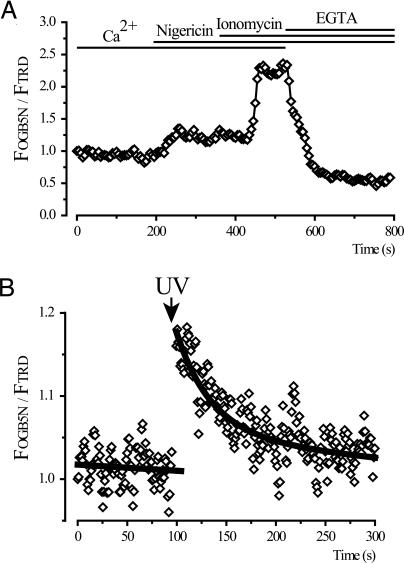
Using calibration with the calcium ionophore ionomycin (Fig. 6), we estimated the [Ca2+] in endocytic vacuoles to be 37 μM ± 11 (n = 7). We also used nigericin (K+/H+ ionophore) for this calibration.
Fig. 6.
[Ca2+] in endocytic vacuoles. (A) Vacuoles were formed in response to stimulation with CCK (10 nM) for 60 min in the presence of the endocytic tracers TRD and OGB5N. A single vacuole, present throughout the time series in the confocal section and stable within the region of interest, was selected for analyses. The [Ca2+] calibration of the OGB5N:TRD fluorescence ratio (normalized to the ratio at the beginning of the experiment) was performed by using 5 μM nigericin and 20 μM ionomycin in a buffer with 2 mM CaCl2 and then in a buffer with 10 mM EGTA. The timing of the additions of ionophores and the change from Ca2+-containing to EGTA-containing solution are shown by the bars at the top. The intravacuolar [Ca2+] in this experiment was 31.4 μM. (B) Calcium uncaging and recovery of [Ca2+] in a single endocytic vacuole. Endocytic vacuoles were formed to stimulation with CCK (10 nM) for 60 min in the presence of 2 mM of caged calcium NP-EGTA and 3.1 mM of CaCl2 in extracellular solution, which also contained TRD and OGB5N. Uncaging of caged calcium by a pulse of UV light (shown by arrow) resulted in intravacuolar [Ca2+] increase followed by slow recovery to prestimulated value.
We were able to observe Ca2+ release from endosomes after photolysis of caged Ca2+. CCK-induced endocytic vacuoles were formed in the presence of caged calcium [o-nitrophenyl EGTA (NP-EGTA), 2 mM in extracellular solution]. In these experiments, we also increased the extracellular [CaCl2] to 3.1 mM to ensure that at the moment of internalization NP-EGTA was saturated with calcium. Brief application of UV light (351- or 364-nm laser lines) produced an elevation in OGB5N fluorescence followed by recovery to the prestimulated level within ≈100 s (Fig. 6). This technical approach demonstrates a rapid release/leak of Ca2+ from endocytic vacuoles.
Discussion
Here, we have demonstrated the formation of large endocytic vacuoles in pancreatic acinar cells and resolved activation of trypsinogen in these vacuoles. In contrast to the findings reported by Thorn and colleagues (36), we resolved formation of large endocytic vacuoles produced by disconnection of large Ω-shaped postexocytic structures. The apparent discrepancy is most probably attributable to the difference in the levels of stimulation. The process of endocytosis that we observed is unusual because it involves the formation of an extended thin channel between the lumen and postexocytic structure (Fig. 1B) and does not seem to require clathrin.
We observed long-distance translocation of endocytic vacuoles from the apical region to the lateral and basal regions of the cytosol (Fig. 1A). Occasionally a close juxtaposition between endocytic vacuoles and basal membrane has been observed; however, we have not seen fusion of the vacuoles with the basal plasma membrane. Our observations concur with an electron microscopy study from Meldolesi's laboratory (29).
We have resolved fusion between different endocytic vacuoles (Fig. 1C) and observed the formation of small protrusions on the surface of large endocytic vacuoles. These protrusions could be attributed to either fusion with unstained small organelles (e.g., lysosomes, phagosomes, macropinosomes, and condensing vacuoles) or pinching of small parts of membrane by secondary endocytosis, which could be conducted by small disassembling endosomes (36). A functional test with GPN indicated that endocytic vacuoles are not affected by this compound, whereas lysosomes are destroyed. This finding suggests that endocytic vacuoles do not acquire lysosomal enzymes in the process of their formation and translocation.
In our experience, cleavage of trypsin substrate occurs preferentially in endocytic vacuoles. However, we cannot exclude activation of trypsinogen in sites inaccessible to BZiPAR. The possibility of cross-talk between indicators or unspecific fluorescence staining was minimized by the following observations. First, the fluorescence of cleaved BZiPAR developed in endosomes with some delay after RITCD or TRD fluorescence. Second, the emission spectra taken from individual endosomes contained a component corresponding to cleaved BZiPAR. The fact that the fluorescence of cleaved BZiPAR reflects trypsin activity in endosomes was verified by using the trypsin inhibitor benzamidine.
Kruger and colleagues (39) reported trypsinogen activation in large “membrane-confined vesicles” in the apical part of the cell. Our work is in general agreement with that study and now allows us to specify that these membrane-confined vesicles are endocytic vacuoles.
Both activation of trypsinogen by cathepsin B and autoactivation of cationic trypsinogen are favored by acidic pH (23–25). Vacuolar ATPase inhibitors were shown to suppress trypsinogen activation (22). We found the large endocytic vacuoles to be mildly acidic. Although the pH of the endosomes is not optimal (25, 40), it is compatible with the activation of trypsinogen.
At the exact point in time when the endosomes become disconnected from the luminal plasma membrane, the [Ca2+] is expected to be equal to the extracellular [Ca2+] (1 mM in our experiments), but we found a much lower [Ca2+], ≈40 μM, in mature endocytic vacuoles. Endocytic vacuoles, therefore, rapidly lose calcium. Using uncaging of endocytosed NP-EGTA, we were able to increase [Ca2+] in individual vacuoles and successfully image calcium leak from mature endosomes. In pancreatic acinar cells, low [Ca2+] in endosomes could be considered as protective against autoactivation of trypsinogen. Although the [Ca2+] in endosomes is substantially lower than optimal for trypsinogen activation, it still is compatible with autoactivation of this enzyme (19). Interestingly, a low [Ca2+] also was found in early endosomes of Swiss 3T3 fibroblasts (41). It seems that a low [Ca2+] is a general property of endosomes (see also ref. 42 for Ca2+ handling in endosomes and other cellular organelles).
Formation of large vacuoles is an important cellular hallmark of early pancreatitis. Previously suggested models of vacuole formation and intravacuolar activation of trypsinogen include: fusion of secretory vesicles with lysosomes (9, 29, 32), transformation of condensing vacuoles (29), and delivery of incompletely released trypsinogen by endocytosis into preformed autophagic vacuoles (26). Our study suggests an additional mechanism: formation of vacuoles as a result of aberrant endocytosis of large postexocytic structures, followed by intracellular translocation, and finally activation of retained trypsinogen. In an electron microscopy study accessing the consequences of pancreatic and bile duct obstruction, Lerch et al. (26) have shown that endocytosed dextran could be transported into large vacuoles. This finding is consistent with our study, which further specifies that the vacuoles are formed by disconnection of large postexocytic structures. It is possible that the volume of expanded postexocytic Ω shapes, formed by vigorous compound exocytosis, is too large for its content to be released by diffusion before the structures are endocytosed. Alternatively, premature endocytosis and withdrawal could occur as the “last in queue” zymogen granule(s) are undergoing fusion with compound exocytic structures. In both cases, zymogen will be retained in endosomes and can be either autoactivated or activated by cathepsin B-induced cleavage. The fact that a cathepsin B inhibitor suppresses the main component of fluorescence suggests that the activation by cathepsin B is probably an important, but not exclusive, mechanism of endosomal trypsinogen activation.
Methods
Cell Preparation and Extracellular Solutions.
Mouse pancreatic acinar cells were isolated by collagenase digestion as described in ref. 43. Pancreata were obtained from adult male mice (CD1) that had been killed by cervical dislocation, in accordance with the Animals (Scientific Procedures) Act of 1986. The solution for cell isolation contained 140 mM NaCl, 4.7 mM KCl, 10 mM Hepes-KOH, 1 mM MgCl2, and 1 mM CaCl2 (pH 7.2). After isolation, cells were transferred to an extracellular solution containing 140 mM NaCl, 4.7 mM KCl, 10 mM Hepes-KOH, 1 mM MgCl2, 1 mM CaCl2 (pH 7.2), l-glutamine, minimal essential amino acids, and 2 mg/ml BSA. Collagenase was purchased from Worthington (Lakewood, NJ), and the rest of the chemicals were from Sigma–Aldrich (Gillingham, U.K.).
Confocal Imaging of Endocytic Vacuoles and Trypsinogen Activation.
Isolated clusters of acinar cells were incubated in extracellular solution containing a cell-impermeant fluorescent tracer: RITCD, 10,000 MW neutral TRD, or 3,000 MW rhodamine green dextran (RGD). All experiments were conducted in a closed chamber at 35°C.
Fluorescent images were obtained by using either a Leica TCS SL confocal laser scanning microscope or a Leica TCS SP2 confocal and multiphoton laser scanning microscope (Leica Microsystems, Wetzlar, Germany). For simultaneous visualization of trypsin activity and vacuole formation, acini were incubated in extracellular solution containing 100 μM BZiPAR and either 100 μM TRD or RITCD. RITCD and BZiPAR were excited with a 488-nm laser line; emission was collected in the 508- to 530-nm band for cleaved BZiPAR and 570- to 700-nm band for RITCD. TRD was excited with 543 nm, and emission was collected in the 570- to 700-nm band. For emission scan of vacuole fluorescence, we used an excitation laser line of 488 nm; fluorescence emission was scanned with a 10-nm band pass. In two-photon imaging experiments, RGD was excited with 880 nm, and the emission was collected in the 500- to 600-nm band.
For measurements of BZiPAR fluorescence (in the presence or absence of inhibitors), we selected regions of interest by using excitation/emission wavelengths for endocytosed TRD. We then activated excitation/emission recording protocol for cleaved BZiPAR and measured the fluorescence in preselected regions of interest.
In the relevant experiments, cells were pretreated for 30 min at room temperature with 1 mM benzamidine, 100 nM bafilomycin A1, or 100 μM CA074me and then continuously incubated with inhibitor and CCK on the microscope stage at 35°C. Fluorescent images or small image stacks (three to seven images) were collected with a frequency of 0.25–4 frames per min.
Statistical analysis was performed by using Student's t test and Microsoft Excel software. P values of <0.05 were considered to indicate statistical significance.
Electron Microscopy.
Cells were stimulated with CCK (10 nM) for 30 min at 35°C, fixed with 4% paraformaldehyde and 2% glutaraldehyde, osmicated, and processed for Epon embedding. Then, 70-nm sections were cut and stained with lead citrate before viewing in a Tecnai Spirit transmission electron microscope.
Immunofluorescence Microscopy.
For dual imaging of vacuoles and immunofluorescence labeling of EEA1 and LAMP1, clusters of isolated acinar cells were incubated (35°C), respectively, in the presence of 100 μM Alexa Fluor 488 dextran fixable and TRD/anionic/lysine fixable. For localization of EEA1, we used anti-rabbit polyclonal EEA1 antibody, and for LAMP1 localization, we used anti-LAMP1 (clone LY1C6); both were purchased from Cambridge BioScience (Cambridge, U.K.).
Measurements of pH and Calcium in Endocytic Vacuoles.
For pH measurements, cells were stimulated with 10 nM CCK at 35°C for 60 min in the presence of the cell-impermeant ratiometric fluorescent pH probe dextran, fluorescein, and tetramethylrhodamine (10,000 MW, anionic) (FTMRD). We used 488 nm for excitation of fluorescein and 543 nm for excitation of tetramethylrhodamine. Emission was collected in 508- to 550-nm and 600- to 700-nm bands for fluorescein and tetramethylrhodamine, respectively. For pH calibrations, cells then were incubated in a solution containing 10 mM NaCl, 120 mM KCl, 1 mM MgCl2, 1 mM CaCl2, 10 mM d-glucose, 10 mM Hepes, and 10 mM Mes (adjusted to pH 7.2 or 5.0 by KOH), supplemented with the ionophores nigericin (10 μM), valinomycin (10 μM), carbonyl cyanide m-chlorophenylhydrazone (CCCP; 5 μM), monensin (10 μM), and the vacuolar ATPase inhibitor bafilomycin A1 (100 nM) with pH adjusted to 7.2 or 5.0.
For Ca2+ measurements, cells were stimulated in the presence of the Ca2+-sensitive probe OGB5N and the Ca2+-insensitive fluorescent dextran TRD in extracellular solution. The [Ca2+] calibration procedure was performed by applying calcium ionophore ionomycin (10 μM) and nigericin (7 μM to neutralize organellar pH) with 2 mM CaCl2 or 10 mM EGTA.
The Kd of OGB5N for Ca2+ under our experimental conditions (35°C) was determined by titration of the indicator-containing extracellular solution with Ca2+ (from 2 μM to 30 mM) at a range of pH (pH 7.2 to 5.3). The Kd at pH 7.2 was measured to be 36.5 μM. There was only a moderate increase in Kd for acidification from pH 7.2 to pH 5.9 (Kd increased to 55.3 μM); however, further acidification to pH 5.3 resulted in a substantial increase of Kd to 116 μM.
Ca2+ measurements in endocytic vacuoles were conducted in the presence of nigericin; therefore, for the purpose of calculating [Ca2+] in endosomes, the Kd of OGB5N for Ca2+ was assumed to be 36.5 μM.
For calcium uncaging in endocytic vacuoles, we incubated cells in CCK (10 nM) and OGB5N/TRD containing solution supplemented with 2 mM NP-EGTA (with tetrapotassium salt), and [CaCl2] in this solution was increased to 3.1 mM. UV laser lines (351/364 nm) were used for uncaging of NP-EGTA.
Dual Confocal Imaging of Lysosomes and Vacuoles.
Vacuoles were formed to supramaximal CCK stimulation (60 min at 35°C) in the presence of extracellular RGD. Next, lysosomes were loaded with 0.1 μM Lyso-Tracker red on the microscope stage at room temperature. Lyso-Tracker red was excited with 543 nm, and emission was collected in the 584- to 654-nm band. RGD was excited with 476 nm, and emission was collected in the 496- to 523-nm band.
Chemicals.
Lyso-Tracker red, NP-EGTA, OGB5N, valinomycin, FTMRD, BZiPAR, TRD, and RGD were purchased from Molecular Probes/Invitrogen (Eugene, OR). Ionomycin, monensin, carbonyl cyanide m-chlorophenylhydrazone, CA074me, benzamidine, RITCD, and CCK were from Sigma–Aldrich (Gillingham, U.K.). Nigericin was from Calbiochem-Novabiochem (Nottingham, U.K.). Bafilomycin A1 was from Upstate (Lake Placid, NY).
Supplementary Material
Acknowledgments
We thank Mark Houghton for technical assistance. This work was supported by a Medical Research Council program grant (to A.V.T., O.V.G., and O.H.P.) and by the Wellcome Trust Prize Ph.D. studentship (to M.W.S.). Electron microscopy was conducted in the Liverpool Biomedical Electron Microscopy Unit with technical support from Miss Cornelia Muncke. Immunofluorescence was conducted under the guidance of Dr. Lee Haynes in the laboratory of Prof. Robert Burgoyne at University of Liverpool.
Abbreviations
- CCK
cholecystokinin-8
- BZiPAR
rhodamine 110 bis-(CBZ-l-isoleucyl-l-prolyl-l-arginine amide) dihydrochloride
- TRD
Texas red dextran
- EEA1
early endosome antigen 1
- LAMP1
lysosomal-associated membrane protein 1
- GPN
glycyl-phenylalanine-2-naphthylamide
- RITCD
rhodamine B isothiocyanate-dextran
- OGB5N
Oregon Green 488 BAPTA-5N
- NP-EGTA
o-nitrophenyl EGTA
- RGD
rhodamine green dextran
- FTMRD
dextran, fluorescein, and tetramethylrhodamine.
Footnotes
The authors declare no conflict of interest.
This article contains supporting information online at www.pnas.org/cgi/content/full/0700951104/DC1.
References
- 1.Gukovskaya AS, Hosseini S, Satoh A, Cheng JH, Nam KJ, Gukovsky I, Pandol SJ. Am J Physiol. 2004;286:G204–G213. doi: 10.1152/ajpgi.00088.2003. [DOI] [PubMed] [Google Scholar]
- 2.Pandol SJ. Curr Opin Gastroenterol. 2005;21:538–543. doi: 10.1097/01.mog.0000174221.92708.50. [DOI] [PubMed] [Google Scholar]
- 3.Satoh A, Gukovskaya AS, Reeve JR, Jr, Shimosegawa T, Pandol SJ. Am J Physiol. 2006;291:G432–G438. doi: 10.1152/ajpgi.00579.2005. [DOI] [PubMed] [Google Scholar]
- 4.Schenker S, Montalvo R. Recent Dev Alcohol. 1998;14:41–65. doi: 10.1007/0-306-47148-5_3. [DOI] [PubMed] [Google Scholar]
- 5.Acosta JM, Ledesma CL. N Engl J Med. 1974;290:484–487. doi: 10.1056/NEJM197402282900904. [DOI] [PubMed] [Google Scholar]
- 6.Lerch MM, Hernandez CA, Adler G. Dig Dis. 1994;12:242–247. doi: 10.1159/000171458. [DOI] [PubMed] [Google Scholar]
- 7.Bhatia M, Wong FL, Cao Y, Lau HY, Huang J, Puneet P, Chevali L. Pancreatology. 2005;5:132–144. doi: 10.1159/000085265. [DOI] [PubMed] [Google Scholar]
- 8.Grady T, Mah'Moud M, Otani T, Rhee S, Lerch MM, Gorelick FS. Am J Physiol. 1998;275:G1010–G1017. doi: 10.1152/ajpgi.1998.275.5.G1010. [DOI] [PubMed] [Google Scholar]
- 9.Hofbauer B, Saluja AK, Lerch MM, Bhagat L, Bhatia M, Lee HS, Frossard JL, Adler G, Steer ML. Am J Physiol. 1998;275:G352–G362. doi: 10.1152/ajpgi.1998.275.2.G352. [DOI] [PubMed] [Google Scholar]
- 10.Kruger B, Albrecht E, Lerch MM. Am J Pathol. 2000;157:43–50. doi: 10.1016/S0002-9440(10)64515-4. [DOI] [PMC free article] [PubMed] [Google Scholar]
- 11.Lerch MM, Gorelick FS. Med Clin North Am. 2000;84:549–563. viii. doi: 10.1016/s0025-7125(05)70239-x. [DOI] [PubMed] [Google Scholar]
- 12.Raraty M, Ward J, Erdemli G, Vaillant C, Neoptolemos JP, Sutton R, Petersen OH. Proc Natl Acad Sci USA. 2000;97:13126–13131. doi: 10.1073/pnas.97.24.13126. [DOI] [PMC free article] [PubMed] [Google Scholar]
- 13.Saluja AK, Bhagat L, Lee HS, Bhatia M, Frossard JL, Steer ML. Am J Physiol. 1999;276:G835–G842. doi: 10.1152/ajpgi.1999.276.4.G835. [DOI] [PubMed] [Google Scholar]
- 14.Schneider A. Clin Lab Med. 2005;25:61–78. doi: 10.1016/j.cll.2004.12.005. [DOI] [PubMed] [Google Scholar]
- 15.van Acker GJ, Perides G, Steer ML. World J Gastroenterol. 2006;12:1985–1990. doi: 10.3748/wjg.v12.i13.1985. [DOI] [PMC free article] [PubMed] [Google Scholar]
- 16.Otani T, Chepilko SM, Grendell JH, Gorelick FS. Am J Physiol. 1998;275:G999–G1009. doi: 10.1152/ajpgi.1998.275.5.G999. [DOI] [PubMed] [Google Scholar]
- 17.Halangk W, Kruger B, Ruthenburger M, Sturzebecher J, Albrecht E, Lippert H, Lerch MM. Am J Physiol. 2002;282:G367–G374. doi: 10.1152/ajpgi.00315.2001. [DOI] [PubMed] [Google Scholar]
- 18.Thrower EC, az de Villalvilla AP, Kolodecik TR, Gorelick FS. Am J Physiol. 2006;290:G894–G902. doi: 10.1152/ajpgi.00373.2005. [DOI] [PMC free article] [PubMed] [Google Scholar]
- 19.Kukor Z, Toth M, Sahin-Toth M. Eur J Biochem. 2003;270:2047–2058. doi: 10.1046/j.1432-1033.2003.03581.x. [DOI] [PubMed] [Google Scholar]
- 20.Guillaumes S, Blanco I, Villanueva A, Sans MD, Clave P, Chabas A, Farre A, Lluis F. Pancreas. 1997;14:262–266. doi: 10.1097/00006676-199704000-00007. [DOI] [PubMed] [Google Scholar]
- 21.Leach SD, Bilchik AJ, Karapetian O, Gorelick FS, Modlin IM. Pancreas. 1993;8:64–69. doi: 10.1097/00006676-199301000-00013. [DOI] [PubMed] [Google Scholar]
- 22.Waterford SD, Kolodecik TR, Thrower EC, Gorelick FS. J Biol Chem. 2005;280:5430–5434. doi: 10.1074/jbc.M413513200. [DOI] [PMC free article] [PubMed] [Google Scholar]
- 23.Figarella C, Miszczuk-Jamska B, Barrett AJ. Biol Chem Hoppe Seyler. 1988;369(Suppl):293–298. [PubMed] [Google Scholar]
- 24.Greenbaum LM, Hirshkowitz A, Shoichet I. J Biol Chem. 1959;234:2885–2890. [PubMed] [Google Scholar]
- 25.Kukor Z, Mayerle J, Kruger B, Toth M, Steed PM, Halangk W, Lerch MM, Sahin-Toth M. J Biol Chem. 2002;277:21389–21396. doi: 10.1074/jbc.M200878200. [DOI] [PubMed] [Google Scholar]
- 26.Lerch MM, Saluja AK, Runzi M, Dawra R, Steer ML. J Clin Invest. 1995;95:2222–2231. doi: 10.1172/JCI117912. [DOI] [PMC free article] [PubMed] [Google Scholar]
- 27.Szilagyi L, Kenesi E, Katona G, Kaslik G, Juhasz G, Graf L. J Biol Chem. 2001;276:24574–24580. doi: 10.1074/jbc.M011374200. [DOI] [PubMed] [Google Scholar]
- 28.van Acker GJ, Saluja AK, Bhagat L, Singh VP, Song AM, Steer ML. Am J Physiol Gastrointest Liver Physiol. 2002;283:G794–G800. doi: 10.1152/ajpgi.00363.2001. [DOI] [PubMed] [Google Scholar]
- 29.Watanabe O, Baccino FM, Steer ML, Meldolesi J. Am J Physiol. 1984;246:G457–G467. doi: 10.1152/ajpgi.1984.246.4.G457. [DOI] [PubMed] [Google Scholar]
- 30.Halangk W, Lerch MM, Brandt-Nedelev B, Roth W, Ruthenbuerger M, Reinheckel T, Domschke W, Lippert H, Peters C, Deussing J. J Clin Invest. 2000;106:773–781. doi: 10.1172/JCI9411. [DOI] [PMC free article] [PubMed] [Google Scholar]
- 31.Kim JY, Kim KH, Lee JA, Namkung W, Sun AQ, Ananthanarayanan M, Suchy FJ, Shin DM, Muallem S, Lee MG. Gastroenterology. 2002;122:1941–1953. doi: 10.1053/gast.2002.33617. [DOI] [PubMed] [Google Scholar]
- 32.Saito I, Hashimoto S, Saluja A, Steer ML, Meldolesi J. Am J Physiol. 1987;253:G517–G526. doi: 10.1152/ajpgi.1987.253.4.G517. [DOI] [PubMed] [Google Scholar]
- 33.Niederau C, Grendell JH. J Clin Invest. 1988;81:229–236. doi: 10.1172/JCI113300. [DOI] [PMC free article] [PubMed] [Google Scholar]
- 34.Nemoto T, Kimura R, Ito K, Tachikawa A, Miyashita Y, Iino M, Kasai H. Nat Cell Biol. 2001;3:253–258. doi: 10.1038/35060042. [DOI] [PubMed] [Google Scholar]
- 35.Nemoto T, Kojima T, Oshima A, Bito H, Kasai H. J Biol Chem. 2004;279:37544–37550. doi: 10.1074/jbc.M403976200. [DOI] [PubMed] [Google Scholar]
- 36.Thorn P, Fogarty KE, Parker I. Proc Natl Acad Sci USA. 2004;101:6774–6779. doi: 10.1073/pnas.0400336101. [DOI] [PMC free article] [PubMed] [Google Scholar]
- 37.Alberts B, Bray D, Johnson A, Lewis J, Raff M, Roberts K, Walter P. Molecular Biology of the Cell. 4th Ed. New York: Garland Publishing; 2002. [Google Scholar]
- 38.Berg TO, Stromhaug E, Lovdal T, Seglen O, Berg T. Biochem J. 1994;300:229–236. doi: 10.1042/bj3000229. [DOI] [PMC free article] [PubMed] [Google Scholar]
- 39.Kruger B, Lerch MM, Tessenow W. Lab Invest. 1998;78:763–764. [PubMed] [Google Scholar]
- 40.Nemoda Z, Sahin-Toth M. J Biol Chem. 2005;280:29645–29652. doi: 10.1074/jbc.M505661200. [DOI] [PMC free article] [PubMed] [Google Scholar]
- 41.Gerasimenko JV, Tepikin AV, Petersen OH, Gerasimenko OV. Curr Biol. 1998;8:1335–1338. doi: 10.1016/s0960-9822(07)00565-9. [DOI] [PubMed] [Google Scholar]
- 42.Rizzuto R, Pozzan T. Physiol Rev. 2006;86:369–408. doi: 10.1152/physrev.00004.2005. [DOI] [PubMed] [Google Scholar]
- 43.Voronina SG, Barrow SL, Gerasimenko OV, Petersen OH, Tepikin AV. J Biol Chem. 2004;279:27327–27338. doi: 10.1074/jbc.M311698200. [DOI] [PubMed] [Google Scholar]
Associated Data
This section collects any data citations, data availability statements, or supplementary materials included in this article.


