Abstract
Cells known as melanophores contain melanosomes, which are membrane organelles filled with melanin, a dark, nonfluorescent pigment. Melanophores aggregate or disperse their melanosomes when the host needs to change its color in response to the environment (e.g., camouflage or social interactions). Melanosome transport in cultured Xenopus melanophores is mediated by myosin V, heterotrimeric kinesin-2, and cytoplasmic dynein. Here, we describe a technique for tracking individual motors of each type, both individually and in their interaction, with high spatial (≈2 nm) and temporal (≈1 msec) localization accuracy. This method enabled us to observe (i) stepwise movement of kinesin-2 with an average step size of 8 nm; (ii) smoother melanosome transport (with fewer pauses), in the absence of intermediate filaments (IFs); and (iii) motors of actin filaments and microtubules working on the same cargo nearly simultaneously, indicating that a diffusive step is not needed between the two systems of transport. In concert with our previous report, our results also show that dynein-driven retrograde movement occurs in 8-nm steps. Furthermore, previous studies have shown that melanosomes carried by myosin V move 35 nm in a stepwise fashion in which the step rise-times can be as long as 80 msec. We observed 35-nm myosin V steps in melanophores containing no IFs. We find that myosin V steps occur faster in the absence of IFs, indicating that the IF network physically hinders organelle transport.
Keywords: bright-field imaging with one-nanometer accuracy (bFIONA), dynein, kinesin-2, myosin V, intermediate filaments
Melanin-carrying melanosomes can be seen under bright-field illumination because the dark color of the melanosome creates a strong contrast between the organelle and the background. By exploiting this property, biologists have used melanosomes as markers for in vivo organelle transport studies (1). Several groups (2–4) have shown that myosin V, cytoplasmic dynein, and kinesin-2 are the molecular motors in charge of melanosome transport in Xenopus melanophores. Among these molecular motors, heterotrimeric kinesin-2, which contains two different polypeptide chains with motor domains, Xklp3A and Xklp3B, has been shown to be responsible for the dispersion of melanosomes (3). Unlike conventional kinesin subunits, kinesin-2 subunits cannot homodimerize due to repulsion between their charged residues in the stalk regions (5). [The reason that heterodimerization is favored over homodimerization is still unknown, although De Marco et al. (6, 7) have shown that C-terminal coiled coils are crucial for the heterodimerization of the subunits.] In addition, there has been no investigation of the stepping mechanism for heterotrimeric kinesin: for example, the step size, effect of intermediate filaments (IFs), or interaction with other motors during a “hand-off” along microtubules or between microtubules and actin.
Fluorescent particles have been used to study molecular motor-induced movement where sufficient contrast has enabled 1.5-nm resolution in 300–500 msec in vitro (8, 9) and 0.30–1 msec in vivo (10, 11). However, as with any other fluorescence technique, these tracking experiments are limited by the photobleaching of fluorophores. Here, we describe a simple yet powerful technique for studying processive molecular motors in vivo. Rather than tracking organelles labeled with fluorescent proteins, we visualized granules containing absorbent pigment molecules via bright-field microscopy. This technique is similar to some previous melanosome assays (12, 13), although we used faster imaging, which is necessary for tracing individual kinesin and dynein steps and for observing the interaction between the microtubule motors and the actin motors. Our method is also related to the use of video-enhanced differential interference contrast microscopy to track kinesin-coated plastic beads with high spatial resolution (14). However, with our technique, tracking is done inside a live cell and is ≈30 times faster than video imaging.
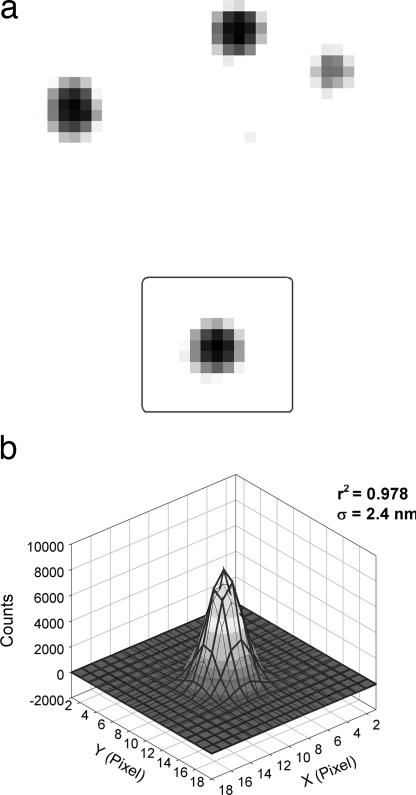
In particular, we have shown that single melanosomes visualized by bright-field microscopy can be localized within ≈2 nm in 1.1-msec time resolution. This is achieved by fitting a 2D Gaussian fit to the negative (or inverse) melanosome transmission image, similar to the method used in our previous studies of fluorescent objects (Fig. 1) (8, 9, 11, 15). We have named this localization technique “bright-field imaging with one-nanometer accuracy (bFIONA),” which is an extension of our fluorescence imaging with one-nanometer accuracy (FIONA).
Fig. 1.
bFIONA images of melanosomes. (a) Bright-field image of frog melanosomes containing the black pigment melanin. (b) The 2D Gaussian fit to the negative melanosome image in the square in A. The position of the peak can be determined to an accuracy of 2.4 nm in 1.1 msec.
bFIONA has some important advantages over previously reported fluorescence-based, high-resolution organelle tracking techniques. In bFIONA, (i) imaging does not require advanced optics, such as expensive lasers; (ii) photobleaching is nonexistent and hence does not limit obtaining high-resolution images; and (iii) the production of toxic reactive species, such as oxygen radicals, by photobleaching is also nonexistent. These advantages enable us to track individual organelles, in a live cell, for as long as desired.
The use of bFIONA on Xenopus melanophores enabled us to study the molecular motors (dynein, kinesin-2, and myosin V) in melanosomes in a step-by-step manner. Our experiments were performed at room temperature, which is the normal physiological condition for Xenopus. We report 8.4-nm steps for dynein, 8.0-nm steps for kinesin-2, and 35.1-nm steps for myosin V, all in vivo. The 8-nm steps on the heterotrimeric kinesin-2 show that this motor moves in the usual 8-nm fashion, likely by means of a hand-over-hand mechanism (9), despite the differing heads. There also appears to be variability of load within the cell, which we detect by the variable stepping rates of myosin V. Moreover, we tracked melanosomes in regions of cells lacking IFs and actin filaments. Our results suggest that the microtubule-based organelle transport occurs with fewer pauses in the absence of an extended IF network. Finally, we also report on the “passing” of melanosomes between actin- and microtubule-based motors, which is an essential process for dispersion and aggregation. These findings show that a diffusive step is not needed between the two systems, suggesting that there is direct competition between the two or that there is some type of coordination that switches transport from microtubules to actin (and vice versa) instantaneously. With bFIONA, we have demonstrated in vivo interaction between the two transport systems that play a key role in overall organelle transport.
Results and Discussion
Heterotrimeric Kinesin-2 Takes 8-nm Steps.
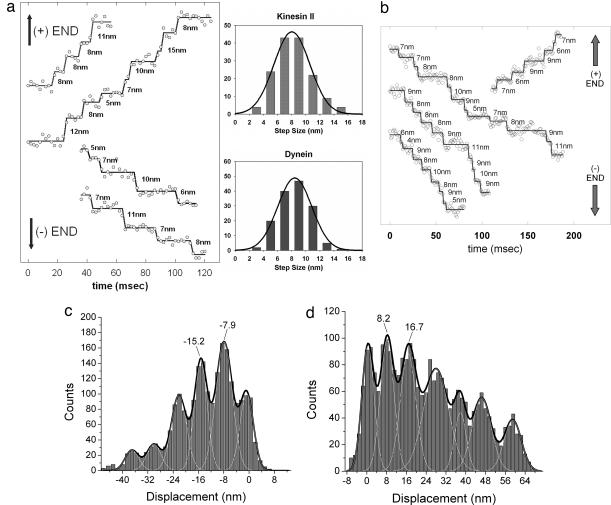
The negative of the bright-field image of a melanosome in a live melanophore can be well fit to a 2D Gaussian function, and the centroid of the function can be determined with ≈2-nm accuracy and 1-msec time resolution (Fig. 1). As a control, we fixed a melanophore and moved the stage in 8-nm increments with 1.1-msec resolution by means of a piezo stepper motor. Using bFIONA analysis, we could easily resolve the steps. The measured average step size is 8.5 nm (SD: 1.7 nm) [see supporting information (SI) Fig. 7]. To study melanosomes carried only by microtubule-dependent molecular motors, we depolymerized actin filaments by treating live cells with latrunculin B. bFIONA analysis enabled us to see stepwise displacement of melanosomes in both retrograde and anterograde movements (Fig. 2a). Previous studies have revealed that the aggregation of melanosomes (motion toward the cell center) is dependent on dynein (4), whereas dispersion (motion toward the periphery) is mediated by heterotrimeric kinesin-2 (3). Note that the shapes of melanosomes are very stable due to a solid core of melanin pigments, hence we infer that the movement that we observe is the result of transport of melanosomes rather than of some shape-change among them. We obtained step-size averages of 8.4 nm (SD: 2.4 nm) for retrograde and 8.0 nm (SD: 2.5 nm) for anterograde motion (Fig. 2a). [In Levi et al. (12, 19), 10-msec time resolution was not sufficient to determine individual steps on microtubules.] For relatively noisier traces, we used the Student t test to determine the steps (Fig. 2b) (S. Syed, E. Toprak, P.R.S., and F. Sigworth, unpublished work; also see Materials and Methods). Our results showed that, with bFIONA, we could reproduce the previous in vivo and in vitro observations on molecular motor dynein (11, 16); however, we did not see the 16-nm and larger steps reported on optical trap (16) and in vivo endosome tracking assays (10). Our results also demonstrate that heterotrimeric kinesin-2 is a microtubule-dependent processive motor with 8-nm step size.
Fig. 2.
Step size via bFIONA of molecular motors in melanophores. (a Left) bFIONA traces of melanosomes carried by microtubule-dependent motor proteins in both retrograde and anterograde directions. (Actin filaments were depolymerized by latrunculin.) Also shown are step-size histograms of kinesin-2 (mean: 8.0 nm, SD: 2.5 nm) (Upper Right) and dynein (mean: 8.4 nm, SD: 2.4 nm) (Lower Right). (b) For noisy traces, t test analysis was used to determine the steps. (c and d) The pairwise distributions of anterograde (c) and retrograde (d) motions (taken over an adjacent averaging smoothed version of the traces). Multi-Gaussian fitting gave peaks at multiples of ≈8.
Transport Becomes Smoother in the Absence of IFs.
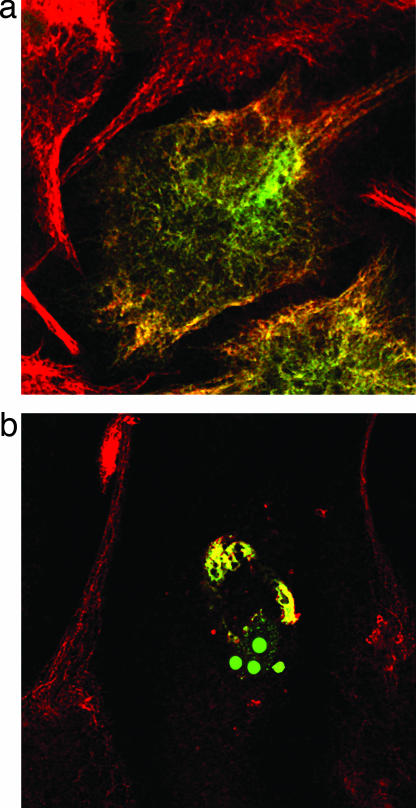
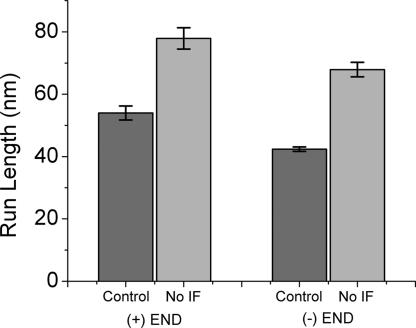
Nearly all eukaryotic cells of multicellular organisms have IFs (17). The type III IF protein, vimentin, is expressed in Xenopus melanophores. Vimentin filaments are associated with microtubules and are believed to stabilize the position of the nucleus and other organelles in a cell (17). In the present study, we tracked melanosomes carried by microtubule-dependent motors in the absence of IFs. To disassemble IF networks, we transiently transfected melanophores with a GFP-labeled dominant-negative vimentin mutant, pEGFP-vim(1–138), containing the conserved 1A domain essential for filament assembly (Fig. 3). It has been shown previously (18) that mimetic peptides derived from this 1A domain are potent disruptors of the vimentin network. Our results show that in cells expressing an excess of the dominant-negative vimentin mutant, the processitivity of melanosomes increases. For motions toward both the plus and minus ends, the uninterrupted runs become up to 50% longer (Fig. 4). These findings suggest that the IFs may physically hinder the organelles by making transport more difficult for the molecular motors in vivo.
Fig. 3.
Disruption of IFs in melanophores. Endogenous vimentin was stained with an antibody that binds to wild-type vimentin but not to truncated dominant-negative vimentin, and with Texas red-tagged secondary antibody (red channel). Dominant-negative or wild-type GFP-vimentin was visualized in the green channel. (a) GFP-vimentin copolymerizes with endogenous vimentin. (b) No vimentin filaments are found in cells expressing dominant-negative vimentin.
Fig. 4.
Averages of microtubule-dependent uninterrupted runs that occur faster than 1 μm/s. For both plus- and minus-end directed movement, run lengths increase in the absence of IFs. “Uninterrupted runs” refers to the melanosome displacements >30 nm that are not interrupted by directional changes or by pauses >10 msec. Uncertainty is shown as SEM.
Myosin V-Driven Melanosome Transport.
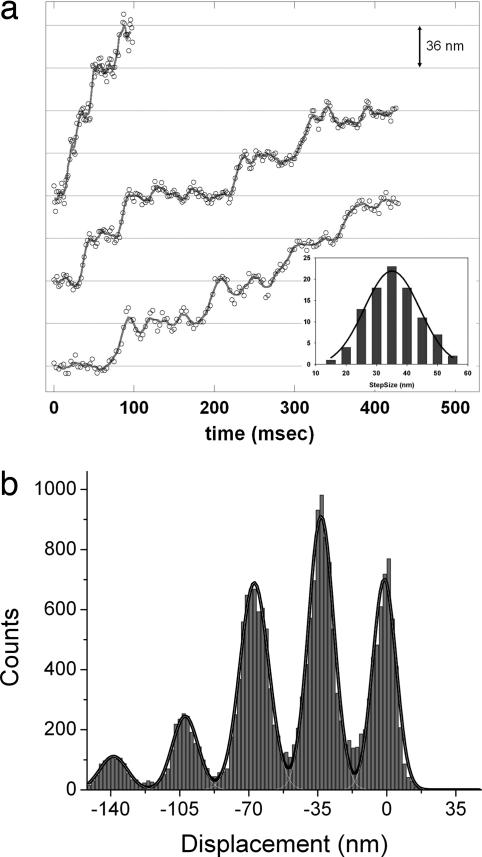
In a recent study of melanosome motility in Xenopus melanophores, Levi et al. (19) reported that myosin V steps occur much more slowly in vivo than was seen in any of the previous in vitro assays. In melanophores where microtubules were depolymerized, they found that the rise time (time elapsed between two consecutive steps) is 20–80 msec and concluded that this increase in step duration is due to the high viscosity of the cytoplasm. Here, we studied melanosome transport mediated by myosin V in the absence of microtubules [removed by nocodazole treatment, the same procedure used by Levi et al. (see SI Fig. 9)] and vimentin IF networks (disassembled by the dominant-negative vimentin mutant). We wanted to examine whether an intact IF network may overshadow the function of myosin V and thereby increase the duration of melanosome displacement due to the long steps taken by this motor.
The stepwise displacement of melanosomes measured by bFIONA tracking averaged 35.1 nm (SD: 9.4 nm), which is in excellent agreement with previous in vitro myosin V assays (20–22) (Fig. 5). We believe that the relaxation times of the stepwise dislocation of melanosomes are addressing the high viscosity of the intracellular matrix, which may create a compliance factor (between the cargo and the motor) that delays the melanosomes after the myosin V powerstroke. We measured a step duration average of 9.6 msec, which is about five times faster than that reported by Levi et al. (12). Shorter rise-times in the absence of IFs suggests that the IFs physically hinder melanosome transport by increasing viscous drag.
Fig. 5.
bFIONA traces of myosin V-driven melanosomes. (a) Traces with different rise times. Grids are 36 nm apart. (Inset) Step-size histogram of myosin V (mean: 35.1 nm, SD: 9.1 nm). The solid lines represent five-point adjacent smoothing. (b) Pairwise distribution of actin-dependent motion (taken over an adjacent averaging smoothed version of the trace). Multi-Gaussian fitting gives peaks at multiples of ≈35 nm.
Single Melanosomes Carried by Motors of Different Tracks.
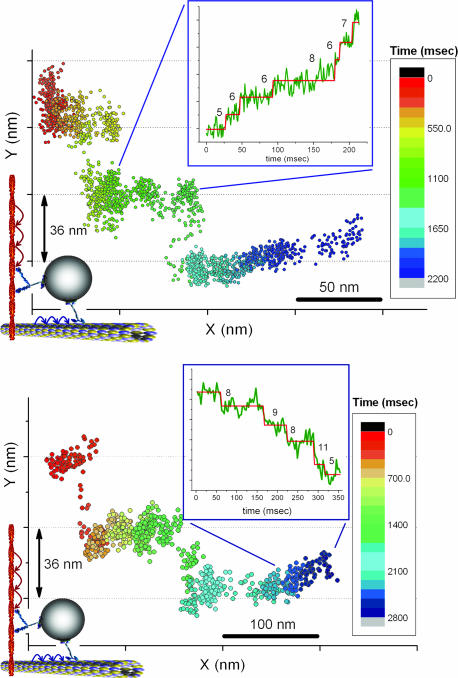
To investigate the motion of melanosomes carried by different kinds of motors, we used cells containing both microtubules and actin filaments but in which the IF networks had been disrupted. In these melanophores, we observed melanosomes moving in a stepwise manner with short (≈8 nm) and long (≈36 nm) step sizes, simultaneously. To reduce confusion between the myosin steps and the kinesin/dynein steps, we chose infrequent steps in which the short and long steps are perpendicular to each other. We also chose those steps to be within the x-y plane, which allowed us to measure the step sizes because we were not sensitive to z-axis stepping. (Of course, if the melanosome undergoes motion in the z axis, this will tend to reduce the motion in the x-y axis by the cosine of the angle.) Steps of different sizes occur on perpendicular directions simultaneously, with the actin apparently lying along the y direction and the microtubules lying along the x direction. Fig. 6 shows x-y plots of melanosomes. A trace consisting of a continuous dislocation in the x direction is disrupted by jumps of 36 nm occurring in y. A closer look at the x displacement over time shows that displacement occurs in steps of smaller size (≈8 nm). This implies that, in these rare cases, microtubules and actin filaments are aligned perpendicularly and that myosin V, together with a microtubule-dependent motor (either dynein or kinesin-2), pulls on the same cargo nearly simultaneously. Because these recordings were done at the peripheral regions of cells where microtubules are sparse compared with actin filaments, it is very likely that the large (36-nm) steps are due to myosin V and not a result of large steps from either dynein or kinesin. Therefore, hopping of melanosomes between two microtubules that are aligned in parallel is very unlikely. Our results strongly suggest (i) that melanosome transport by motors along different tracks can take place in a competing manner in which motors of different tracks are pulling the melanosomes nearly simultaneously or (ii) that there is some type of coordination that switches transport from microtubules to actin (and vice versa). These data are in agreement with our previous report (13), which shows that myosin-V interferes with melanosome movement on microtubules in Xenopus melanophores.
Fig. 6.
Two examples of transitions between actin- and microtubule-directed motions. Displacement in the x direction is disrupted by two large jumps of 36 nm in the perpendicular direction. For the pairwise distributions of the short steps shown in the Insets, the t test was used to determine the steps (see SI Fig. 8).
Materials and Methods
Cell Culture.
To generate cells with small numbers of melanosomes that are easier to track, we grew cells in the presence of tyrosinase inhibitor 1 mM phenyl-thio urea (PTU) (Sigma–Aldrich, St. Louis, MO) (12). After plating melanophores on polyL-lysine (Sigma–Aldrich)-treated glass-bottomed dishes, we cultured the cells in medium without PTU (0.7× Leibovitz L15 medium/4% FCS/0.5% glutamine/5 μg/ml insulin) to initiate the melanin synthesis and melanosome formation. After 48–72 h, most of the cells began to develop pigment-carrying melanosomes. The experiments were performed in serum-free medium. For the actin filament-free measurements, the cells were treated with 5 μg/ml latrunculin B (Sigma–Aldrich) 30 min before the measurements. For microtubule depolymerization, the cells were treated with 5 μg/ml nocodazole (Sigma–Aldrich). Cells were kept at 4°C for 20 min to enhance microtubule depolymerization. FuGENE 6 (Roche Diagnostics, Indianapolis, IN) transfection reagent was used for GFP-labeled dominant-negative vimentin transfection.
Microscopy.
Melanophores were illuminated from the top by a Fischer halogen lamp (50–150 W; Fischer Scientific, Hampton, NH). The transmission was collected via an inverted microscope (IX-70; Olympus, Melville, NY) through a ×100 objective (PLApo ×100/1.45 oil; Olympus, Melville, NY). The transmission was then imaged by an Andor iXon DV860 back-illuminated EMCCD camera (Andor Technology, South Windsor, CT) with 500–900 frames per second rates.
Data Analysis.
The transmission images of single melanosomes were inverted by subtracting each frame from the threshold value (16,428 counts). The negative-transmission image was fit to 2D Gaussian function, defined as:
 |
where z0 is a constant due to absorption of the background, A is the amplitude, x0 and y0 are the coordinates of the center, and sx and sy are SDs of the distribution in each direction.
We used the Student t test to find the best global fit to a given data set by optimizing two parameters, the “probability threshold,” p, and the “group,” g, that are not known a priori for the particular motility recording. In a standard t test, the probability threshold, or P value, is an indicator for the statistical significance of the quantity 〈x1〉 − 〈x2〉 of the two populations under consideration with mean values 〈x1〉 and 〈x2〉. In our case, the distributions are neighboring clusters of position data. The lower the threshold the greater the significance of 〈x1〉 − 〈x2〉, and typically values of P < 0.05 are suggestive of a highly probable difference in the mean values. In our algorithm, we generate a sequence of kinetic events with the data for each pair of parameters, p and g, and calculate the reduced χ2, χr2, for that sequence. Eventually, the parameters that result in minimizing χr2 are used to create the best fit to the data. (See also S. Syed, E. Toprak, P.R.S., and F. Sigworth, unpublished work.)
Supplementary Material
Acknowledgments
This work was supported by National Institutes of Health Grants GM068625 and GM072033 (to P.R.S.) and GM052111 (to V.I.G.).
Abbreviations
- bFIONA
bright-field imaging with one-nanometer accuracy
- FIONA
fluorescence imaging with one-nanometer accuracy
- IF
intermediate filament.
Footnotes
The authors declare no conflict of interest.
This article contains supporting information online at www.pnas.org/cgi/content/full/0700145104/DC1.
References
- 1.Nascimento AA, Roland JT, Gelfand VI. Annu Rev Cell Dev Biol. 2003;19:469–491. doi: 10.1146/annurev.cellbio.19.111401.092937. [DOI] [PubMed] [Google Scholar]
- 2.Rogers SL, Gelfand VI. Curr Biol. 1998;8:161–164. doi: 10.1016/s0960-9822(98)70063-6. [DOI] [PubMed] [Google Scholar]
- 3.Tuma MC, Zill A, Le Bot N, Vernos I, Gelfand V. J Cell Biol. 1998;143:1547–1558. doi: 10.1083/jcb.143.6.1547. [DOI] [PMC free article] [PubMed] [Google Scholar]
- 4.Nilsson H, Wallin M. Cell Motil Cytoskeleton. 1997;38:397–409. doi: 10.1002/(SICI)1097-0169(1997)38:4<397::AID-CM9>3.0.CO;2-0. [DOI] [PubMed] [Google Scholar]
- 5.Rashid DJ, Wedaman KP, Scholey JM. J Mol Biol. 1995;252:157–162. doi: 10.1006/jmbi.1995.0484. [DOI] [PubMed] [Google Scholar]
- 6.De Marco V, Burkhard P, Le Bot N, Vernos I, Hoenger A. EMBO J. 2001;20:3370–3379. doi: 10.1093/emboj/20.13.3370. [DOI] [PMC free article] [PubMed] [Google Scholar]
- 7.Scholey JM. J Cell Biol. 1996;133:1–4. doi: 10.1083/jcb.133.1.1. [DOI] [PMC free article] [PubMed] [Google Scholar]
- 8.Yildiz A, Forkey JN, McKinney SA, Ha T, Goldman YE, Selvin PR. Science. 2003;300:2061–2065. doi: 10.1126/science.1084398. [DOI] [PubMed] [Google Scholar]
- 9.Yildiz A, Tomishige M, Vale RD, Selvin PR. Science. 2004;303:676–678. doi: 10.1126/science.1093753. [DOI] [PubMed] [Google Scholar]
- 10.Nan X, Sims PA, Chen P, Xie XS. J Phys Chem B. 2005;109:24220–24224. doi: 10.1021/jp056360w. [DOI] [PubMed] [Google Scholar]
- 11.Kural C, Kim H, Syed S, Goshima G, Gelfand VI, Selvin PR. Science. 2005;308:1469–1472. doi: 10.1126/science.1108408. [DOI] [PubMed] [Google Scholar]
- 12.Levi V, Serpinskaya AS, Gratton E, Gelfand VI. Biophys J. 2006;90:318–327. doi: 10.1529/biophysj.105.067843. [DOI] [PMC free article] [PubMed] [Google Scholar]
- 13.Gross SP, Tuma MC, Deacon SW, Serpinskaya AS, Reilein AR, Gelfand VI. J Cell Biol. 2002;156:855–865. doi: 10.1083/jcb.200105055. [DOI] [PMC free article] [PubMed] [Google Scholar]
- 14.Gelles J, Schnapp BJ, Sheetz MP. Nature. 1988;331:450–453. doi: 10.1038/331450a0. [DOI] [PubMed] [Google Scholar]
- 15.Park H, Ramamurthy B, Travaglia M, Safer D, Chen LQ, Franzini-Armstrong C, Selvin PR, Sweeney HL. Mol Cell. 2006;21:331–336. doi: 10.1016/j.molcel.2005.12.015. [DOI] [PubMed] [Google Scholar]
- 16.Mallik R, Carter BC, Lex SA, King SJ, Gross SP. Nature. 2004;427:649–652. doi: 10.1038/nature02293. [DOI] [PubMed] [Google Scholar]
- 17.Chang L, Goldman RD. Nat Rev Mol Cell Biol. 2004;5:601–613. doi: 10.1038/nrm1438. [DOI] [PubMed] [Google Scholar]
- 18.Goldman RD, Khuon S, Chou YH, Opal P, Steinert PM. J Cell Biol. 1996;134:971–983. doi: 10.1083/jcb.134.4.971. [DOI] [PMC free article] [PubMed] [Google Scholar]
- 19.Levi V, Gelfand VI, Serpinskaya AS, Gratton E. Biophys J. 2006;90:L07. doi: 10.1529/biophysj.105.075556. [DOI] [PMC free article] [PubMed] [Google Scholar]
- 20.Mehta AD, Rock RS, Rief M, Spudich JA, Mooseker MS, Cheney RE. Nature. 1999;400:590–593. doi: 10.1038/23072. [DOI] [PubMed] [Google Scholar]
- 21.Knight AE, Veigel C, Chambers C, Molloy JE. Prog Biophys Mol Biol. 2001;77:45–72. doi: 10.1016/s0079-6107(01)00010-4. [DOI] [PubMed] [Google Scholar]
- 22.Rief M, Rock RS, Mehta AD, Mooseker MS, Cheney RE, Spudich JA. Proc Natl Acad Sci USA. 2000;97:9482–9486. doi: 10.1073/pnas.97.17.9482. [DOI] [PMC free article] [PubMed] [Google Scholar]
Associated Data
This section collects any data citations, data availability statements, or supplementary materials included in this article.


