Abstract
We report our direct study of complex protein dynamics in human thioredoxin by dissecting into elementary processes and determining their relevant time scales. By combining site-directed mutagenesis with femtosecond spectroscopy, we have distinguished four partly time-overlapped dynamical processes at the active site of thioredoxin. Using intrinsic tryptophan as a molecular probe and from mutation studies, we ascertained the negligible contribution to solvation by protein sidechains and observed that the hydration dynamics at the active site occur in 0.47–0.67 and 10.8–13.2 ps. With reduced and oxidized states, we determined the electron-transfer quenching dynamics between excited tryptophan and a nearby disulfide bond in 10–17.5 ps for three mutants. A robust dynamical process in 95–114 ps, present in both redox states and all mutants regardless of neighboring charged, polar, and hydrophobic residues around the probe, is attributed to the charge transfer reaction with its adjacent peptide bond. Site-directed mutations also revealed the electronic quenching dynamics by an aspartate residue at a hydrogen bond distance in 275–615 ps. The local rotational dynamics determined by the measurement of anisotropy changes with time unraveled a relatively rigid local configuration but implies that the protein fluctuates on the time scale of longer than nanoseconds. These results elucidate the temporal evolution of hydrating water motions, electron-transfer reactions, and local protein fluctuations at the active site, and show continuously synergistic dynamics of biological function over wide time scales.
Keywords: active site hydration, femtosecond dynamics, intraprotein electron transfer, sited-directed mutation
Protein dynamics is a complex process and evolves on a multidimensional energy landscape with various interactions and conformations over wide time scales (1–7). To understand such complex dynamics, we need to dissect the process into elementary steps and determine their relevant time scales. Many elementary reactions even occur on a similar time scale (8) and different methods are often integrated to separate each reaction channel and thus elucidate their molecular mechanisms (5, 9–13). Here, we report our direct studies of complex protein dynamics at the active site in human thioredoxin (hTrx). Using site-directed mutagenesis and femtosecond-resolved fluorescence spectroscopy, we break down the complex dynamics into four elementary processes: one solvent relaxation dynamics and three electron-transfer (ET) reactions.
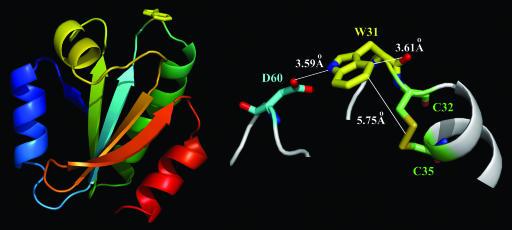
Fig. 1 shows the x-ray structure of oxidized hTrx at a 2.1-Å resolution (14). hTrx, an enzyme catalyzing dithiol–disulfide exchanges with substrate proteins, is a compact globular protein with a central core of five strands of β-pleated sheet surrounded by four α helices. The active site of hTrx consists of a highly conserved sequence W31-C-G-P-C-K36 that forms a protruding part of the structure between the second β strand and the second α helix. The enzyme contains only a single tryptophan (W31), located at the active site. The reduced hTrx involves various biological functions through a redox exchange of two cysteines (C32 and C35) with a disulfide bridge in a series of substrate proteins such as Trx peroxidase, ribonucleotide reductase, and transcription factors (15–17). Regeneration of reduced hTrx with two free sulfhydryls involves an ET mechanism from NADPH and another enzyme thioredoxin reductase (18, 19). Various structures of reduced and oxidized hTrx and their mutants and homologs of hTrx from other species have been determined by x-ray crystallography (14, 20, 21).
Fig. 1.
Protein structure with quenching species at the active site. (Left) X-ray crystallographic structure of oxidized hTrx (C73S), consisting of five strands of β-pleated sheet and four α-helices (14). Note that the single tryptophan W31 (in yellow) is located at the active site and the protruding part of the structure. (Right) The local configuration in close proximity (within 7 Å) to W31 with one charged residue (D60), a disulfide bridge (C32–C35), and a peptide bond between W31 and C32.
The active site is fully exposed to water, and all chemical reactions occurring at the active site must couple with local water motions, a hydration process often modulating chemical changes through local water rearrangements. Using intrinsic tryptophan as a local optical probe (22, 23), we have recently characterized hydration dynamics for a series of proteins in different structures, conformations and complexes with DNA and ligands, and at the surface, interface and binding pocket (24–27). Using the single tryptophan, W31, we can determine time scales of water motions at the active site. However, recent studies have reported severe quenching of tryptophan fluorescence by local environment in thioredoxin from Escherichia coli, calf thymus and yeast (28–30). Considering quenching dynamics in subnanosecond and within 7 Å of W31 in oxidized hTrx, there are three potential quenchers: Disulfide bridge (C32–C35), a peptide bond (between W31 and C32), and charged residue aspartate D60. Quenching of excited tryptophan by disulfide bridges has been observed in many enzymes, such as cutinase (31) and oxidoreductase DsbA (32). Such a quenching is believed to occur through an ET mechanism from excited tryptophan to disulfide bond (31, 32), but the time scale of this dynamical process has never been characterized. Charge separation from excited tryptophan to peptide bond has recently been invoked to interpret short lifetimes in proteins (33–35). In this article, we report how to dissect the complex dynamics in hTrx, which involve local water relaxation and various ET reactions at the active site, and determine the time scales of these processes with femtosecond resolution.
Results and Discussion
Femtosecond-Resolved Transients and Active-Site Hydration Dynamics.
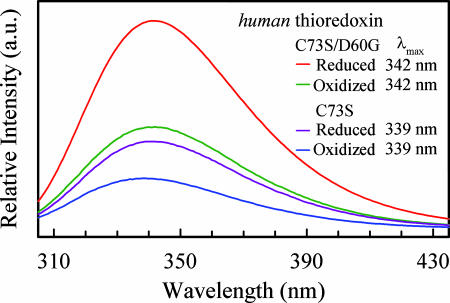
The hTrx protein was found to easily form homodimers through an interprotein C73-C73 disulfide linkage (36). All our studies focus on hTrx monomer through mutation of C73 to serine (S73) to remove the disulfide bridge. The steady-state fluorescence spectra of W31 for two hTrx mutants C73S and C73S/D60G with both reduced and oxidized states are shown in Fig. 2. All emission peaks are ≈340 nm, similar to the emission maxima of E. coli thioredoxin (37, 38), indicating that W31 is located at the protein surface and fully exposed to aqueous environment (39), consistent with the x-ray structure. For each mutant, both reduced and oxidized states have the same emission peak, but their intensities are very different. The fluorescence intensity in the reduced state is about two times stronger, indicating significant quenching by the disulfide bond in the oxidized form. By mutation of D60 to G60, we observed an increase in intensity by a factor of 2, suggesting serious quenching by D60. Similar fluorescence changes have also been observed for thioredoxin from other species (28, 37, 38). The observed 3-nm difference of emission peaks for the two mutants are not due to changes in hydrophobicity but due to the multiple emissions with different peaks (decay associated emission spectra) (40), as discussed below.
Fig. 2.
Steady-state fluorescence emission spectra of W31 in hTrx (C73S) and D60G in reduced and oxidized states. For both mutants, note that the fluorescence intensity in reduced state is ≈2-fold of that in oxidized state. Also note that there is an ≈2-fold increase in intensity as a result of the mutation of aspartate to glycine.
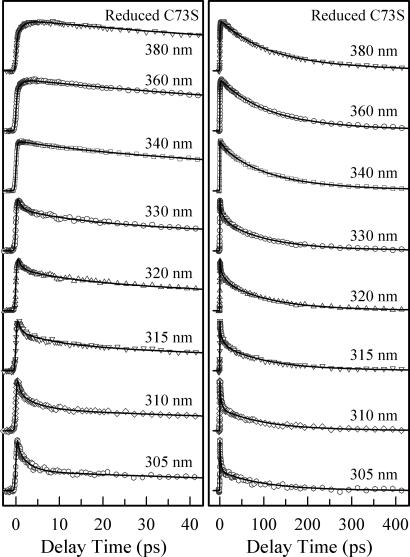
We first studied the reduced hTrx mutant C73S without disulfide-bond quenching. Fig. 3 shows the femtosecond-resolved fluorescence transients of W31 for several typical wavelengths gated from the blue to red side of the emission. Apparently, the overall decay dynamics is slower than that of aqueous tryptophan in a similar buffer condition (22) and similar to tryptophan solvation on protein surfaces (24–26, 41, 42). Solvation components for all blue-side transients are well presented by a double-exponential decay with time constants ranging from 0.3 to 1 ps and from 2.6 to 12.6 ps. All transients at the red-side emission have a single rise component with time constants in the range of 0.7–1.3 ps. Through the global data analysis, we observed two fluorescence lifetimes of 95 and 275 ps and these dramatically shortened lifetimes result from local quenching processes (see below).
Fig. 3.
Normalized, femtosecond-resolved fluorescence transients in the reduced state of hTrx (C73S) in the short (Left) and long (Right) time ranges with a series of gated fluorescence emissions. Note the fast solvation at the blue side, whereas the fluorescence lifetimes are significantly shortened.
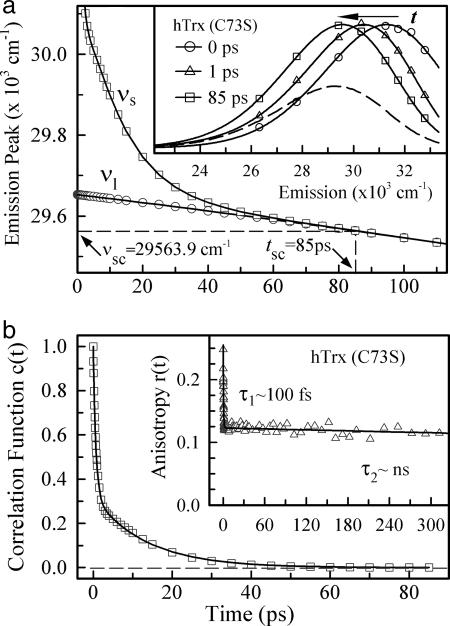
With the methodology we recently developed (22), we constructed the overall and lifetime-associated femtosecond-resolved emission spectra for the reduced hTrx (C73S). By fitting these femtosecond-resolved emission spectra to a lognormal function (Fig. 4a, inset), we deduced the femtosecond-resolved overall emission maxima νs and lifetime-associated emission maxima νl, and determined the solvation-complete time (tsc = 85 ps) and merging emission peak (νsc = 29,564 cm−1), as shown in Fig. 4a. The obtained total dynamic Stokes shift is 1,725 cm−1, and the emission maximum νs(0) at t = 0 is ≈320 nm, consistent with previous observations (43) and recent MD simulations (44). The possible contribution of vibrational relaxation is negligible (24), and thus the observed total Stokes shift is predominantly from the local solvation. Using c(t) = [νs(t) − νl (t)]/[νs(0) − νl(0)], we subsequently constructed the solvation correlation function, and the result is shown in Fig. 4b and summarized in Table 1. The solvation dynamics can be best described by a double-exponential decay with time constants of 0.67 ps with 68% of the total amplitude and 13.2 ps (32%).
Fig. 4.
Femtosecond-resolved emission spectra and hydration dynamics. (a) Femtosecond-resolved emission maxima of the overall spectra (νs) and lifetime-associated spectra (νl) for hTrx (C73S) in its reduced state. (Inset) Several normalized, femtosecond-resolved overall emission spectra, and the dashed curve is the corresponding steady-state emission spectrum. (b) The deduced hydration correlation function from a. (Inset) The femtosecond-resolved fluorescence anisotropy dynamics of W31. The initial ≈100-fs decay is due to the internal conversion between 1La and 1Lb states. Note the restricted local motion of W31, shown here by the apparent absence of subnanosecond decay.
Table 1.
Results obtained from the hydration correlation functions c(t) of three mutants in reduced state
| hTrx | τ1, ps | τ2, ps | c1 | c2 |
|---|---|---|---|---|
| D60 | 0.67 | 13.2 | 0.68 | 0.32 |
| D60G | 0.47 | 12.7 | 0.67 | 0.33 |
| D60N | 0.53 | 10.8 | 0.69 | 0.31 |
All the hydration correlation functions were fitted with c(t) = c1e−t/τ 1 + c2e−t/τ 2 = 1, where c1 + c2 = 1.
The constructed solvation correlation function is the response of the local environment around W31 to its sudden shift in charge distribution from the ground state to the excited state. Under this perturbation, the response can result from both the surrounding water molecules and the protein (polar/charged residues and backbone) (45). Within 7 Å from W31, there is only one charged residue, D60, at 3.59 Å, which forms a hydrogen bond between O of the carboxyl group and N of the indole ring (Fig. 1). We studied the mutants of D60G and D60N to have W31 in hydrophobic and polar environments, respectively, and obtained nearly the same solvation-complete times (tsc), merging emission peaks (νsc), and correlation functions such as those in Fig. 4b and Table 1. These results are striking and show that the charged/polar residues (D60/D60N) make a negligible contribution to the total Stokes shift (26). We also studied the local rigidity by the measurement of anisotropy changes of W31 with time, and the result is shown in Fig. 4b Inset. Within >800 ps, the anisotropy is nearly constant and decays on the nanosecond time scale, indicating an immobile local structure around W31. Thus, the obtained solvation correlation function in Fig. 4b essentially represents local hydration dynamics, reflecting water motions occurring within 13.2 ps at the active site.
Dissection of Complex Quenching Dynamics at the Active Site.
ET reaction with disulfide bond.
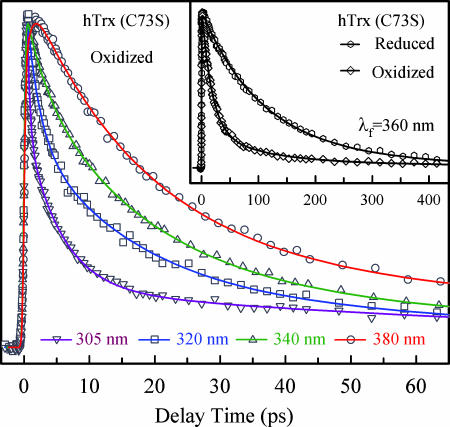
In their oxidized states, the two catalytic cysteines C32 and C35 form a disulfide bridge that significantly quenches excited W31 (Fig. 2). Fig. 5 shows the femtosecond-resolved fluorescence transients of W31 for several typical wavelengths gated from the blue to red side of emission. Clearly, all transients are significantly faster than those obtained at the same wavelengths for the reduced state (Fig. 3), as shown in the inset of Fig. 5 for 360-nm emission. At the red side of emission, all transients can be globally fitted by an initial ultrafast hydration rise (0.43–0.87 ps) and three exponential decays: one is 17.5 ps with a major contribution (≈74% amplitude), and two minor components (26% in total) are 95 ps and 615 ps. We also observed the similar time constants of 15 and 10 ps with significant contributions in oxidized mutants of D60G and D60N, respectively. Thus, the 10–17.5 ps is the time scale of ET reaction from excited W31 to the disulfide bond at a distance of ≈5.75 Å. The difference in reaction times is a result of local configuration changes between W31 and the disulfide bond due to mutations. At the blue side of emission, the second long-time hydration dynamics (13.2 ps) is on the same time scale as the ET reaction (10–17.5 ps), and thus both of the dynamics are mixed together, even though we can resolve the first ultrafast hydration component (0.67 ps). Here, we can accurately determine the ET reaction time of 10–17.5 ps by femtosecond-resolved fluorescence gating of the fully relaxed state at the red-side emission. Thus, the elucidation of the time scales, in this case, even τsol ≈ τET, is crucial to the understanding of complex protein dynamics.
Fig. 5.
Four representative fluorescence transients of oxidized hTrx (C73S) from 305 to 380 nm. Note the fast decay of quenching dynamics by the disulfide bridge at the red side of emission, whereas the solvation decay components are intertwined with the quenching process at the blue side. (Inset) A comparison of the transients at 360 nm for two redox states.
Charge separation with peptide bond.
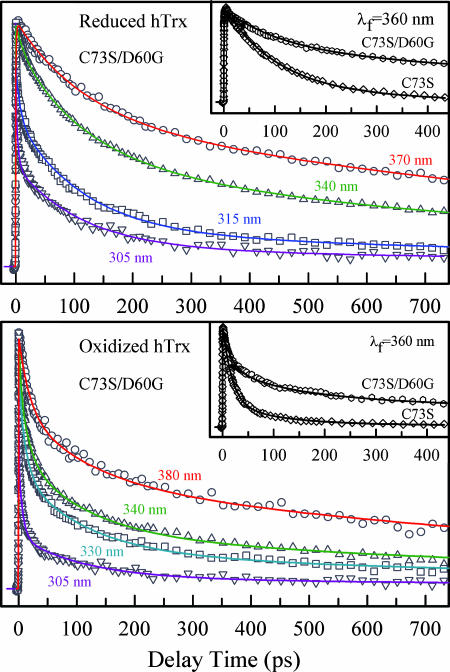
In both reduced and oxidized mutant C73S, we observed a very short lifetime of 95 ps. This short lifetime could be caused by potential quenching residues or peptide bonds around W31. Within 7 Å of the indole ring, the only possible quenching residue is D60. Fig. 6 show the femtosecond-resolved fluorescence transients of the mutant D60G gated from the blue to red side of emission for the reduced and oxidized states. For all red-side transients in two states, we still observed short lifetimes of 108 and 114 ps. We even mutated D60 to a polar residue D60N, and we also observed short lifetimes of 105 and 109 ps for both states. The robust observation of ≈100 ps quenching dynamics, regardless of neighboring charged, polar, and hydrophobic residues, must be from a charge separation from excited W31 to adjacent peptide bond(s). Examination of the local protein structure in close proximity to W31 revealed that the closest distance between the indole ring and its nearest peptide bond (between W31 and C32) is ≈3.61 Å (Fig. 1). Peptide bond has recently been proposed as a strong quencher of excited tryptophan to interpret different lifetimes observed in proteins (33, 34). Recent studies of a well designed cyclic peptide indicated that the quenching time could range from a few to hundreds of picoseconds, depending on local configurations (35). The slight difference in reaction times with the peptide bond for three mutants probably results from the small alteration of their relative geometries due to mutations. Thus, the ≈100 ps is the ET time from excited W31 to the peptide bond at a 3.61-Å distance in hTrx.
Fig. 6.
Femtosecond-resolved fluorescence dynamics of mutant D60G. (Upper) Four representative fluorescence transients of reduced D60G. (Inset) The dramatic lengthening of fluorescence lifetime(s) at 360 nm (and all other wavelengths) in C73S/D60G as compared with C73S. (Lower) Four representative fluorescence transients of oxidized D60G. Note that all of the transients decay faster because of the quenching by the disulfide bridge. (Inset) The transients of oxidized C73S/D60G and C73S at 360 nm for a comparison.
Electronic quenching with neighboring residues.
At the blue side of emission, we observed the same hydration dynamics in the reduced state and a similar ET reaction dynamics (10–17.5 ps) in the oxidized state of three mutants. Besides the observed robust short lifetime of ≈100 ps by peptide-bond quenching, there is another lifetime that varies in different mutants and in two states. Table 2 summarizes their lifetimes and percentages of contributions. From reduced D60 to D60G, we observed the change of the lifetime 275 ps to 1.26 ns. We attributed 275 ps to the quenching dynamics by the adjacent charged residue D60 at a hydrogen-bond distance of 3.59 Å. The 1.26 ns observed in reduced D60G is from weak quenching by the neighboring cysteine residue (C32) at a distance of ≈4.24 Å, similar to the lifetime we recently observed for the cysteine quenching in Staphylococcus nuclease (26). In oxidized D60, the 275 ps changes to 615 ps, which must be because of the variation of local configurations with different separation distances and/or orientations upon formation of the disulfide bridge. For reduced D60N, we observed a 1.2-ns lifetime, which becomes 3.5 ns in the oxidized state. The quenching induced by the mutation of D60N is significantly reduced, consistent with its x-ray structure, which shows that the asparagine residue flips away from W31 (14). These quenching dynamics by the residues D60 and C32 all occur in the range from 275 ps to 1.2 ns, and the time scales depend on their chemical identities and local configurations (distance and orientation).
Table 2.
Results of total electron-transfer quenching dynamics of three mutants in reduced and oxidized states
| hTrx | D60 |
D60G |
D60N |
|||
|---|---|---|---|---|---|---|
| R | O | R | O | R | O | |
| τs, ps | 17.5 | 10.0 | 15.0 | |||
| c1, % | 74.1 | 40.2 | 54.2 | |||
| τp, ps | 95 | 95 | 108 | 114 | 105 | 109 |
| c2, % | 73.8 | 21.2 | 39.2 | 29.5 | 20.3 | 31.8 |
| τr, ps | 275 | 615 | 1,264 | 969 | 1,201 | 3,500 |
| c3, % | 26.2 | 4.7 | 60.8 | 30.3 | 79.7 | 14.0 |
R, reduced state; O, oxidized state. τs, τp, τr are quenching times by sulfide bond, peptide bond, and potential residues, respectively. The sum of the population percentages (ci, i = 2, 3, or 1–3) for each state is 100.
Local Structure and Dynamical Heterogeneity.
The anisotropy dynamics of W31 (Fig. 4b Inset) shows a rigid local structure in the time window of 800 ps, consistent with the inflexible turn (-T30W31-) in the transition from the second β-sheet and the second α helix (Fig. 1). The hydrogen bonding with D60 further anchors W31 on the protein surface. In the oxidized state, the disulfide bond adds more constrains on the flexibility of the active site. However, we observed significant quenching dynamics of W31 with the adjacent disulfide bond, peptide bond, and quenching residue(s), reflecting a distribution of dynamic heterogeneous configurations. Thus, the protein must fluctuate on a time scale of longer than several nanoseconds, a process recently called as solvent-slaved α fluctuations (46–48). At such longer times, because the time interval between two consecutive pump excitations is 2 ms and each transient was averaged over >1 h, all fluctuated protein configurations would be sampled. Thus, the observed several quenching processes do not mean that several static configurations are present, but they mainly represent a temporal configuration distribution; the protein is in dynamic heterogeneity. Similar anisotropy dynamics were observed even for D60G and D60N, and W31 is indeed locked in the rigid turn but slowly fluctuates with the protein.
Conclusions
We reported our studies of dissecting complex protein dynamics in hTrx using site-directed mutagenesis and femtosecond-resolved fluorescence spectroscopy. Four elementary dynamical processes were found to concurrently occur within 1 ns upon excitation of W31 at the active site. Using this single intrinsic tryptophan as a local optical probe and from the measurements of three mutants with a charged, polar, or hydrophobic residue around the probe, we unambiguously determined the time scales of hydration dynamics at the active site to be 0.47–0.67 and 10.8–13.2 ps. The former time is the result of local reorientational/translational motions of water near the active site; the latter is a direct measure of surface hydration coupled with the local protein fluctuation (45). These results are consistent with our recent studies of surface hydration dynamics in enzyme Staphylococcus nuclease (26). In both systems, the contribution to local solvation by protein sidechains is relatively insignificant. The observation of the longer time solvation dynamics is significant and the dynamics controls sidechain motions, a process of hydration-shell-coupled β fluctuations (47).
We determined the quenching dynamics of excited tryptophan by a disulfide bond, a common motif of tryptophan near a disulfide bond in many proteins although the biological implication is still unknown (49). We separated the quenching reaction from the hydration dynamics even though both processes occur on the same time scale, and observed a time scale of 10–17.5 ps for the ET quenching at a separation distance of ≈5.75 Å for three mutants of oxidized hTrx. From studies of three mutants and their two redox states, we observed a robust quenching dynamics of ≈100 ps in all of the proteins and this dynamics represents the charge-transfer reaction from excited tryptophan to the adjacent peptide bond at a 3.61-Å distance, a quenching mechanism which was recently proposed to interpret various short lifetimes of tryptophan observed in proteins (33, 34). The quenching dynamics by aspartate residue at a hydrogen-bond distance of 3.59 Å in two redox states were also determined and the time scales are within hundreds of picoseconds (275–615 ps).
The key to understand complex protein dynamics is the time scales of dissected elementary processes. In hTrx, the enzyme fluctuation, slaved by bulk solvent (α fluctuations), takes nanoseconds or longer to recognize substrate proteins and optimize their interactions. The redox reaction of dithiol-disulfide exchanges occurs on a shorter time scale of less than nanoseconds, and in this time period, the active site remains relatively immobile, as observed in the anisotropy dynamics, to make efficient catalysis. During the electron (and proton) transfer between two active sites, intermediate water molecules move ultrafast within 13 ps to reorganize hydrogen bond networks instantaneously and control sidechain flexibility (β fluctuations) to facilitate the catalytic reactions. The redox function is completed in continuously synergistic motions over the wide time scales. Thus, elucidation of complex dynamical evolution is essential for complete characterization of molecular mechanisms of biological function.
Materials and Methods
Sample Preparation.
hTrx mutants C73S, C73S/D60G, and D60N were designed, overexpressed, and purified as described in refs. 36, 50, and 51. Thioredoxin samples were dissolved in a 50 mM Tris·HCl buffer, pH 7.5, to keep the enzyme in a monomer form (36). Oxidized hTrx was achieved as a result of air oxidization throughout an extensive time period of purification and storage. Reduction of hTrx was then obtained by adding fresh 10 mM DTT. For time-resolved experiments, the concentration of protein samples was typically 200–300 μM, whereas the concentration was 5–10 μM for steady-state fluorescence measurements.
Femtosecond Methods.
All time-resolved measurements were carried out by using the femtosecond-resolved fluorescence up-conversion apparatus, as detailed in refs. 23 and 52. Briefly, the femtosecond laser pulse after a two-stage amplifier (Spitfire; Spectra Physics, San Jose, CA) has a temporal width of 110 fs centered at 800 nm, energy of >2 mJ, and a repetition rate of 1 kHz. Half of the laser energy was used to pump an optical parametric amplifier (OPA-800C; Spectra Physics) to generate signal (1,289 nm) and idler (2,109 nm) beams. The latter was mixed with the residual fundamental beam (800 nm) in a 0.2-mm β-barium borate crystal (type I) to generate a femtosecond pulse centered at 580 nm. This laser pulse was subsequently compressed through a pair of prisms to improve the temporal resolution to ≈60 fs before being frequency-doubled to generate the pump beam at 290 nm with a second 0.2-mm β-barium borate crystal. The pump pulse energy was typically attenuated to ≈140 nJ before being focused into the motor-controlled rotating sample cell.
The fluorescence emission was collected by a pair of parabolic focus mirrors and mixed with an attenuated fundamental pulse (800 nm) in a 0.2-mm β-barium borate crystal through a noncollinear configuration. The up-converted signal ranging from 218 to 292 nm was detected by a photomultiplier coupled with a double-grating monochromator. The instrument response time under the current noncollinear geometry is 400–500 fs as determined from the up-conversion signal of Raman scattering of water ≈320 nm. The polarization of the pump beam was set at the magic angle (54.7°) with respect to the acceptance axis (vertical) of the up-conversion crystal and the polarization of the gating beam was set parallel to this axis with a half-wave plate. For time-resolved fluorescence anisotropy measurements, the polarization of the pump beam was rotated to either parallel or perpendicular to the acceptance axis to obtain the parallel (I//) or perpendicular signal (I⊥), respectively. Time-resolved tryptophan fluorescence anisotropy was constructed as r(t) = (I// − I⊥)/(I// + 2I⊥).
Acknowledgments
We thank Prof. William R. Montfort (University of Arizona, Tucson, AZ) for a generous gift of the plasmids containing hTrx constructs for mutants, Jongjoo Kim for the initial help with the experiments, and Luyuan Zhang and Ya-Ting Kao for many helpful discussions. This work was supported by the Packard Foundation Fellowship, the Petroleum Research Fund, the U.S. National Science Foundation (D.Z.), and Natural Sciences and Engineering Research Council of Canada (D.A.R.S.).
Abbreviations
- hTrx
human thioredoxin
- ET
electron transfer.
Footnotes
The authors declare no conflict of interest.
This article is a PNAS Direct Submission.
References
- 1.Zewail AH. Annu Rev Phys Chem. 2006;57:65–103. doi: 10.1146/annurev.physchem.57.032905.104748. [DOI] [PubMed] [Google Scholar]
- 2.Zewail AH. Philos Trans R Soc London A. 2005;363:315–329. doi: 10.1098/rsta.2004.1513. [DOI] [PubMed] [Google Scholar]
- 3.Wolynes PG. Philos Trans R Soc London A. 2005;363:453–464. doi: 10.1098/rsta.2004.1502. [DOI] [PubMed] [Google Scholar]
- 4.Callender R, Dyer RB. Chem Rev. 2006;106:3031–3042. doi: 10.1021/cr050284b. [DOI] [PubMed] [Google Scholar]
- 5.Kao Y-T, Saxena C, Wang L, Sancar A, Zhong D. Proc Natl Acad Sci USA. 2005;102:16128–16132. doi: 10.1073/pnas.0506586102. [DOI] [PMC free article] [PubMed] [Google Scholar]
- 6.Boehr DD, McElheny D, Dyson HJ, Wright PE. Science. 2006;313:1638–1642. doi: 10.1126/science.1130258. [DOI] [PubMed] [Google Scholar]
- 7.Frauenfelder H, Sligar SG, Wolynes PG. Science. 1991;254:1598–1603. doi: 10.1126/science.1749933. [DOI] [PubMed] [Google Scholar]
- 8.Zewail AH. Angew Chem Int Ed. 2000;39:2587–2631. [Google Scholar]
- 9.Zhong D, Zewail AH. Proc Natl Acad Sci USA. 2001;98:11867–11872. doi: 10.1073/pnas.211440398. [DOI] [PMC free article] [PubMed] [Google Scholar]
- 10.Zhong D, Pal SK, Zhang D, Chan SI, Zewail AH. Proc Natl Acad Sci USA. 2002;99:13–18. doi: 10.1073/pnas.012582399. [DOI] [PMC free article] [PubMed] [Google Scholar]
- 11.Brixner T, Stenger J, Vaswani HM, Cho M, Blankenship RE, Fleming GR. Nature. 2005;434:625–628. doi: 10.1038/nature03429. [DOI] [PubMed] [Google Scholar]
- 12.Kukura P, McCamant DW, Yoon S, Wandschneider DB, Mathies RA. Science. 2005;310:1006–1009. doi: 10.1126/science.1118379. [DOI] [PubMed] [Google Scholar]
- 13.Chattoraj M, King BA, Bublitz GU, Boxer SG. Proc Natl Acad Sci USA. 1996;93:8362–8367. doi: 10.1073/pnas.93.16.8362. [DOI] [PMC free article] [PubMed] [Google Scholar]
- 14.Weichsel A, Gasdaska JR, Powis G, Montfort WR. Structure (London) 1996;4:735–751. doi: 10.1016/s0969-2126(96)00079-2. [DOI] [PubMed] [Google Scholar]
- 15.Jeng M-F, Holmgren A, Dyson HJ. Biochemistry. 1995;34:10101–10105. doi: 10.1021/bi00032a001. [DOI] [PubMed] [Google Scholar]
- 16.Powis G, Montfort WR. Annu Rev Biophys Biomol Struct. 2001;30:421–455. doi: 10.1146/annurev.biophys.30.1.421. [DOI] [PubMed] [Google Scholar]
- 17.Holmgren A, Bjornstedt M. Methods Enzymol. 1995;252:199–208. doi: 10.1016/0076-6879(95)52023-6. [DOI] [PubMed] [Google Scholar]
- 18.Mustacich D, Powis G. Biochem J. 2000;346:1–8. [PMC free article] [PubMed] [Google Scholar]
- 19.Holmgren A. J Biol Chem. 1989;264:13963–13966. [PubMed] [Google Scholar]
- 20.Katti SK, Lemaster DM, Eklund H. J Mol Biol. 1990;212:167–184. doi: 10.1016/0022-2836(90)90313-B. [DOI] [PubMed] [Google Scholar]
- 21.Filson H, Fox A, Kelleher D, Windle HJ, Sanders DAR. Acta Crystallogr D. 2003;59:1280–1282. doi: 10.1107/s0907444903009624. [DOI] [PubMed] [Google Scholar]
- 22.Lu W, Kim J, Qiu W, Zhong D. Chem Phys Lett. 2004;388:120–126. [Google Scholar]
- 23.Zhang L, Kao Y-T, Qiu W, Wang L, Zhong D. J Phys Chem B. 2006;110:18097–18103. doi: 10.1021/jp063025e. [DOI] [PubMed] [Google Scholar]
- 24.Qiu W, Zhang L, Kao Y-T, Lu W, Li T, Kim J, Sollenberger G, Wang L, Zhong D. J Phys Chem B. 2005;109:16901–16910. doi: 10.1021/jp0511754. [DOI] [PubMed] [Google Scholar]
- 25.Qiu W, Zhang L, Okobiah O, Yang Y, Wang L, Zhong D, Zewail AH. J Phys Chem B. 2006;110:10540–10549. doi: 10.1021/jp055989w. [DOI] [PubMed] [Google Scholar]
- 26.Qiu W, Kao Y-T, Zhang L, Yang Y, Wang L, Stites WE, Zhong D, Zewail AH. Proc Natl Acad Sci USA. 2006;103:13979–13984. doi: 10.1073/pnas.0606235103. [DOI] [PMC free article] [PubMed] [Google Scholar]
- 27.Kim J, Lu W, Qiu W, Wang L, Caffrey M, Zhong D. J Phys Chem B. 2006;110:21994–22000. doi: 10.1021/jp062806c. [DOI] [PubMed] [Google Scholar]
- 28.Merola F, Rigler R, Holmgren A, Brochon JC. Biochemistry. 1989;28:3383–3398. doi: 10.1021/bi00434a038. [DOI] [PubMed] [Google Scholar]
- 29.Elofsson A, Rigler R, Nilsson L, Roslund J, Krause G, Holmgren A. Biochemistry. 1991;30:9648–9656. doi: 10.1021/bi00104a012. [DOI] [PubMed] [Google Scholar]
- 30.Kemple MD, Yuan P, Nollet KE, Fuchs JA, Silva N, Prendergast FG. Biophys J. 1994;66:2111–2126. doi: 10.1016/S0006-3495(94)81006-9. [DOI] [PMC free article] [PubMed] [Google Scholar]
- 31.Martinho JMG, Santos AM, Fedorov A, Baptista RP, Taipa MA, Cabral JMS. Photochem Photobiol. 2003;78:15–22. doi: 10.1562/0031-8655(2003)078<0015:fotsto>2.0.co;2. [DOI] [PubMed] [Google Scholar]
- 32.Hennecke J, Sillen A, HuberWunderlich M, Engelborghs Y, Glockshuber R. Biochemistry. 1997;36:6391–6400. doi: 10.1021/bi963017w. [DOI] [PubMed] [Google Scholar]
- 33.Callis PR, Vivian JT. Chem Phys Lett. 2003;369:409–414. [Google Scholar]
- 34.Callis PR, Liu TQ. J Phys Chem B. 2004;108:4248–4259. [Google Scholar]
- 35.Pan CP, Barkley MD. Biophys J. 2004;86:3828–3835. doi: 10.1529/biophysj.103.038901. [DOI] [PMC free article] [PubMed] [Google Scholar]
- 36.Andersen JF, Sanders DAR, Gasdaska JR, Weichsel A, Powis G, Montfort WR. Biochemistry. 1997;36:13979–13988. doi: 10.1021/bi971004s. [DOI] [PubMed] [Google Scholar]
- 37.Stryer L, Holmgren A, Reichard P. Biochemistry. 1967;6:1016–1020. doi: 10.1021/bi00856a009. [DOI] [PubMed] [Google Scholar]
- 38.Holmgren A. J Biol Chem. 1972;247:1992–1998. [PubMed] [Google Scholar]
- 39.Lakowicz JR. Principles of Fluorescence Spectroscopy. New York: Plenum; 1999. [Google Scholar]
- 40.Pan CP, Callis PR, Barkley MD. J Phys Chem B. 2006;110:7009–7016. doi: 10.1021/jp056164p. [DOI] [PubMed] [Google Scholar]
- 41.Peon J, Pal SK, Zewail AH. Proc Natl Acad Sci USA. 2002;99:10964–10969. doi: 10.1073/pnas.162366099. [DOI] [PMC free article] [PubMed] [Google Scholar]
- 42.Pal SK, Peon J, Zewail AH. Proc Natl Acad Sci USA. 2002;99:1763–1768. doi: 10.1073/pnas.042697899. [DOI] [PMC free article] [PubMed] [Google Scholar]
- 43.Scott TW, Campbell BF, Cone RL, Friedman JM. Chem Phys. 1989;131:63–79. [Google Scholar]
- 44.Vivian JT, Callis PR. Biophys J. 2001;80:2093–2109. doi: 10.1016/S0006-3495(01)76183-8. [DOI] [PMC free article] [PubMed] [Google Scholar]
- 45.Li T, Hassanali AA, Kao Y-T, Zhong D, Singer SJ. J Am Chem Soc. 2007 doi: 10.1021/ja0685957. in press. [DOI] [PubMed] [Google Scholar]
- 46.Fenimore PW, Frauenfelder H, McMahon BH, Parak FG. Proc Natl Acad Sci USA. 2002;99:16047–16051. doi: 10.1073/pnas.212637899. [DOI] [PMC free article] [PubMed] [Google Scholar]
- 47.Fenimore PW, Frauenfelder H, McMahon BH, Young RD. Proc Natl Acad Sci USA. 2004;101:14408–14413. doi: 10.1073/pnas.0405573101. [DOI] [PMC free article] [PubMed] [Google Scholar]
- 48.Frauenfelder H, Fenimore PW, Chen G, McMahon BH. Proc Natl Acad Sci USA. 2006;103:15469–15472. doi: 10.1073/pnas.0607168103. [DOI] [PMC free article] [PubMed] [Google Scholar]
- 49.Ioerger TR, Du CG, Linthicum DS. Mol Immunol. 1999;36:373–386. doi: 10.1016/s0161-5890(99)00032-2. [DOI] [PubMed] [Google Scholar]
- 50.Gasdaska JR, Berggren M, Powis G. Cell Growth Differ. 1995;6:1643–1650. [PubMed] [Google Scholar]
- 51.Oblong JE, Berggren M, Gasdaska PY, Powis G. J Biol Chem. 1994;269:11714–11720. [PubMed] [Google Scholar]
- 52.Saxena C, Sancar A, Zhong D. J Phys Chem B. 2004;108:18026–18033. [Google Scholar]


