

Abstract
Aims
The present study examines the prevalence trends and college-level characteristics associated with the non-medical use of prescription drugs (i.e. amphetamines, opioids, sedatives, tranquilizers) and illicit drug use among US college students between 1993 and 2001.
Design
Data were collected from self-administered mail surveys, sent to independent cross-sectional samples of college students from a nationally representative sample of 119 colleges in 4 years between 1993 and 2001.
Setting
Nationally representative 4-year US colleges and universities in 1993, 1997, 1999 and 2001.
Participants
Representative samples of 15 282, 14 428, 13 953 and 10 904 randomly selected college students at these colleges in 1993, 1997, 1999 and 2001, respectively.
Findings
The results indicate that life-time and 12-month prevalence rates of non-medical use of prescription drugs (NMPD) increased between 1993 and 2001. Specific college-level characteristics were found to be correlated positively (marijuana use) and negatively (historically black college status and commuter status) with NMPD, consistently across the four cross-sectional samples. Significant between-college variation in terms of trajectories in the prevalence of NMPD over time was found in hierarchical linear models, and selected college-level characteristics were not found to explain all of the variation in the trajectories, suggesting the need for further investigation of what determines between-college variance in the prevalence trends.
Conclusions
The findings of the present study suggest that continued monitoring of NMPD and illicit drug use among college students is needed and collegiate substance prevention programs should include efforts to reduce these drug use behaviors.
Keywords: college students, epidemiology, non-medical use, prescription drugs
INTRODUCTION
National epidemiological studies and college-based studies provide evidence that the non-medical use of prescription drugs (NMPD) is a problem among college-age young adults in the United States [1,2]. According to the 2003 National Survey on Drug Use and Health (NSDUH) data, the 12-month prevalence of NMPD is highest among young adults 18–25 years of age compared to any other age group [2].
Previous studies have shown that the prevalence of NMPD can vary considerably across US colleges [3–6]. For example, individual colleges using random sampling have reported past 12-month prevalence rates of non-medical use of methylphenidate (Ritalin®) ranging from 3% to 17% across individual schools [3,6]. Further, a national study analyzing random samples of students from a nationally representative sample of US colleges found past 12-month prevalence rates of non-medical use of prescription opioids ranging from 0% at the lowest-use schools to 20% at the highest-use school [4].
While there is growing evidence regarding the individual-level variables associated with NMPD, very little work has examined the college-level variables associated with NMPD. Recent investigations have reinforced the value of using nationally representative samples of US colleges and universities when examining drug use among college students because there are important college-level factors that are associated with NMPD [4,5]. For instance, a nationally representative cross-sectional study of US colleges found that no students attending three historically black colleges reported non-medical use of prescription stimulants in the past 12 months [5]. Further, previous studies have indicated a strong association between college-level prevalence rates of NMPD and college-level prevalence rates of other drug use, such as marijuana use [4,5]. For example, the correlation between a school’s past-year aggregate rate of non-medical use of opioids and marijuana use was r = 0.51 (P < 0.001) [4]. Previous work has not examined whether associations of college-level characteristics with NMPD remain stable over time, and such information has important implications for prevention and intervention efforts.
To date, studies have not examined the trends of non-medical use for various classes of prescription drugs in multiple data collections at the same US colleges or types of colleges (e.g. historically black colleges and universities). Therefore, more investigations are needed to determine if there is stability in high rates of NMPD at the same types of colleges because such information would be particularly helpful for developing evidence-based environmental prevention and intervention efforts. The primary aim of the present study is to assess the prevalence and trends of NMPD among US college students between 1993 and 2001. A secondary aim was to explore whether selected college-level characteristics explained the variation in college-level prevalence trajectories over time.
METHODS
The present study draws upon data collected via the College Alcohol Study (CAS) from the same 119 4-year US colleges and universities in 1993, 1997, 1999 and 2001. The participating schools were selected from the American Council on Education’s list of all accredited 4-year US colleges and universities with the exception of seminary schools, military schools, allied health schools and 20 schools that were unable to provide a random sample of students. There were no differences in the college-level characteristics (e.g. geographical region, co-educational status, admission criteria) between the participating schools and those 20 schools that were unable to provide a random sample. An administrator from each participating school provided a random sample of 215 full-time college students. Questionnaires were mailed to students beginning in February in each survey year. Three subsequent mailings, usually 10 days apart, were sent to students: a reminder postcard, a second questionnaire and a second reminder postcard. Mailing schedules were slightly different for some schools to avoid the period immediately preceding and following spring break. Student responses to the survey were voluntary and anonymous, and students were told that they did not have to answer any question that made them uncomfortable. To increase response rates, cash prizes were offered to students who entered a drawing each study year. One school was excluded because the response rate was considerably lower than the other 119 schools in multiple years.
College response rates declined across the 4 survey years: the response rates were 70% in 1993 (range 48–100%), 59% in 1997 (26–88%), 59% in 1999 (27–83%) and 52% in 2001 (22–86%). To check for potential biases introduced by survey non-response, we calculated the college-level Pearson correlation coefficient between the primary outcome variable in the study (each school’s estimated 12-month prevalence rate of NMPD in the past year) and each school’s respective response rates. There were no significant associations (at a 5% level of significance) between the response rate and 12-month prevalence rate of NMPD in the past year. In addition, response rates were not found to differ by any college-level characteristics (e.g. geographical region, enrollment size, co-educational status, admission criteria). Finally, the associations found in this study between college-level characteristics and 12-month prevalence of NMPD were also tested in a sensitivity analysis that was restricted to those colleges in each study year with response rates higher than the median response rate. Additional information regarding sampling methods and inclusion criteria for the CAS are described in more detail elsewhere [7–10].
Participants
The diversity of the CAS sample makes it an ideal data source to examine the national prevalence and cross-sectional trends in NMPD among US college students. The CAS samples represent national cross-sections of students enrolled at 4-year colleges in the United States [11,12]. For example, approximately 69% of students in the CAS attended public institutions and 31% attended private institutions. These figures closely resemble the US national distribution of 68% and 32%, respectively, for full-time, 4-year college students. In addition, approximately 23% of students in the CAS attended schools located in the North-east, 29% in the South, 30% in the North Central region and 18% in the West. Eighty-six per cent of students in the CAS attended non-commuter schools and 14% of students attended commuter schools. Finally, 5% of students attended women’s colleges and 2% attended historically black colleges and universities. The sample included all respondents from the same 119 colleges in the 1993 (n = 15282), 1997 (n = 14428), 1999 (n = 13953) and 2001 (n = 10904) CAS surveys.
Demographic differences between the respondents from different survey years were assessed using χ2 analyses and one-way analyses of variance (ANOVAs). Demographic characteristics of the students sampled were generally found to be quite similar in all 4 survey years. For example, the mean age of the sample was approximately 21 years old for each survey year. The proportion of women responding became larger over time (57% in 1993, 59% in 1997, 61% in 1999 and 64% in 2001), and the proportion of white students responding became smaller over time (82% in 1993, 78% in 1997, 77% in 1999 and 76% in 2001). Individual sampling weights were calculated for the sampled students that responded to the survey in each year, and these weights effectively built in the response rates at each college for each year; this was carried out in an effort to offset the amount of non-response that was taking place in certain demographic groups at each college and in each year [10,13]. This weighting methodology was used to ensure that the demographic distribution of the sample in each year was equivalent to the demographic distribution of the school population, and allowed for meaningful comparisons of the estimates from different years. The computed sampling weights were normalized (i.e. divided by the average weight for all respondents) in each study year, to ensure that the sum of the weights used in the analyses would be equal to the sample size.
Measures
For all 4 study years between 1993 and 2001, the measures in the 20-page CAS survey assessed demographic characteristics, alcohol use, illicit drug use and NMPD. Many of these substance use items are known to be valid and reliable for population-based research [14,15]. Many items were similar to those from other national studies and will permit comparisons between the proposed study and other relevant national findings.
NMPD
NMPD was measured with the following item: ‘How often, if ever, have you used any of the drugs listed below? Do not include anything you used under a doctor’s orders’. Each of the following classes of prescription medications were listed separately in each survey year from 1993 to 1999: (a) opiate-type drugs (controlled substances such as codeine, Demerol, Percodan); (b) tranquilizers (prescription-type drugs such as Valium, Librium); (c) barbiturates (prescription-type sleeping pills such as Quaaludes, downs, Yellow Jackets); and (d) amphetamines (prescription-type stimulants such as speed, uppers, ups). In 2001, unlike in earlier years, the lists of examples for three of the classes of prescription medications were updated as follows: (a) opiate-type prescription drugs (codeine, morphine, Demerol, Percodan, Percocet, Vicodin, Darvon, Darvocet); (b) tranquilizers (prescription-type drugs such as Valium, Librium, Xanax, Ativan, Klonopin); and (c) barbiturates (prescription-type sleeping pills such as Seconal, Nembutal, downs or Yellow Jackets). The lists of examples were updated in 2001 to reflect the changing prominence of specific drugs consistent with other national studies, such as the Monitoring the Future (MTF) study [1]. The response scale was (1) never used, (2) used, but not in the past 12 months, (3) used, but not in the past 30 days and (4) used in the past 30 days. An indicator variable was created to assess any NMPD (either in the life-time or in the past year), and consisted of the following drug classes: opioids, tranquilizers or sedatives. Amphetamines were not included in the NMPD index variable due to the changes in question wording in 2001, which were not limited to prescription drugs and included non-prescription amphetamines (e.g. crystal methamphetamine).
Illicit drug use
Illicit drug use was measured with the following item: ‘How often, if ever, have you used any of the drugs listed below? Do not include anything you used under a doctor’s orders’. Drug items included but were not limited to the following in each survey year: ‘marijuana, crack cocaine, other forms of cocaine, heroin, LSD, other psychedelics’. The response scale was (1) never used, (2) used, but not in the past 12 months, (3) used, but not in the past 30 days and (4) used in the past 30 days. Based on previous research [1], an indicator variable was created to assess any illicit drug use other than marijuana, and included the use of any of the following illicit drugs: crack cocaine, other forms of cocaine, heroin, LSD or other psychedelics.
College-level variables
College-level variables available for the CAS included geographical region (North-east, South, North Central and West, based on the US Census), admissions selectivity (most competitive, competitive and less competitive, based on Barron’s Profiles of American Colleges), private/ public status, commuter status, co-educational status, size of student enrollment (> 10 000 students, 5001–10 000, 1000–5000, < 1000), urbanization (suburban/ urban and rural/small town, based on the US Census), and historically black school status (based on whether an institution was recognized as a historically black college or university). Consistent with previous research [16,17], college-level rates of heavy episodic drinking, marijuana use and illicit drug use in 1993 were estimated for each college. The colleges were divided into three approximately equal-sized groups based on percentiles for the estimated 1993 rates, for heavy episodic drinking, marijuana use and illicit drug use.
Data analysis
All statistical analyses were conducted using the SAS/ STAT statistical software package (version 9.1.3), which has a suite of procedures (e.g. SURVEYFREQ) available for the analysis of complex sample survey data [18]. In the present analyses, Taylor Series Linearization [19] was used to estimate robust standard errors of all statistical estimates that reflected the clustered design of the CAS sample (where schools were the primary sampling units). The MIXED procedure in SAS/STAT was used to fit hierarchical linear models to the longitudinal college-level prevalence estimates.
To examine the changing prevalence rates of NMPD and use of illicit drugs over time, weighted prevalence rates for both life-time and past 12-month use of each class of prescription drugs were estimated for each sample year, in addition to design-based standard errors for the estimated rates. The estimated 12-month prevalence rates of non-medical use for three different classes of prescription drugs (opioid analgesics, anxiolytics and sedatives) based on the four independent cross-sectional samples of students were compared between 1993, 1997, 1999 and 2001, using multiple pairwise comparisons of the estimated rates [20]. A conservative Bonferroni correction was applied when assessing the level of statistical significance for the differences within each class of prescription drugs, in order to reduce the likelihood of making a Type I error when performing the multiple comparisons [21].
Estimated prevalence rates for any NMPD (defined as the use of prescription tranquilizers, opioids or sedatives) in the past 12 months were also calculated for specific subpopulations of students, defined by college-level characteristics. Commands appropriate for subpopulation analysis [22] were utilized in SAS when calculating the estimated prevalence rates and design-based standard errors for the college subgroups. Design-based Rao–Scott χ2 tests [23] were used to assess cross-sectional associations of the college-level characteristics with NMPD.
Finally, to address the secondary objective of the study, weighted estimates of 12-month prevalence rates for any NMPD were calculated for each of the 119 colleges in each sample year (resulting in four estimates of prevalence for each college). The estimated prevalence rates for each college were examined over time to determine if colleges tended to have consistent rates of non-medical use over the 8-year period under consideration. An initial hierarchical linear model [24] was fitted to the longitudinal college-level prevalence data, in order to estimate (1) the population-averaged trajectories of the estimated prevalence rates from 1993 to 2001, defined by quadratic functions of a variable measuring years since 1993 (0, 4, 6, 8) and (2) the between-college variance in the trajectories of the estimated prevalence rates. The 119 colleges were not weighted differentially in the analyses, and likelihood ratio tests based on appropriate mixtures of χ2 distributions were used to determine whether the variance components in the initial hierarchical linear models (HLM) were significantly greater than zero [25,26]. Appropriate transformations of the prevalence estimate responses used in the HLM analyses (e.g. arcsine square root) were considered to satisfy modeling assumptions (e.g. normality and constant variance of random errors) and predicted values based on the fitted models were back-transformed to the original (proportion) scales of the response variable (any NMPD). Significant variance in the random effects of time associated with the colleges would suggest that the trajectory of the non-medical use rate varies depending on the college. For more detailed information regarding the HLM methodology used in the present study, contact the correspondence author.
After fitting the initial HLM to the longitudinal college-level prevalence estimates, college-level characteristics based on (1) previous literature regarding risk factors associated with NMPD among college students [4,5,27] and (2) the college-level characteristics that were significantly associated with any 12-month NMPD in at least one of the 4 survey years (P < 0.05) were added to the HLM, as potential predictors of the college-specific trajectories. This step was considered in an attempt to explain any random between-college variance in the trajectories found in the initial HLM. The percentage of between-college variance in each of the trajectories explained by these college-level predictors was calculated, and the variance components capturing the remaining between-college variance were once again tested against zero using likelihood ratio tests.
RESULTS
Trends in prevalence estimates of non-medical use of prescription drugs
As illustrated in Table 1, the estimated life-time and 12-month prevalence of non-medical use of several prescription drugs increased between 1993 and 2001. The estimated 12-month prevalence of any NMPD (tranquilizer/anxiolytic, opioid, sedative/sleeping medication) increased steadily from 4.41% (SE = 0.22) in 1993, to 5.66% (SE = 0.32) in 1997, to 6.67% (SE = 0.40) in 1999 and to 9.97% (SE = 0.50) in 2001. Based on pairwise comparisons of the cross-sectional prevalence estimates (estimates that are significantly different after a Bonferroni adjustment have different superscripts within a given row in Table 1), the 12-month prevalence of NMPD experienced a significant increase from 1993 to 1997 (P < 0.01), 1999–2001 (P < 0.001) and 1997–2001 (P < 0.001). In contrast, the 12-month prevalence of illicit drug use other than marijuana experienced a significant increase between 1993 and 1997 (P < 0.001) followed by slight decreases in 1999 and 2001. Despite the increasing rates of any NMPD relative to illicit drug use other than marijuana, the 12-month prevalence of any NMPD was lower than illicit drug use other than marijuana in three of the 4 survey years.
Table 1.
Prevalence and trends in non-medical use of prescription and illicit drugs among US college students.
| 1993 | 1997 | 1999 | 2001 | |
|---|---|---|---|---|
| % (SE) | % (SE) | % (SE) | % (SE) | |
| n = 152821 | n = 144281 | n = 139531 | n = 109041 | |
| Life-time prescription drug use | ||||
| Sedative2 | 4.81 (0.27)a | 5.38 (0.32)ab | 5.67 (0.36)ab | 6.13 (0.40)b |
| Tranquilizer2 | 5.94 (0.31)a | 6.46 (0.38)a | 6.93 (0.42)ab | 8.14 (0.46)b |
| Opioid2 | 7.94 (0.32)a | 8.40 (0.41)a | 9.29 (0.42)a | 12.58 (0.59)b |
| Any prescription drug use3 | 11.36 (0.42)a | 11.70 (0.52)a | 12.69 (0.54)a | 16.34 (0.68)b |
| Amphetamine4 | 10.89 (0.51)a | 10.91 (0.47)a | 9.42 (0.43)a | NA |
| Life-time illicit drug use | ||||
| Marijuana | 41.33 (1.06)a | 45.89 (1.24)b | 45.96 (1.25)b | 47.22 (1.16)b |
| Crack cocaine | 1.93 (0.16)a | 2.29 (0.19)ab | 2.53 (0.17)ab | 2.88 (0.23)b |
| Other form of cocaine | 7.99 (0.45)a | 7.71 (0.43)a | 7.80 (0.42)a | 8.02 (0.45)a |
| Heroin | 0.70 (0.09)a | 1.10 (0.14)a | 1.09 (0.12)a | 1.02 (0.13)a |
| LSD | 10.22 (0.49)a | 11.55 (0.58)a | 11.09 (0.55)a | 10.34 (0.53)a |
| Other psychedelic | 10.78 (0.60)a | 13.55 (0.73)b | 13.48 (0.71)b | 12.65 (0.63)ab |
| Any illicit drug other than marijuana5 | 16.20 (0.68)a | 17.92 (0.82)a | 17.80 (0.78)a | 16.56 (0.72)a |
| 12-month prescription drug use | ||||
| Sedative2 | 1.30 (0.11)a | 2.35 (0.19)b | 2.59 (0.25)bc | 3.44 (0.30)c |
| Tranquilizers2 | 1.82 (0.15)a | 2.85 (0.23)b | 3.34 (0.27)b | 4.60 (0.34)c |
| Opioid2 | 3.10 (0.18)a | 3.77 (0.25)ab | 4.51 (0.28)b | 7.34 (0.39)c |
| Any prescription drug use3 | 4.41 (0.22)a | 5.66 (0.32)b | 6.67 (0.40)b | 9.97 (0.50)c |
| Amphetamine4 | 3.50 (0.23)a | 4.08 (0.23)a | 3.73 (0.28)a | NA |
| 12-month illicit drug use | ||||
| Marijuana | 23.22 (0.97)a | 28.40 (1.13)b | 27.56 (1.13)b | 29.73 (1.03)b |
| Crack cocaine | 0.44 (0.06)a | 0.72 (0.08)b | 0.91 (0.10)b | 1.08 (0.12)b |
| Other form of cocaine | 2.02 (0.14)a | 3.11 (0.23)b | 3.49 (0.26)b | 3.79 (0.29)b |
| Heroin | 0.19 (0.04)a | 0.35 (0.05)a | 0.35 (0.07)a | 0.29 (0.07)a |
| LSD | 3.97 (0.27)a | 3.92 (0.26)a | 3.73 (0.28)a | 3.28 (0.27)a |
| Other psychedelics | 4.28 (0.34)a | 6.74 (0.49)b | 5.91 (0.44)bc | 4.78 (0.34)ac |
| Any illicit drug other than marijuana5 | 6.89 (0.41)a | 9.12 (0.53)b | 8.64 (0.55)ab | 7.92 (0.45)ab |
Estimates with different superscripts are significantly different from each other, after applying a Bonferroni correction (P < 0.0083).
Sample sizes used to calculate prevalence estimates varied due to the presence of missing data on the drug items in 1993 (range = 15 063–15 233), 1997 (14 276–14 365), 1999 (13 660–13 793) and 2001 (10 784–10 858).
In 2001, the list of examples of prescription tranquilizers was updated to include ‘Xanax, Ativan and Klonopin’; the list of examples of prescription opioids was updated to include ‘morphine, Percocet, Vicodin, Darvon and Darvocet’; and the list of examples of prescription sedatives was updated to include ‘Seconal and Nembutal’ (see Measures section for full description of the updates in 2001).
‘Any prescription drug use’ consisted of non-medical use of prescription tranquilizers, opioids or sedatives.
The question wording for the ‘amphetamine’ category was changed to include illicit drugs in 2001 and is therefore reflected as NA.
‘Any illicit drug other than marijuana’ included crack cocaine, other forms of cocaine, heroin, LSD, or other psychedelics.
College-level trends in prevalence estimates of non-medical use of prescription drugs
Table 2 presents estimated trends in the prevalence of past-year NMPD, defined as the use of prescription tranquilizers, opioids or sedatives in the past 12 months, for specific subgroups of colleges. The prevalence estimates for this outcome for individual colleges in the sample ranged from 0% to 16% in 1993, 0–19% in 1997, 0–23% in 1999 and 0–32% in 2001. As illustrated in Table 2, results from design-based Rao–Scott χ2 tests [23] indicated that historically black college and university (HBCU) status was associated significantly with NMPD in 1993, 1999 and 2001 (P < 0.001). In 1993, an estimated 1.80% of students at HBCUs reported NMPD in the past year (95% CI = 0.90%, 2.70%), compared to 4.47% of students at non-HBCUs (95% CI = 4.04%, 4.90%); larger differences between the two groups were observed in 1999 and 2001. In addition, commuter status was significantly associated with NMPD in 1997, 1999 and 2001 (P < 0.05). In 1997, an estimated 5.86% of students at non-commuter schools reported NMPD in the past year (95% CI = 5.15%, 6.57%), compared to 4.39% of students at commuter schools (95% CI = 3.50%, 5.28%). Taking into account the increasing prevalence of NMPD use across the 4 years, differences of similar magnitude were observed in 1999 and 2001. Finally, both college-level marijuana use status and illicit drug use status in 1993 were significantly associated with NMPD in each of the 4 survey years (P < 0.01).
Table 2.
Trends in past 12-month non-medical use of prescription drugs by college-level characteristics.1
| 1993 | 1997 | 1999 | 2001 | |
|---|---|---|---|---|
| % (SE) | % (SE) | % (SE) | % (SE) | |
| (n = 15 282) | (n = 14 428) | (n = 13 953) | (n = 10 904) | |
| Historically black status | ||||
| HBCU | 1.80 (0.45) | 3.86 (1.99) | 1.67 (0.69) | 2.67 (1.02) |
| Non-HBCU | 4.47 (0.22) | 5.70 (0.32) | 6.78 (0.40) | 10.12 (0.51) |
| Rao–Scott χ2 (d.f.), P-value | 15.26 (1), P < 0.001 | NS2 | 15.28 (1), P < 0.001 | 16.40 (1), P < 0.001 |
| Geographical region | ||||
| North-east | 3.89 (0.45) | 6.39 (0.67) | 8.22 (1.04) | 10.63 (0.94) |
| South | 5.19 (0.48) | 6.70 (0.53) | 7.62 (0.68) | 11.32 (1.06) |
| North Central | 3.95 (0.26) | 4.21 (0.47) | 4.95 (0.36) | 8.20 (0.64) |
| West | 4.53 (0.47) | 5.43 (0.84) | 6.12 (0.97) | 9.95 (1.28) |
| Rao–Scott χ2 (d.f.), P-value | NS2 | 11.29 (3), P = 0.010 | 12.70 (3), P = 0.005 | NS2 |
| Commuter status | ||||
| Non-commuter | 4.39 (0.24) | 5.86 (0.36) | 6.92 (0.45) | 10.19 (0.57) |
| Commuter | 4.52 (0.45) | 4.39 (0.45) | 5.10 (0.56) | 8.45 (0.66) |
| Rao–Scott χ2 (d.f.), P-value | NS2 | 6.17 (1), P = 0.013 | 6.19 (1), P = 0.013 | 3.90 (1), P = 0.048 |
| Admission criteria | ||||
| Less competitive | 4.33 (0.36) | 5.62 (0.55) | 5.53 (0.55) | 8.27 (0.95) |
| Competitive | 4.54 (0.29) | 5.87 (0.43) | 7.19 (0.53) | 10.74 (0.65) |
| Most competitive | 3.35 (0.34) | 4.41 (0.68) | 6.21 (1.04) | 9.38 (1.14) |
| Rao–Scott χ2 (d.f.), P-value | NS2 | NS2 | NS2 | NS2 |
| School enrollment size | ||||
| < 1000 | 3.76 (2.44) | 5.42 (1.42) | 4.60 (0.81) | 12.18 (1.86) |
| 1000–5000 | 4.03 (0.40) | 5.78 (0.48) | 6.35 (0.61) | 9.55 (1.02) |
| 5001–10 000 | 4.37 (0.41) | 6.16 (0.81) | 7.15 (0.93) | 9.81 (1.19) |
| > 10 001 | 4.60 (0.31) | 5.44 (0.46) | 6.71 (0.60) | 10.06 (0.66) |
| Rao–Scott χ2 (d.f.), P-value | NS2 | NS2 | NS2 | NS2 |
| Type of college | ||||
| Private | 3.47 (0.37) | 4.90 (0.46) | 5.90 (0.66) | 9.32 (1.03) |
| Public | 4.78 (0.25) | 6.00 (0.41) | 6.98 (0.49) | 10.22 (0.57) |
| Rao–Scott χ2 (d.f.), P-value | 8.14 (1), P = 0.004 | NS2 | NS2 | NS2 |
| Co-educational status | ||||
| Co-educational | 4.42 (0.22) | 5.65 (0.32) | 6.72 (0.40) | 9.99 (0.51) |
| Women only | 3.19 (0.67) | 6.27 (2.16) | 4.05 (0.91) | 8.87 (1.94) |
| Rao–Scott χ2 (d.f.), P-value | NS2 | NS2 | 5.06 (1), P = 0.025 | NS2 |
| Urbanization | ||||
| Suburban/urban | 4.18 (0.25) | 5.17 (0.36) | 6.53 (0.41) | 10.12 (0.59) |
| Rural/small town | 4.88 (0.41) | 6.63 (0.60) | 7.05 (0.94) | 9.53 (0.94) |
| Rao–Scott χ2 (d.f.), P-value | NS2 | 5.04 (1), P = 0.025 | NS2 | NS2 |
| 1993 binge drinking | ||||
| Low (35% or less) | 3.76 (0.32) | 4.45 (0.53) | 4.80 (0.66) | 8.91 (0.96) |
| Medium (36–50%) | 4.49 (0.33) | 6.40 (0.43) | 6.68 (0.48) | 9.87 (0.68) |
| High (51% or more) | 4.82 (0.40) | 5.91 (0.61) | 8.07 (0.76) | 10.84 (0.92) |
| Rao–Scott χ2 (d.f.), P-value | NS2 | 6.74 (2), P = 0.035 | 12.83 (2), P = 0.002 | NS2 |
| 1993 marijuana use | ||||
| Low (15% or less) | 2.91 (0.33) | 4.26 (0.61) | 4.39 (0.68) | 7.92 (1.23) |
| Medium (16–25%) | 4.57 (0.28) | 5.18 (0.41) | 6.46 (0.42) | 9.10 (0.75) |
| High (26% or more) | 4.93 (0.39) | 6.85 (0.57) | 7.96 (0.79) | 11.84 (0.67) |
| Rao–Scott χ2 (d.f.), P-value | 15.08 (2), P < 0.001 | 11.66 (2), P = 0.003 | 12.76 (2), P = 0.002 | 9.77 (2), P = 0.008 |
| 1993 other illicit drug use3 | ||||
| Low (4.56% or less) | 3.51 (0.34) | 4.85 (0.51) | 4.92 (0.51) | 7.93 (0.87) |
| Medium (4.57–7.85%) | 4.13 (0.27) | 4.33 (0.42) | 5.87 (0.41) | 9.90 (0.76) |
| High (7.86% or more) | 5.51 (0.42) | 7.75 (0.52) | 9.04 (0.85) | 11.80 (0.84) |
| Rao–Scott χ2 (d.f.), P-value | 18.92 (2), P < 0.001 | 32.95 (2), P < 0.001 | 30.37 (2), P < 0.001 | 10.69 (2), P = 0.005 |
‘Non-medical use of prescription drugs’ included non-medical use of prescription tranquilizers, opioids or sedatives. In 2001, the lists of examples of prescription tranquilizers, opioids and sedatives were updated (see Measures section for full description of the updates).
NS = non-significant (P > 0.05).
‘Other illicit drug use’ included crack cocaine, other forms of cocaine, heroin, LSD or other psychedelics.
HLM results for longitudinal prevalence estimates
The estimated fixed effects of time in the initial HLM for the primary outcome measuring estimated prevalence of any NMPD in the past year indicated a significant, steadily increasing trend in the college-level prevalence estimates as a function of time (see Fig. 1 for an illustration of the fitted trends when considering any NMPD in the past year). In the initial HLM, parameters describing between-college variance in the trajectories of the prevalence estimates over this time period (1993–2001) were also estimated, and tested against zero using likelihood ratio tests. Significant (P < 0.05) between-college variance in the intercepts (or predicted prevalence rates in 1993) and the prevalence trends (especially in the quadratic acceleration effects of time) was found when considering any NMPD in the past year. Figure 1 illustrates the between-college variance in the estimated trends for the outcome measuring prevalence of any NMPD in the past 12 months, for an approximately 10% random sample (n = 13) of the 119 colleges.
Figure 1.
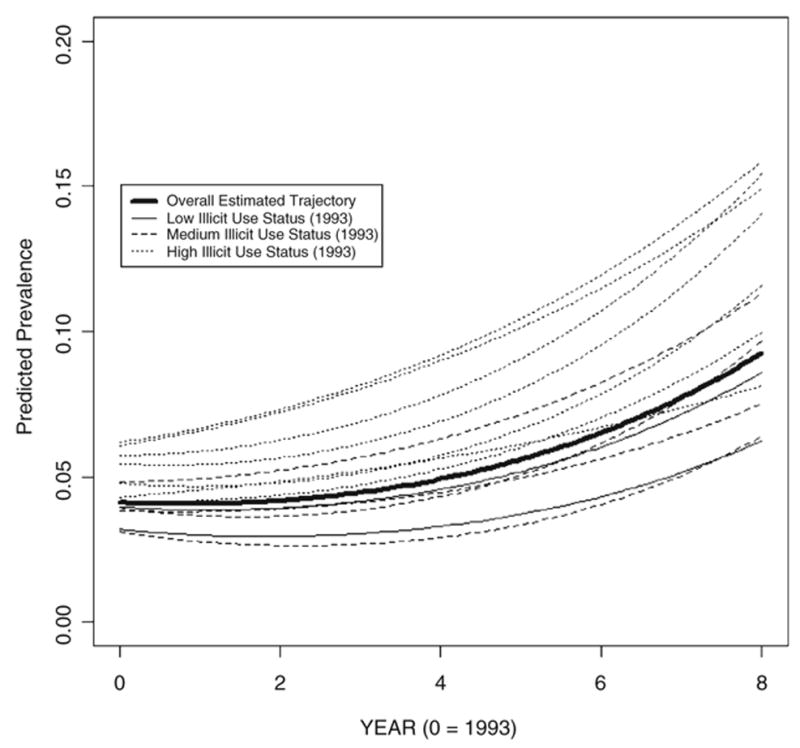
Predicted trends in past-year NMPD use prevalence rates for a 10% random sample (n = 13) of the 119 colleges, with trends for the sampled colleges labeled by illicit drug use status in 1993
The estimated trends in prevalence rates for this random sample of colleges are presented in contrast to the overall expected trend for all 119 colleges (shown as bold type in Fig. 1), and indicate the amount of variance between colleges around the overall expected trend. The individual trends for this sample of colleges are fairly similar to the overall expected trend in terms of direction and shape, and indicate the accelerating increase in expected prevalence that is common to all colleges in the sample. Although the expected trends are similar, Fig. 1 indicates substantial variance in the intercepts (or expected prevalence rates in 1993) for this sample of colleges. The college-level factors that were associated significantly with any NMPD in any study year were found in the HLM analyses to explain an estimated 58.4% of the between-college variance in the intercepts and 22.8% and 16.1% of the between-college variance in the linear and quadratic effects of time, respectively, to the point where the latter two variance components were no longer significant at the 5% level. Specifically, illicit drug use status classification in 1993 was found to have a marginally significant (P < 0.10) impact on both the intercepts and the time effects. The predicted trends for the sample of colleges in Fig. 1 have therefore been labeled by the illicit drug use status of each college sampled in 1993, and demonstrate how illicit drug use tends to explain variance in the intercepts. Figure 1 shows that the sample of colleges in the highest illicit use category in 1993 tends to have the highest intercepts as well as the highest acceleration in estimated prevalence of any NMPD use over this time period.
DISCUSSION
The findings of the present study indicate that non-medical use of prescription drugs (NMPD) among US college students increased between 1993 and 2001, which reinforces findings from other national studies of adolescents and young adults such as the MTF study [1,2]. However, while we believe that increases occurred in this time period, we also recognize that the increases (observed in 2001) could be attributed to the updates made to the prescription drug items in 2001. Furthermore, the prevalence estimates of any NMPD in the present study should be viewed as conservative because our indicator of any NMPD did not include prescription amphetamines. For example, the inclusion of life-time non-medical use of prescription amphetamines in computing the life-time indicator of any NMPD increased the prevalence estimate for this outcome in 1999 (see Table 1) from 12.69% (SE = 0.54) to 15.55% (SE = 0.59).
The college-level results found in the present study have several important implications for guiding prevention and intervention efforts, because certain college-level characteristics were associated with increased or decreased risk of NMPD. Most notably, colleges with the highest rates of marijuana use and other illicit drug use calculated in 1993 had the highest rate of NMPD in every study year between 1993 and 2001. To date, only a limited number of studies have examined college-level associations between prevalence rates across illicit drug classes. For example, previous cross-sectional work has shown that a college’s aggregate rate of annual non-medical use of prescription opioids and prescription benzodiazepine anxiolytics were each correlated strongly with the college’s aggregate rate of annual use of marijuana and other illicit drug use [4,27]. Collectively, the findings from the present study along with previous findings suggest that high rates of illicit drug use may cluster together at the college level, similar to how illicit drug use has been shown to cluster together at the individual level [28]. This suggests that college prevention and intervention efforts geared towards reducing marijuana and other illicit drug use should also include multi-faceted efforts to reduce NMPD simultaneously. HBCU generally had a relatively low risk for NMPD in 1993, 1999 and 2001. In contrast, non-commuter colleges had higher rates of NMPD than commuter colleges in 1997, 1999 and 2001. These findings suggest that prevention and policy efforts to reduce NMPD should be especially considered at non-HBCU and non-commuter schools.
The present work also utilized HLMs to estimate trends in the prevalence of NMPD for the 119 colleges considered in this study, and to estimate the amount of between-college variance that exists in the trends. The initial HLM analyses revealed increasing trends in any NMPD prevalence across the time period under consideration, and significant between-college variance in terms of the prevalence trends. An exploratory HLM analysis considering the college-level factors found to be associated with any NMPD use in any of the study years found that these factors may help to partially explain variation in the estimated trends. Specifically, illicit drug use status in 1993 may have explained higher levels of NMPD use during this time period (Fig. 1). These findings indicate significant increasing trends in the prevalence of NMPD use on a national level, and should be used to motivate future research into additional college-level predictors that may explain additional between-college variance in the prevalence trends.
The prescribing patterns for several classes of abusable prescription drugs, such as stimulants, sedatives/ anxiolytics, sleeping medications and opioid analgesics, have increased over the past decade in the United States [29–33]. One possible consequence of the increased availability of abusable medications is an increase in non-medical use. Due to the increase of NMPD among US college students in the past decade [1], the recent trends in prescribing patterns and non-medical use of prescription drugs serves as an important reminder of the continuing need to monitor the medical and non-medical use behaviors based on the high abuse potential of these prescription medications [31,34,35].
Strengths, limitations and implications for future research
The present study has several strengths that build upon previous investigations which examined prescription drug abuse among college students. First, the present study featured a large nationally representative sample of the same 119 US colleges across 4 study years, which allowed for an examination over time of the stability in associations of college-level characteristics with NMPD. Secondly, the present study extended beyond one class of prescription drugs and focused on several classes of abusable prescription drugs. Finally, the present study utilized hierarchical linear models to assess between-college variation in prevalence trends over time.
The present investigation also has some limitations that need to be taken into account when considering the implications of the study. First, as the present investigation represented secondary analyses, the survey items in the original questionnaires limited the scope of what could be examined. Most notably, the updates to the prescription drug categories in 2001 may have contributed to the increase in prevalence estimates of NMPD in 2001. Changes in wording in longitudinal studies always represent a challenge to tracking behaviors over time, and the updates in the 2001 question undeniably make it more difficult to interpret the trends. However, similar changes were made to prescription drug categories in other national studies (e.g. MTF), and on balance the creating of questions that embrace ‘current’ sensibilities may be more important than keeping obsolete wording. Furthermore, survey items did not specify the quantity of prescription drug that was used on each occasion, consequences, motives or route of administration. Secondly, student-level inference about trends in NMPD over this time period was not possible, as the study data were cross-sectional in nature, and data were not collected from the same students over time. Thirdly, the CAS data are subject to the potential bias of substance use data collected via self-report surveys. The CAS attempted to minimize the bias associated with self-report surveys by utilizing certain conditions that past research has shown improves the validity and reliability of substance use data collected via self-report surveys, such as informing potential respondents that participation was voluntary, ensuring potential respondents that data would remain anonymous and explaining the relevance of the study to potential respondents [14,36,37].
Fourthly, the investigators acknowledge that the response rates were low at some colleges, resulting in small samples in some cases; these respondents are considered representative of all students at these colleges. For example, findings regarding HBCU should be interpreted cautiously due to the limited number of students sampled from these types of institutions. We attempted to minimize this limitation by using sampling weights incorporating the demographic-specific response rates at the colleges to ensure that the respondents were representative of all students at the college. Furthermore, the present study is intended to identify national trends and correlates of NMPD. The present study is not intended to examine correlates associated with the NMPD at individual colleges or universities. Therefore, individual colleges and universities are encouraged to collect their own data in order to learn more about the trends and correlates on their respective campuses.
Fifthly, several college-level characteristics were found to be associated significantly with each other in the different study years. For example, marijuana use classifications and illicit drug use classifications in 1993 were associated significantly with each other (χ2(4) = 61.03, P < 0.001). This has important implications for the hierarchical linear modeling approach considered in this paper, where several college-level predictors were considered simultaneously in the model. Future applications of HLM techniques intended to analyze the specific effects of college-level predictors on prevalence trends should focus carefully on the associations of the predictors considered in the models to prevent any possible problems associated with multi-collinearity that may undermine the individual effects of the predictors. For example, when considering marijuana use status and illicit drug use status in 1993 in the same model, illicit drug use status had only a marginally significant impact (P < 0.10) on the college-specific intercepts. When removing marijuana use status from the model, the impact of illicit drug use status on the intercepts was significant (P < 0.01).
Finally, similar to many college-based studies, the response rates have declined in the CAS since the initial 1993 survey. The individual sampling weights in the CAS data sets were calculated in an attempt to offset these differences in response rates, and all analyses in this paper incorporated these sampling weights. In addition, several procedures were used to examine potential bias introduced by non-response. For instance, we examined the correlation between response rate and non-medical use of each class of prescription drugs, and no significant association was found. College-level Pearson correlation coefficients indicating the associations between response rate and past-year NMPD over the 4 surveys were calculated and tested, and there were no significant associations (P < 0.05). Further, sensitivity analyses focused only on those schools with response rates higher than the median response rate for the 119 schools in each study year indicated that the vast majority of the findings presented in Table 2 did not change substantially. Finally, despite the 2001 changes within lists of specific prescription drugs, the estimated rates of NMPD over time were similar to results from other national studies of US college students [1].
After consideration of the strengths and limitations in the present study, there are several implications for future research. First, future work should consider drawing large enough samples from individual colleges to enable examination of individual-level and college-level factors associated with less prevalent behaviors such as NMPD while accounting for correlation between dependent measures within the same college. Secondly, based on the increase in NMPD found in the present study, future investigations should collect additional measures to allow for a more in-depth examination of NMPD. For example, future investigations should include an assessment of medically prescribed use of prescription drugs in order to establish the relationship between college-level prescription rates and NMPD as well as examine how many students may have misused their own medication. Finally, future research could build on the hierarchical linear models that have been estimated in this study, and attempt to determine additional college-level factors that may explain the significant between-college variation in the prevalence trajectories over time that was observed. Additional outcomes aside from any NMPD use in the past year could also be analyzed using the HLM methodology considered in this paper.
Acknowledgments
The College Alcohol Study data were collected under research grants from the Robert Wood Johnson Foundation (PI: Henry Wechsler). The development of this manuscript was supported by a research grant DA019492 (PI: Sean Esteban McCabe) from the National Institute on Drug Abuse, National Institutes of Health.
References
- 1.Johnston LD, O’Malley PM, Bachman JG, Schulenberg JE. College Students and Adults Ages 19–45. II. Bethesda, MD: US Department of Health and Human Services; 2004. Monitoring the Future National Survey Results on Drug Use, 1975–2003. NIH Publication 04–5508. [Google Scholar]
- 2.Substance Abuse and Mental Health Services Administration. The Dawn Report. Rockville, MD: Office of Applied Studies; 2004; [accessed 10 August 2004]. Oxycodone, Hydrocodone, and Polydrug Use, 2002. Available at: http://oas.samhsa.gov/2k4/oxycodone/oxycodone.cfm. [Google Scholar]
- 3.Babcock Q, Byrne T. Student perceptions of methylphenidate abuse at a public liberal arts college. J Am Coll Health. 2000;49:143–5. doi: 10.1080/07448480009596296. [DOI] [PubMed] [Google Scholar]
- 4.McCabe SE, Teter CJ, Boyd CJ, Knight JR, Wechsler H. Non-medical use of prescription opioids among US college students: prevalence and correlates from a national survey. Addict Behav. 2005;30:789–805. doi: 10.1016/j.addbeh.2004.08.024. [DOI] [PubMed] [Google Scholar]
- 5.McCabe SE, Knight JR, Teter CJ, Wechsler H. Non-medical use of prescription stimulants among US college students: prevalence and correlates from a national survey. Addiction. 2005;100:96–106. doi: 10.1111/j.1360-0443.2005.00944.x. [DOI] [PubMed] [Google Scholar]
- 6.Teter CJ, McCabe SE, Boyd CJ, Guthrie SK. Illicit methylphenidate use in an undergraduate student sample: prevalence and risk factors. Pharmacotherapy. 2003;23:609–17. doi: 10.1592/phco.23.5.609.34187. [DOI] [PubMed] [Google Scholar]
- 7.Wechsler H, Davenport A, Dowdall G, Moeykens B, Castillo S. Health and behavioral consequences of binge drinking in college: a national survey of students at 140 campuses. JAMA. 1994;272:1672–7. [PubMed] [Google Scholar]
- 8.Wechsler H, Dowdall GW, Maenner G, Gledhill-Hoyt J, Lee H. Changes in binge drinking and related problems among American college students between 1993 and 1997. J Am Coll Health. 1998;47:57–68. doi: 10.1080/07448489809595621. [DOI] [PubMed] [Google Scholar]
- 9.Wechsler H, Lee JE, Kuo M, Lee H. College binge drinking in the 1990s: a continuing problem. Results of the Harvard School of Public Health 1999 College Alcohol Study. J Am Coll Health. 2000;48:199–210. doi: 10.1080/07448480009599305. [DOI] [PubMed] [Google Scholar]
- 10.Wechsler H, Lee JE, Kuo M, Seibring M, Nelson T, Lee H. Trends in college binge drinking during a period of increased prevention efforts: findings from 4 Harvard School of Public Health College Alcohol Study surveys: 1993–2001. J Am Coll Health. 2002;50:203–22. doi: 10.1080/07448480209595713. [DOI] [PubMed] [Google Scholar]
- 11.US Department of Education. Fall Enrollment in Postsecondary Institutions, 1997. Washington, DC: National Center for Education Statistics; 1999. [(accessed 25 January 2002)]. Available at: http://nces.edsgov/pubs2000/2000160.pdf. [Google Scholar]
- 12.US Department of Education. Enrollment in Postsecondary Institutions, Fall 2001 and Financial Statistics, Fiscal Year 2001. Washington, DC: National Center for Education Statistics; 2003. [(accessed 10 February 2004)]. Available at: http://nces.edsgov/pubs2004/2004155.pdf. [Google Scholar]
- 13.Mohler-Kuo M, Lee JE, Wechsler H. Trends in marijuana and other illicit drug use among college students: results from 4 Harvard School of Public Health College Alcohol Study surveys: 1993–2001. J Am Coll Health. 2003;52:17–24. doi: 10.1080/07448480309595719. [DOI] [PubMed] [Google Scholar]
- 14.Johnston LD, O’Malley PM. Issues of validity and population coverage in student surveys of drug use. NIDA Res Monogr. 1985;57:31–54. [PubMed] [Google Scholar]
- 15.O’Malley PM, Bachman JG, Johnston LD. Reliability and consistency in self-reports of drug use. Int J Addict. 1983;18:805–24. doi: 10.3109/10826088309033049. [DOI] [PubMed] [Google Scholar]
- 16.Gledhill-Hoyt J, Lee H, Strote J, Wechsler H. Increased use of marijuana and other illicit drugs at US colleges in the 1990s: results of three national surveys. Addiction. 2000;95 :1655–7. doi: 10.1046/j.1360-0443.2000.951116556.x. [DOI] [PubMed] [Google Scholar]
- 17.Kuo M, Wechsler H, Greenberg P, Lee H. The marketing of alcohol to college students: the role of low prices and special promotions. Am J Prev Med. 2003;25:204–11. doi: 10.1016/s0749-3797(03)00200-9. [DOI] [PubMed] [Google Scholar]
- 18.SAS Institute. SAS, version 9.1. Cary, NC: SAS Institute Inc.; 2005. [Google Scholar]
- 19.Rust K. Variance estimation for complex estimators in sample surveys. J Official Stat. 1985;1:381–97. [Google Scholar]
- 20.Altman DG, Bland JM. Interaction revisited: the difference between two estimates. BMJ. 2003;326:219. doi: 10.1136/bmj.326.7382.219. [DOI] [PMC free article] [PubMed] [Google Scholar]
- 21.Holland BS, Copenhaver MD. Improved Bonferroni-type multiple testing procedures. Psychol Bull. 1988;104:145–9. [Google Scholar]
- 22.Cochran WG. Sampling Techniques. New York: John Wiley & Sons; 1977. [Google Scholar]
- 23.Rao JNK, Scott AJ. On chi-squared tests for multi-way tables with cell proportions estimated from survey data. Ann Stat. 1984;12:46–60. [Google Scholar]
- 24.Raudenbush SW, Bryk AS. Hierarchical Linear Models. Thousand Oaks, CA: Sage Publications; 2002. [Google Scholar]
- 25.Verbeke G, Molenberghs G. Linear Mixed Models for Longitudinal Data. New York: Springer; 2000. [Google Scholar]
- 26.Stram DO, Lee JW. Variance components testing in the longitudinal mixed effects model. Biometrics. 1994;50:1171–7. [PubMed] [Google Scholar]
- 27.McCabe SE. Correlates of non-medical use of prescription benzodiazepine anxiolytics: results from a national survey of U.S. college students. Drug Alcohol Depend. 2005;79:53–62. doi: 10.1016/j.drugalcdep.2004.12.006. [DOI] [PMC free article] [PubMed] [Google Scholar]
- 28.Biglan A, Brennan PA, Foster SL, Holder HD. Helping Adolescents at Risk: Prevention of Multiple Problem Behaviors. New York: Guilford Press; 2004. [Google Scholar]
- 29.Joranson DE, Ryan KM, Gilson AM, Dahl JL. Trends in medical use and abuse of opioid analgesics. JAMA. 2000;283:1710–14. doi: 10.1001/jama.283.13.1710. [DOI] [PubMed] [Google Scholar]
- 30.Olfson M, Gameroff MJ, Marcus SC, Jensen PS. National trends in the treatment of attention deficit hyperactivity disorder. Am J Psychiatry. 2003;160:1071–7. doi: 10.1176/appi.ajp.160.6.1071. [DOI] [PubMed] [Google Scholar]
- 31.Pincus HA, Tanielian TL, Marcus SC, Olfson M, Zarin DA, Thompson J, et al. Prescribing trends in psychotropic medications: primary care, psychiatry, and other medical specialties. JAMA. 1998;279:526–31. doi: 10.1001/jama.279.7.526. [DOI] [PubMed] [Google Scholar]
- 32.Zacny J, Bigelow G, Compton P, Foley K, Iguchi M, Sannerud C. College on Problems of Drug Dependence taskforce on prescription opioid non-medical use and abuse: position statement. Drug Alcohol Depend. 2003;69:215–32. doi: 10.1016/s0376-8716(03)00003-6. [DOI] [PubMed] [Google Scholar]
- 33.Zito JM, Safer DJ, DosReis S, Gardner JF, Magder L, Soeken K, et al. Psychotropic practice patterns for youth: a 10-year perspective. Arch Pediatr Adolesc Med. 2003;157:17–25. doi: 10.1001/archpedi.157.1.17. [DOI] [PubMed] [Google Scholar]
- 34.Griffiths RR, Weerts EM. Benzodiazepine self-administration in humans and laboratory animals—implications for problems of long-term use and abuse. Psychopharmacology. 1997;134:1–37. doi: 10.1007/s002130050422. [DOI] [PubMed] [Google Scholar]
- 35.Kollins SH, MacDonald EK, Rush CR. Assessing the abuse potential of methylphenidate in nonhuman and human subjects: a review. Pharmacol Biochem Behav. 2001;68 :611–27. doi: 10.1016/s0091-3057(01)00464-6. [DOI] [PubMed] [Google Scholar]
- 36.Harrison L, Hughes A. The Validity of Self-Reported Drug Use: Improving the Accuracy of Survey Estimates. Washington, DC: Government Printing Office; 1997. NIH Publication 97–4147. NIDA Research Monograph no. 167. [PubMed] [Google Scholar]
- 37.O’Malley PM, Johnston LD. Epidemiology of alcohol and other drug use among American college students. J Stud Alcohol. 2002;(Suppl 14):23–39. doi: 10.15288/jsas.2002.s14.23. [DOI] [PubMed] [Google Scholar]