Abstract
Cutaneous T-cell lymphomas (CTCLs) are characterized by the recruitment of malignant T-cell clones, predominantly of the CD4+ T-helper subpopulation, into the skin. Mycosis fungoides (MF) is the most common type of CTCL and accounts for almost 50% of all primary cutaneous lymphomas. The ProteinChip technology surface-enhanced laser desorption/ionization time of flight/mass spectrometry (SELDI-TOF-MS) was used to detect biomarkers in sera from MF patients (n = 25) and healthy controls (n = 26). Therefore, diluted sera were applied to IMAC30 ProteinChip arrays, and the resulting protein profiles were bioinformatically analyzed. A protein set that distinguishes MF patients from healthy controls with a sensitivity of 82.6% and a specificity of 100% was identified. Four significant peaks were identified by two-dimensional gel electrophoresis, immunodepletion, and SELDI-TOF-MS as transthyretin (TTR) and three TTR modifications. A subsequent enzyme-linked immunosorbent assay confirmed these findings. The ability to detect and identify proteins and protein modifications using SELDI-TOF-MS might reveal a better insight on this kind of disease and may lead to a better understanding and earlier detection of MF patients.
Keywords: ProteinChip arrays, SELDI, mycosis fungoides (MF), transthyretin, transthyretin modifications
Introduction
Primary cutaneous T-cell lymphoma (CTCL) comprises a heterogeneous group of non-Hodgkin's lymphomas involving memory Tcells, predominantly of the CD4+ T-helper subpopulation, which preferentially migrate into the skin. CTCL represents the most common primary cutaneous lymphoma (65%), whereas mycosis fungoides (MF) represents the most common disease (50% of all primary cutaneous lymphomas), followed by primary cutaneous CD30+ lymphoproliferative disorders (accounting for approximately 30%, including primary cutaneous anaplastic large cell lymphoma) and the leukemic variant Se'zary syndrome (with about 3%) [1]. The MF type starts mostly in middle adulthood and has an incidence of 0.4/100,000 individuals/year in the United States [2], with increasing ratio. Although treatable in its early stages, MF is frequently misdiagnosed because of its similarities to more benign forms of skin diseases. About 25% of MF patients with extensive patches or plaques will develop progressive disease. The leukemic variant Se'zary syndrome is the more aggressive form, with a mean survival of 3 years from the time of diagnosis and is characterized by the presence of circulating lymphocytes of cerebriform nuclei (Se'zary cells) in the peripheral blood, lymph nodes, or skin [3,4]. The etiology of MF is still unknown, but some viral infections such as human T-lymphotropic virus type I [5] or Epstein-Barr virus [6] are proposed.
To date, only a few biomarker candidates have been identified for this disease. Next to neopterin [7], β2-microglobulin and soluble IL-2 receptor [8] have been described as possible candidate markers that are elevated in CTCL patients. The studies of Hamerlinck et al. reveal an overexpression of neopterin in the later stage of MF (except Se'zary syndrome), whereas Hassel et al. described neopterin to be significantly elevated only in Sézary syndrome patients. Increased levels of neopterin [9,10], β2-microglobulin [11,12], or soluble IL-2 receptor [13,14] can be observed in many other malignant diseases and are not specific to CTCL. Therefore, it is very important to identify biomarkers that are specific for CTCL patients and easy to detect.
It has been shown that cDNA microarrays [15] and the ProteinChip technology surface-enhanced laser desorption/ionization time of flight/mass spectrometry (SELDI-TOF-MS) [16] are appropriate tools used to distinguish between MF patients and control persons. Biomarker discovery with the SELDI-TOF-MS technique is described both in body fluids such as urine, blood, or serum and in microdissected tissues and cell subfractions of blood [16–18].
In previous studies, we have described our fractionation strategy using magnetic cell sorting (MACS) for CD4+ and CD4- lymphocyte preparations to determine differentially expressed proteins in MF patients and healthy controls. In the course of these studies, we revealed HNP3 as a biomarker candidate for CTCL patients that separates CD4+ and CD4- lymphocytes from healthy controls [16]. The aim of the current study was the detection of possible biomarkers in the sera of MF patients, using SELDI-TOF-MS, because analysis of body fluids is fast and easy to perform. For our investigation, we examined 25 MF patients vs 26 healthy controls using IMAC30 ProteinChip arrays.Wethereby found transthyretin (TTR) and its modifications to be diminished in the sera of MF patients compared to those of healthy controls. We have also been able to detect a peak with a molecular mass of about 8590 Da in sera, which was found to be decreased in our previous fractionation studies.
Materials and Methods
Serum Samples
Twenty-five MF serum samples were obtained from the Department of Dermatology of the Friedrich-Schiller- University (Jena, Germany). The patients were between pT1N0M0 and pT4pN3cM0 (stages Ia-IV). As controls, we used 26 serum probes from healthy donors. All serum samples were extracted, separated, and stored (-80°C) under the same protocol before use.
ProteinChip Array
The application of IMAC30 ProteinChip array (Ciphergen, Fremont, CA) was performed according to the manufacturer's instructions. In short, 5 µl of 0.1 M Ni-sulfate was applied twice to the spots and washed away with water. Five microliters of binding buffer (0.5 M NaCl) was incubated for 5 minutes. The serum was diluted in binding buffer, and 3 ml (1.5 mg/ml) was applied to 3 ml of binding buffer on the ProteinChip. Toward incubation for 90 minutes, the spots were washed thrice with binding buffer, followed by washing with water twice. Finally, 0.5 µl of sinapinic acid was added twice, and the arrays were analyzed with a ProteinChip Reader (series 4000; Ciphergen).
Bioinformatic Analysis of ProteinChip Array Data
The resulting protein profiles between 2 and 20 kDa were subjected to CiphergenExpress Client 3.0 software and a cluster-based and rule-based data mining algorithm (XLminer 3.0; BioControl Jena GmbH, Jena, Germany). CE software was used for the processing of raw spectra and the calculation of P values and cluster plots according to the manufacturer's instructions. The data analysis algorithm underlying the XLminer software consists of three steps: a clustering step, a rule-extraction and rating step, and a rule-base construction step, as described elsewhere [19]. The latter two of these steps are supervised with respect to the given sample classification (CTCL versus unaffected). Log2-transformed and normalized data were clustered in an unsupervised mode into two clusters (“low expressed” and “high expressed”) for each peak using a modified fuzzy C-means algorithm. Using the assignment of each sample to these two states (low and high) as the condition part and the classification outcome (CTCL and unaffected) as the conclusion part, rules are generated in the rule-extraction step and rated by a statistically based rule-rating measure introduced by Kiendl and Krabs [20]. Finally, a small subset of rules from the rule list is assembled to form a rule base that can be used for the automatic classification of new patient samples. To classify a new patient sample, the cluster memberships (condition part of the rules) of all rules from the rule base that point to the same classification outcome (conclusion part of the rules) are added, and the sample is assigned to the class (classification outcome) with the highest vote.
Identification of Proteins
To identify the protein with a molecular mass of 13,746 Da that separates MF patients from healthy persons, we performed two-dimensional gel electrophoresis (2-DE) with both normal and MF sera. In short, 40 µl of serum was precipitated in 60 µl of 20% trifluoroacetic acid (TFA) and 50% acetonitrile (ACN) for 2 hours at -20°C, followed by a 30-minute step at 4°C. After centrifugation (15,000 rpm, 15 minutes, 4°C), protein pellets were washed twice in ice-cold 80% acetone. After centrifugation, the pellets were rehydrated overnight in 2% immobilized pH gradient (IPG) buffer, 0.5% 3-[(3-cholamidopropyl)- dimethylammonio]-1-propane-sulfonate (CHAPS), 0.2% dithiothreitol (DTT), 8 M urea, and 0.002% bromophenol blue. Isoelectric focusing (IEF) was carried out using 11-cm IPG strips and a PROTEAN IEF Cell (Amersham, Piscataway, NJ). The second dimension was performed using a 4% to a 12% gradient gel (Invitrogen, Carlsbad, CA) in a Novex Mini- Cell (Invitrogen). Gel staining was proceeded in Coomassie brilliant blue G-250.
Immunodepletion
About 10 µl of protein A agarose was washed in CoIP buffer containing 20 mM HEPES, 0.1 mM EDTA, and 50 mM KCl. Four microliters of anti-human prealbumin antibody (whole antiserum; Sigma Aldrich, Taufkirchen, Germany) was coupled and incubated at 4°C for 1 hour. After blocking with 3% milk powder, the agarose was washed in CoIP buffer, and 7 µl of 1:50 diluted serum from healthy donors was added. The supernatant was removed and applied to a Nicoated IMAC30 ProteinChip array. The control with IgG antibody was treated in the same way.
TTR Enzyme-Linked Immunosorbent Assay (ELISA)
The human prealbumin ELISA kit (Assaypro, Winfield, MO) was used according to the manufacturer's instructions to detect TTR levels in sera. The serum was diluted 1:8000 in enzyme immunoassay (EIA) diluent, and 50 µl was applied to a 96-well plate and incubated for 2 hours. After washing, 50 µl of biotinylated TTR antibody was added. The supernatant was removed, the well was washed, and 50 µl of streptavidin-peroxidase conjugate was applied. Finally, 50 µl of chromogen substrate was incubated for 10 minutes before adding 50 µl of stop solution. Absorbance was measured immediately with a UVIKON spectrophotometer (Kontron Instruments) at a wavelength of 450 nm.
Results
ProteinChip Profiling
Twenty-five MF patients and 26 unaffected control sera were analyzed with a ProteinChip Reader (series 4000; Ciphergen) on Ni-coated IMAC30 ProteinChips. After measurement and normalization, two MF and two control cases were excluded from further SELDI analyses because the intensities were too low, which means that the normalization coefficient was too high to be included in this study. Hereby, 26 signals differentially expressed with P < .05 in a mass range between 2 and 20 kDa were detected.
Bioinformatic Analysis
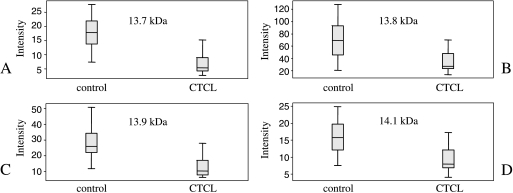
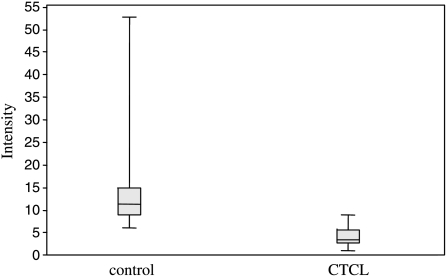
The P values of all detected peaks were calculated by the CiphergenExpress Client 3.0 software. The most differentiating signal between MF and unaffected sera possessed a molecular mass of 8596 Da (P = 1.17 b 10-8). The second specific signal with a molecular mass of 13,746 Da was identified as TTR. The distribution of intensities for both peaks comparing MF patients and controls is shown in Figures 1A and 2. Due to rule extraction, rating, and rule-base construction, the bioinformatic tool XL-miner (Biocontrol) revealed eight signals that, when combined, distinguish very well between MF patients and healthy controls (Table 1). This signature combination of all eight peaks revealed a sensitivity of 82.6% and a specificity of 100%.
Figure 1.
Distribution of the intensity values of (A) the protein peak at 13,746 Da (identified as TTR; P = 2.91 x 10⁻⁷) and TTR modifications. (B) Cysteinylated form of TTR (13,878 Da). (C) CysGly-conjugated TTR (13,921 Da). (D) Glutathionylated form of TTR (14,086 Da).
Figure 2.
Distribution of the intensity values of the protein peak at 8596 Da (P = 1.17 x 10⁻⁸) for MF patients and healthy controls.
Table 1.
Rule Base of the Sera Analyzed by IMAC30 Ni ProteinChips for MF Patients and Normal Controls.
| Condition | Conclusion |
| If expression at the peak is | Then |
| 8,596 Da high (> 3.72) | Normal |
| 13,746 Da high (> 4.08) | Normal |
| 13,878 Da high (> 6.18) | Normal |
| 13,921 Da high (> 4.74) | Normal |
| 6,664 Da high (> 6.04) | MF |
| 8,596 Da low (< 1.54) | MF |
| 13,878 Da low (4.54) | MF |
| 13,921 Da low (< 3.07) | MF |
All expression values are log2-transformed. The specificity of the combined rule base is 100%, and the sensitivity is 82.6% (peaks with molecular masses of 13,746, 13,878, and 13,921 Da were identified as TTR or TTR modifications).
Identification of Differentially Expressed Proteins
To identify the serum proteins differentiating between MF and healthy persons, 2-DE was performed. A number of spots in the lower molecular mass range were cut out from the gel and tryptic-digested. The peptide fingerprints of tryptic digestion generated by SELDI-TOF-MS were analyzed using the Internet database http://www.matrixscience. com/cgi/search_form.pl?FORMVER=2&SEARCH=PMF. Thus, we could identify the protein TTR (P02766; www. expasy.org) with a score of 69 and a sequence coverage of 92%. This result correlated very well to one of the differentially expressed proteins found by IMAC30 Ni ProteinChip profiling (13.746 Da; P = 2.91 b 10-7) using SELDI-TOF-MS. This specific signal was found to be downregulated in MF sera.
Immunodepletion of TTR
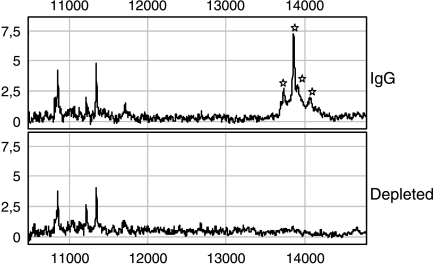
To confirm the affiliation of TTR with the differentially expressed protein with a molecular mass of 13,746 Da, immunodepletion was performed (Figure 3). Next to the peak representing TTR, three other proteins were found depleted. According to Fung et al., two of them stand for TTR modifications. The first one, which has a molecular mass of 13,878 Da (P = 4.80 x 10⁻⁵), is the cysteinylated form; the second one, which has a molecular mass of 14,086 Da (P = 2.75 x 10⁻⁵), is the glutathionylated form. The third peak, which occurred depleted (13,921 Da), was also found to be differentially expressed (P = 2.07 x 10⁻⁶) when comparing MF and healthy control sera. According to Biroccio et al. [21], this signal belongs to the CysGly-conjugated form of TTR.
Figure 3.
Normalized ProteinChip Array profiles of the immunodepletion assay from a serum probe. To confirm the affiliation of TTR with the differentially expressed protein with a molecular mass of 13,746 Da, immunodepletion was performed. An anti-human prealbumin antibody was coupled to protein A agarose and, after serum incubation, the supernatant was loaded on an IMAC30 Ni ProteinChip. Thereby, four proteins were depleted; all of them represent TTR or TTR modifications (13.74 kDa, TTR; 13.87 kDa, cysteinylated TTR; 13.92 kDa, CysGly TTR; 14.08 kDa, glutathionylated TTR). From left to right: 13.74, 13.87, 13.92, and 14.08 kDa.
ELISA
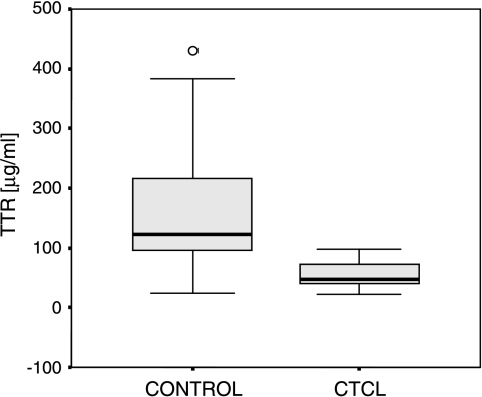
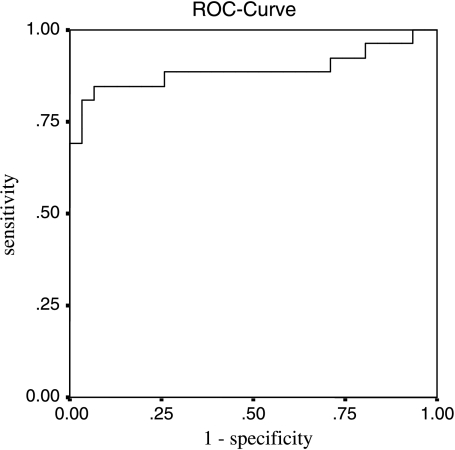
To validate the differential expression of TTR, ELISA was performed on 25 MF and 26 normal serum samples according to the manufacturer's instructions. The determined median concentrations of TTR in the sera from unaffected controls were 122.98 and 46.04 µg/ml for MF patients (Figure 4). Due to Swiss Prot declaration, the normal fluctuation of TTR level in the sera was between 100 and 400 µg/ml. Receiver operating characteristic (ROC) curves were constructed for TTR serum concentrations, resulting in an area under the curve (AUC) of 0.890 (Figure 5). At a cutoff of 90.14 µg/ml, the sensitivity and the specificity were 80.8% (confidence interval = 62.1–91.5%) and 92% (confidence interval = 75–97.8%), respectively.
Figure 4.
Acquired TTR ELISA data are shown in a box plot. The calculated median TTR concentration is 122.98 µg/ml in unaffected controls and 46.04 ag/ml in MF patients.
Figure 5.
The ROC curve was created, and the AUC reveals a value of 0.890. At a cutoff of 90.14 µg/ml, the sensitivity and the specificity are 80.8% (confidence interval = 62.1–91.5%) and 92% (confidence interval = 75–97.8%), respectively.
Discussion
Biomarkers are needed to facilitate the prediction of tumor progression or the early diagnosis of malignant tumors at the genomic or proteomic level. In the past years, only a few biomarker candidates, such as neopterin, soluble IL-2 receptor, or β2-microglobulin, especially in sera, have been published for CTCLs [8,22]. However, these potential markers often lack specificity. Thus, it is important to find more significant and more specific proteins that might separate not only MF from healthy controls but also MF from the more aggressive leukemic Se'zary syndrome variant.
In this study, we performed protein expression profiling using IMAC ProteinChip arrays and the SELDI-TOF-MS technique to compare 25 MF and 26 unaffected control sera. In the present study, we used 2-DE to identify potential biomarkers that might bring forward the stage at which MF is detectable. A few spots were excised from a 2-DE gel, and one of them could be identified as TTR. Immunodepletion confirmed the affiliation of TTR with the signal detected in a prior analysis using SELDI-TOF-MS. Next to TTR, three other signals were depleted. These three signals have been already described as TTR modifications: cysteinylated form (13,878 Da), CysGly form (13,921 Da), and glutathionylated form (14,086 Da) [21,23]. These posttranslational modifications were also found to be differentially expressed in MF patients and healthy controls, with P = 4.80 x 10⁻⁵, P = 2.07 x 10⁻⁶, and P = 2.75 x 10⁻⁵, respectively. The XLminer analysis of SELDI data revealed a sensitivity of 82.6% and a specificity of 100%, including the eight most differentiating peaks (Table 1). A subsequent validation with ELISA confirmed the potential of TTR to differentiate between MF and controls. The sensitivity and the specificity for the TTR as a single marker, using ELISA, were 80.8% and 92%, respectively, at a cutoff of 90.14 µg/ml. Thus, we are the first to describe TTR and its modifications as possible biomarkers for the sera of MF patients. Using this method, we have been able to detect 26 differentially expressed proteins in MF patients with P < .05 in a mass range between 2 and 20 kDa.
TTR is the major carrier of serum thyroxine and triiodothyronine. The transport of retinol (vitamin A) through its interaction with retinol-binding proteins is also facilitated by TTR. This liver-expressed and liver-regulated protein has also been published as a possible biomarker in other diseases such as ovarian cancer [25,27], hepatocellular carcinoma [26], and malnutrition [27].
Whereas Feng et al. and Kozak et al. only described unmodified TTR as a possible biomarker, we have been able to identify TTR itself and three TTR modifications as decreased in MF patients. Comparing our findings to the results of Kozak et al., we observed a difference in the expression of α and β hemoglobin (Hb). In contrast to the increased expression of α-Hb and β-Hb in the early stage of ovarian cancer [25], we could not detect such an overexpression of α-Hb and β-Hb. This differential result can be explained with the increased blood supply of epithelial tumors, such as ovarian or hepatocellular cancer, in contrast to lymphoma. Fung et al. examined TTR in breast, colon, ovarian, and prostate cancers compared to healthy controls. Whereas the truncated form of TTR (12.8 kDa) and unmodified TTR (13.7 kDa) were found to be significantly decreased in colon cancer, all forms of TTR (truncated, unmodified, cysteinylated, and glutathionylated) were downregulated in ovarian cancer. Comparing these findings to our results, the unmodified, cysteinylated, and glutathionylated TTR forms were also significantly downregulated in MF patients.
The results of ovarian cancer studies differed from ours on three points [24,25]. First, we could not detect the truncated form of TTR (12.8 kDa). Second, both α-Hb and β-Hb were not increased in our studies. Third, we found CysGly TTR modification to be also downregulated in MF patients. It might be possible that TTR and its modifications are specific for MF patients and may reveal a biomarker that is easy and fast to detect.
Next to TTR, we have found a signal with a 8596-Da molecular mass that was significantly decreased in MF patients. In previous studies, we have shown a protein (8565 Da) that was downregulated in MF patients on CD4+ lymphocyte MACS fractionation. To date, we do not know whether it is the same protein because the identification process is still in progress.
In summary, the combination of these techniques might not be exclusively used to detect and identify differentially expressed proteins as serum biomarkers in MF patients [24,25,28]. In further studies, it might lead to the separation of the early and late stages of MF, or to the separation of MF and the more benign forms of CTCL.
Acknowledgement
We would like to thank Kerstin Junker for supplying the TTR antibody.
Footnotes
This work was supported by a grant from the German Federal Ministry of Education and Research and the Interdisciplinary Center for Clinical Research (Jena, Germany).
References
- 1.Willemze R, Jaffe ES, Burg G, Cerroni L, Berti E, Swerdlow SH, Ralfkiaer E, Chimenti S, Diaz-Perez JL, Duncan LM, et al. WHO-EORTC classification for cutaneous lymphomas. Blood. 2005;105:3768–3785. doi: 10.1182/blood-2004-09-3502. [DOI] [PubMed] [Google Scholar]
- 2.Koh HK, Charif M, Weinstock MA. Epidemiology and clinical manifestations of cutaneous T-cell lymphoma. Hematol Oncol Clin North Am. 1995;9:943–960. [PubMed] [Google Scholar]
- 3.Kari L, Loboda A, Nebozhyn M, Rook AH, Vonderheid EC, Nichols C, Virok D, Chang C, Horng WH, Johnston J, et al. Classification and prediction of survival in patients with the leukemic phase of cutaneous T cell lymphoma. J Exp Med. 2003;197:1477–1488. doi: 10.1084/jem.20021726. [DOI] [PMC free article] [PubMed] [Google Scholar]
- 4.Kim YH, Bishop K, Varghese A, Hoppe RT. Prognostic factors in erythrodermic mycosis fungoides and the Sezary syndrome. Arch Dermatol. 1995;131:1003–1008. [PubMed] [Google Scholar]
- 5.Sakamoto FH, Colleoni GW, Teixeira SP, Yamamoto M, Michalany NS, Almeida FA, Chiba AK, Petri V, Fernandes MA, Pombo-de-Oliveira MS. Cutaneous T-cell lymphoma with HTLV-I infection: clinical overlap with adult T cell leukemia/lymphoma. Int J Dermatol. 2006;45:447–449. doi: 10.1111/j.1365-4632.2006.02687.x. [DOI] [PubMed] [Google Scholar]
- 6.Knol AC, Guilloux Y, Quereux G, Marques-Briand S, Pandolfino MC, Khammari A, Dreno B. CD8(+) T lymphocytes reactive against Epstein-Barr virus antigens in skin lesions of a patient with Sezary syndrome. J Am Acad Dermatol. 2005;53:897–900. doi: 10.1016/j.jaad.2005.07.044. [DOI] [PubMed] [Google Scholar]
- 7.Hamerlinck FF, Toonstra J, van Vloten WA. Increased serum neopterin levels in mycosis fungoides and Sezary syndrome. Br J Dermatol. 1999;141:1136–1137. doi: 10.1046/j.1365-2133.1999.03221.x. [DOI] [PubMed] [Google Scholar]
- 8.Hassel JC, Meier R, Joller-Jemelka H, Burg G, Dummer R. Serological immunomarkers in cutaneous T cell lymphoma. Dermatology. 2004;209:296–300. doi: 10.1159/000080852. [DOI] [PubMed] [Google Scholar]
- 9.Bichler A, Fuchs D, Hausen A, Hetzel H, Reibnegger G, Wachter H. Measurement of urinary neopterin in normal pregnant and nonpregnant women and in women with benign and malignant genital tract neoplasms. Arch Gynecol. 1983;233:121–130. doi: 10.1007/BF02114788. [DOI] [PubMed] [Google Scholar]
- 10.Hetzel H, Bichler A, Fuchs D, Hausen A, Reibnegger G, Wachter H. Significance of urinary neopterin in gynecological oncology: followup of patients with ovarian cancer. Cancer Detect Prev. 1983;6:263–266. [PubMed] [Google Scholar]
- 11.Oetting WS, Rogers TB, Krick TP, Matas AJ, Ibrahim HN. Urinary beta2-microglobulin is associated with acute renal allograft rejection. Am J Kidney Dis. 2006;47:898–904. doi: 10.1053/j.ajkd.2006.01.034. [DOI] [PubMed] [Google Scholar]
- 12.Ryu OH, Atkinson JC, Hoehn GT, Illei GG, Hart TC. Identification of parotid salivary biomarkers in Sjogren's syndrome by surfaceenhanced laser desorption/ionization time-of-flight mass spectrometry and two-dimensional difference gel electrophoresis. Rheumatology (Oxford) 2006;45:1077–1086. doi: 10.1093/rheumatology/kei212. [DOI] [PubMed] [Google Scholar]
- 13.Xiao P, Chen QF, Yang YL, Guo ZH, Chen H. Serum soluble interleukin-2 receptor levels in patients with chronic hepatitis B virus infection and its relation with anti-HBc. World J Gastroenterol. 2006;12:482–484. doi: 10.3748/wjg.v12.i3.482. [DOI] [PMC free article] [PubMed] [Google Scholar]
- 14.Wadwa RP, Kinney GL, Ogden L, Snell-Bergeon JK, Maahs DM, Cornell E, Tracy RP, Rewers M. Soluble interleukin-2 receptor as a marker for progression of coronary artery calcification in type 1 diabetes. Int J Biochem Cell Biol. 2006;38:996–1003. doi: 10.1016/j.biocel.2005.09.015. [DOI] [PubMed] [Google Scholar]
- 15.Tracey L, Villuendas R, Dotor AM, Spiteri I, Ortiz P, Garcia JF, Peralto JL, Lawler M, Piris MA. Mycosis fungoides shows concurrent deregulation of multiple genes involved in the TNF signaling pathway: an expression profile study. Blood. 2003;102:1042–1050. doi: 10.1182/blood-2002-11-3574. [DOI] [PubMed] [Google Scholar]
- 16.Escher N, Spies-Weisshart B, Kaatz M, Melle C, Bleul A, Driesch D, Wollina U, von Eggeling F. Identification of HNP3 as a tumour marker in CD4+ and CD4- lymphocytes of patients with cutaneous T-cell lymphoma. Eur J Cancer. 2006;42:249–255. doi: 10.1016/j.ejca.2005.07.033. [DOI] [PubMed] [Google Scholar]
- 17.von Eggeling F, Davies H, Lomas L, Fiedler W, Junker K, Claussen U, Ernst G. Tissue-specific microdissection coupled with ProteinChip array technologies: applications in cancer research. Biotechniques. 2000;29:1066–1070. doi: 10.2144/00295rr02. [DOI] [PubMed] [Google Scholar]
- 18.Melle C, Ernst G, Schimmel B, Bleul A, Koscielny S, Wiesner A, Bogumil R, Moller U, Osterloh D, Halbhuber KJ, et al. Biomarker discovery and identification in laser microdissected head and neck squamous cell carcinoma with ProteinChip(R) technology, two-dimensional gel electrophoresis, tandem mass spectrometry, and immunohistochemistry. Mol Cell Proteomics. 2003;2:443–452. doi: 10.1074/mcp.M300033-MCP200. [DOI] [PubMed] [Google Scholar]
- 19.Busch A, Michel S, Hoppe C, Driesch D, Claussen U, Von EF. Proteome analysis of maternal serum samples for trisomy 21 pregnancies using ProteinChip arrays and bioinformatics. J Histochem Cytochem. 2005;53:341–343. doi: 10.1369/jhc.4B6377.2005. [DOI] [PubMed] [Google Scholar]
- 20.Kiendl H, Krabs M. Ein Verfahren zur Generierung regelbasierter Modelle fu" r dynamische Systeme. Automatisierungstechnik. 1989;37:423–430. [Google Scholar]
- 21.Biroccio A, Del Boccio P, Panella M, Bernardini S, Di Ilio C, Gambi D, Stanzione P, Sacchetta P, Bernardi G, Martorana A, et al. Differential post-translational modifications of transthyretin in Alzheimer's disease: a study of the cerebral spinal fluid. Proteomics. 2006;6:2305–2313. doi: 10.1002/pmic.200500285. [DOI] [PubMed] [Google Scholar]
- 22.Kagami S, Sugaya M, Minatani Y, Ohmatsu H, Kakinuma T, Fujita H, Tamaki K. Elevated serum CTACK/CCL27 levels in CTCL. J Invest Dermatol. 2006;126:1189–1191. doi: 10.1038/sj.jid.5700246. [DOI] [PubMed] [Google Scholar]
- 23.Fung ET, Yip TT, Lomas L, Wang Z, Yip C, Meng XY, Lin S, Zhang F, Zhang Z, Chan DW, et al. Classification of cancer types by measuring variants of host response proteins using SELDI serum assays. Int J Cancer. 2005;115:783–789. doi: 10.1002/ijc.20928. [DOI] [PubMed] [Google Scholar]
- 24.Zhang Z, Bast RC, Jr, Yu Y, Li J, Sokoll LJ, Rai AJ, Rosenzweig JM, Cameron B, Wang YY, Meng XY, et al. Three biomarkers identified from serum proteomic analysis for the detection of early stage ovarian cancer. Cancer Res. 2004;64:5882–5890. doi: 10.1158/0008-5472.CAN-04-0746. [DOI] [PubMed] [Google Scholar]
- 25.Kozak KR, Su F, Whitelegge JP, Faull K, Reddy S, Farias-Eisner R. Characterization of serum biomarkers for detection of early stage ovarian cancer. Proteomics. 2005;5:4589–4596. doi: 10.1002/pmic.200500093. [DOI] [PubMed] [Google Scholar]
- 26.Feng JT, Liu YK, Song HY, Dai Z, Qin LX, Almofti MR, Fang CY, Lu HJ, Yang PY, Tang ZY. Heat-shock protein 27: a potential biomarker for hepatocellular carcinoma identified by serum proteome analysis. Proteomics. 2005;5:4581–4588. doi: 10.1002/pmic.200401309. [DOI] [PubMed] [Google Scholar]
- 27.Marten NW, Sladek FM, Straus DS. Effect of dietary protein restriction on liver transcription factors. Biochem J. 1996;317(Pt 2):361–370. doi: 10.1042/bj3170361. [DOI] [PMC free article] [PubMed] [Google Scholar]
- 28.Sudeepa B, Bhattacharyya S, Siegel ER, Petersen GM, Chari ST, Suva LJ, Haun RS. Diagnosis of pancreatic cancer using serum proteomic profiling. Neoplasia. 2004;6:674–686. doi: 10.1593/neo.04262. [DOI] [PMC free article] [PubMed] [Google Scholar]


