

Abstract
Effective pulmonary gas exchange relies on the free diffusion of gases across the thin tissue barrier separating airspace from the capillary red blood cells (RBCs). Pulmonary pathologies, such as inflammation, fibrosis, and edema, which cause an increased blood–gas barrier thickness, impair the efficiency of this exchange. However, definitive assessment of such gas-exchange abnormalities is challenging, because no methods currently exist to directly image the gas transfer process. Here we exploit the solubility and chemical shift of 129Xe, the magnetic resonance signal of which has been enhanced by 105 with hyperpolarization, to differentially image its transfer from the airspaces into the tissue barrier spaces and RBCs in the gas exchange regions of the lung. Based on a simple diffusion model, we estimate that this MR imaging method for measuring 129Xe alveolar-capillary transfer is sensitive to changes in blood–gas barrier thickness of ≈5 μm. We validate the successful separation of tissue barrier and RBC images and show the utility of this method in a rat model of pulmonary fibrosis where 129Xe replenishment of the RBCs is severely impaired in regions of lung injury.
Keywords: diffusing capacity, fibrosis, gas exchange, blood–gas barrier
The exchange of gases in the lung requires ventilation, perfusion, and the diffusion of gases across the blood–gas barrier of the alveoli. Although pulmonary ventilation (1, 2) and perfusion (3, 4) can be examined by a variety of imaging techniques, currently no methods exist to image alveolar-capillary gas transfer. Yet certain pulmonary pathologies such as inflammation, fibrosis, and edema may initially have a predominant effect on the gas exchange process but not on ventilation or perfusion. The degree to which such “diffusion block” (5) is present or absent is difficult to determine (6). In healthy alveoli, the harmonic mean thickness [as defined by Weibel (7)] of the blood–gas barrier is 0.77 μm and oxygen traverses this space in less than 1 ms, saturating the red blood cells (RBCs) in tens of milliseconds. However, in regions where the barrier is thickened, oxygen cannot diffuse across it fast enough to saturate the RBCs before they exit the gas exchange region [750 ms in humans (5), 300 ms in rats (8)]. A method to noninvasively and directly image alveolar-capillary gas transfer could be very useful to both diagnose and study interstitial lung diseases.
Three properties make 129Xe uniquely suited for MRI of pulmonary gas exchange. First, xenon is soluble in the pulmonary tissue barrier and RBC compartments. Second, 129Xe resonates at three distinct frequencies in the airspace, tissue barrier, and RBC compartments. Third, the 129Xe magnetic resonance signals can be enhanced ≈105 times by hyperpolarization (9) making it possible to image this gas at resolutions approaching proton MRI. When 129Xe is inhaled and enters the alveolar airspaces, a small fraction is absorbed by the moist epithelial surface. The atoms diffuse across the tissue barrier and their concentration in the RBCs in the capillaries equilibrates with that in the airspace. The atoms continue to exchange among all three compartments before those in the RBCs and plasma are carried away by circulation. 129Xe in the alveolar epithelium, interstitium, capillary endothelium, and plasma resonates at a frequency 197 ppm (4.64 kHz at 2 T) from the gas reference frequency at 0 ppm (10). Because these tissues lie between the airspace and RBCs, we refer to this compartment as the “barrier” resonance. As 129Xe leaves the barrier and reaches the RBCs, its frequency shifts to 211 ppm from the gas frequency (11); we refer to this as the “RBC” resonance. Collectively, we refer to the 197- and 211-ppm signals as the “dissolved phase,” consistent with published literature (8, 12). Fig. 1A shows schematically the airspace, pulmonary endothelium, interstitial space, capillary endothelium, plasma, and RBCs along with the associated 129Xe resonance frequencies.
Fig. 1.

1D model of gas transfer and signal replenishment in the barrier tissue and RBCs. (A) Simplified depiction of the alveolar capillary unit and corresponding 129Xe NMR resonance frequencies in airspace, barrier, and RBCs. (B) Replenishing of the 129Xe magnetization profile across the entire tissue block including barrier (green) and RBC (red). (C) Replenishing of the barrier signal (197 ppm) for barrier thicknesses ranging from 1–7.5 μm, assuming DXe = 0.33 × 10⁻⁵ cm2 · s−1. (D) Replenishing of the RBC signal (211 ppm) for the same range of barrier thickness and constant capillary diameter of 8 μm. As barrier thickness increases, return of the RBC signal is delayed.
Ruppert et al. (12) first used dynamic spectroscopy to observe the replenishment of 129Xe signal in the barrier and RBC compartments of the lung after magnetization therein was destroyed by a frequency-selective radio rf pulse (12). Unlike conventional proton MRI, once the hyperpolarized (HP) noble gas atoms are depolarized, thermal repolarization by the static magnetic field is negligible and thus as probes, become silent. The dissolved phase signals are only replenished by fresh airspace 129Xe magnetization diffusing back into these compartments; this occurs in ≈30–40 ms in a healthy lung. Such replenishment of dissolved magnetization is depicted in Fig. 1B. Mansson et al. (8) used this spectroscopic technique to show that the time constants for the barrier and RBC signal replenishment were significantly increased in rat lungs exposed to the inflammatory agent, lipopolysaccharide. Recently, Abdeen et al. (13) used similar methods to observe reduced gas transfer in lung inflammation induced by Stachybotrys chartarum instillation.
The aspect of 129Xe gas exchange that should be most sensitive to blood–gas barrier health status, however, is the time it takes 129Xe to reach the RBCs. To exhibit the RBC resonance, 129Xe must first traverse the tissue barrier separating RBCs from the airspace, thus delaying the RBC signal appearance. The time constant for 129Xe diffusion across the tissue barrier can be estimated as τ ≈ ΔLdb2/2D, where ΔLdb is the barrier thickness, and D is the Xe diffusion coefficient. In a healthy subject with a tissue barrier thickness of ≈1 μm, and D ≈ 0.33 × 10⁻⁵·cm2 s−1 (14), 129Xe transit takes only 1.5 ms. This delay is short compared with MR imaging repetition rates (TR) of 5–10 ms and therefore is difficult to observe. However, because diffusing time scales as the square of the barrier size, a thickness increase to 5 μm would delay the appearance of the RBC resonance by 40 ms, a time scale more easily probed.
A detailed 1D model of the 129Xe replenishment dynamics with increasing blood–gas barrier thickness is available in Supporting Text, which is published as supporting information on the PNAS web site. Using this model, Fig. 1 C and D illustrate the replenishment of the barrier and RBC signals for slightly increased barrier thicknesses ranging from 1 to 7.5 μm. These replenishment curves assume a capillary diameter of 8 μm, a Xe diffusion coefficient of 0.33 × 10⁻⁵ cm2·s−1 (14), and a hematocrit fraction of 0.5. The delayed replenishment of the RBC resonance with a thickened tissue barrier is apparent in Fig. 1D. By contrast, the barrier replenishment depicted in Fig. 1C is not drastically affected, although the signal amplitude of the thicker barrier is larger due to increased tissue volume.
Because the predicted RBC replenishment delay is a spatially localized phenomenon in injured lungs, the effect has not been observed in the whole-lung 129Xe dynamic spectroscopy studies performed to date (8, 13). Adjacent regions of healthy lung would always contribute rapid RBC signal replenishment to the spectrum, thus obscuring RBC delay. RBC replenishment delay can only be observed by imaging the 129Xe replenishment in tissue barrier and RBC at sufficient resolution to differentiate regions of barrier thickening from healthy lung.
Imaging 129Xe in the dissolved phase in the lung is significantly more challenging than imaging 129Xe in the airspaces. First, the lung tissue volume is only ≈10% that of the airspace volume (15) and further, the solubility of Xe in lung tissues is only ≈10% (16, 17), leading to dissolved phase signals that are no more than 1% of the airspace signal. Second, once 129Xe is dissolved in the lung tissue, the transverse relaxation time T*2 is reduced from 20 ms to ≈2 ms, requiring the use of submillisecond echo times and higher bandwidth. Third, is the need to separately image 129Xe in the three different frequency compartments to elucidate the exchange dynamics.
To date, only Swanson et al. (18) have directly imaged 129Xe in the dissolved phase of the lung by using chemical-shift imaging. Their use of a 30° flip angle and a repetition time of 428 ms ensured that 129Xe signal was grossly localized to the thorax but not specifically to the gas-exchange regions of the lung. An alternate imaging method that retains higher spatial resolution while indirectly probing the gas-exchange process is called xenon polarization transfer contrast (XTC). This method uses the attenuation of airspace 129Xe signal after rf irradiation of the dissolved phase 129Xe frequencies to indirectly map 129Xe gas exchange between airspace and dissolved phase (19). XTC has been shown to be sensitive to increases in tissue density resulting from atelectasis, for example (14), but does not distinguish the 129Xe signal originating from the barrier and RBC compartments.
In this paper, we present a method for efficient differential imaging of 129Xe in the airspace, barrier and RBC compartments of the lung with 16-fold higher resolution than was previously attained (18). Furthermore, by confining imaging to the gas-exchange regions of the lung and separating out barrier and RBC compartments, we gain specific sensitivity to pulmonary gas transfer. We validate the differential imaging of RBC and barrier compartments using a rat model of pulmonary fibrosis. We refer to this method as xenon alveolar capillary transfer imaging or XACT.
Method Overview
129Xe Imaging.
The dissolved 129Xe was imaged by using radial encoding (20, 21) to overcome its short T2*. To differentiate 129Xe in the barrier and RBC compartments, we use a variant of the Dixon technique originally developed to separate fat and water MR images (22). Dixon imaging exploits the slight difference in the transverse-plane precession frequency of two resonances to image them at a predicted phase shift. We image dissolved-phase 129Xe replenishment by using a frequency-selective pulse that excites both the 197- and 211-ppm resonances but not the gas-phase resonance at 0 ppm. Once in the transverse plane, the 211-ppm magnetization processes 330 Hz faster (at 2 T) than the 197-ppm resonance. We allow this phase evolution to occur just long enough for the 211-ppm spins to accumulate 90° of phase relative to the 197-ppm spins. Then the imaging gradients are turned on to encode the image. The scanner-receiver phase is set so that the 211-ppm resonance contributes to the in-phase image and the 197-ppm to the out-of-phase image (23).
Experimental Protocol.
Experiments were performed by using Fischer 344 rats weighing 170–200 g (Charles River Breeding Laboratories, Raleigh NC). Our imaging protocol consisted of a high-resolution, (0.31 × 0.31-mm2) ventilation image, a phase-sensitive barrier/RBC replenishment image (1.25 × 1.25 mm2), and dynamic 129Xe spectroscopy. We used nine animals, seven with unilateral fibrosis induced by bleomycin instillation, one healthy control, and one sham instillation with saline. Animals were imaged 5–15 days after treatment, when a thickened tissue barrier was present in the treated animals.
Results
Fig. 2 shows images of 129Xe in the airspaces, tissue barrier, and RBC in a left lung sham-instilled rat (#2) and a rat with left-lung fibrosis (#5) imaged 11 days postbleomycin instillation. Most notable is the nearly complete absence of 129Xe RBC replenishment in the injured left lung (Fig. 2F), whereas barrier replenishment appears closely matched to the airspace image. The close match of barrier image area with airspace image area was noted in all studies. The mismatching of RBC image area with barrier area was a hallmark finding in all injured lungs. Absence of RBC replenishment is consistent with thickening of the tissue barrier to >5 μm. Note also that the area of the left fibrotic lung is reduced on the airspace image (Fig. 2D), whereas the right lung exhibits increased area due to compensatory hyperinflation, a finding noted in all seven bleomycin-treated animals.
Fig. 2.

Comparison of 129Xe images in sham left-lung instilled animal no. 2 (A–C) vs. injured animal no. 5 with left-lung fibrosis 11 days postinstillation (D–F). (A) Airspace image in sham B. Barrier image in sham. (C) RBC image in sham. (D) Airspace image in injured animal E. Barrier image in injured animal F. RBC image in injured animal. Most notable is the nearly complete absence of 129Xe-RBC intensity in the injured left lung of the diseased animal (F), indicating that 129Xe does not reach the RBCs on the 50-ms image acquisition time scale, likely resulting from increased diffusion barrier thickness. However, note that the barrier images (B and E) closely match the corresponding airspace images (A and D).
Fig. 3 shows H&E-stained sections from a control left lung of rat #8 and the bleomycin-instilled left lung of rat #5 shown in Fig. 2. Thickened alveolar septa are clearly visible in the treated compared with the control lung. Areas of septal thickening and increased collagen deposition were observed throughout the injured lung of this rat and were representative of injured lungs of all bleomycin-treated rats. The histological findings and RBC/barrier mismatch found in the images are summarized in Table 2, which is published as supporting information on the PNAS web site.
Fig. 3.

H&E-stained histology. (A) Control left lung from right-lung instilled animal no. 8. (B) Damaged left lung from bleomycin-instilled animal no. 5. This specimen showed clear thickening of the alveolar septa compared with the control lung, which could reasonably explain the observed reduction in 129Xe replenishment in the RBC compartments. Such thickening was seen throughout the treated lung in this and all other treated animals.
In Fig. 4, we plot the barrier and RBC pixel counts against the airspace pixel counts for the right and left lungs of all animals. Barrier pixel counts closely matched the airspace pixel counts in both control and injured lungs with a slope of 0.88 ± 0.02 (R2 = 0.93), represented by the regression line. The less-than-unity slope is a result of counting the extrapulmonary airways in the airspace image and the smaller average lung volume during dissolved phase imaging, which was performed over the entire breathing cycle, vs. airspace imaging, which was performed at held breath after full inspiration. The matching is consistent with the tissue-barrier compartment being immediately adjacent to the airspace compartment. By contrast, the RBC pixel counts in injured lungs correlated poorly with airspace counts (R2 = 0.14). RBC pixel counts in control lungs correlated well with the airspace counts (R2 = 0.83). Two animals with right lung injury (#7 and #9) showed no measurable RBC/barrier mismatch. In these animals, it appears bleomycin instillation obstructed ventilation to the injured lung region, preventing 129Xe from reaching it.
Fig. 4.

Ratio of normalized 129Xe pixel count in barrier and RBC images vs. pixel count in the airspace images in each lung. Pixel counts were separated by right and left lung to take into account reduced lung volume in injured lungs and to allow one lung to serve as a control. A strong correlation (R2 = 0.93) is seen between barrier and airspace pixel counts, as would be expected, because they are directly adjacent. The regression line is a fit to all of the barrier pixel counts in injured and uninjured lungs. In injured lungs, the RBC pixel count fell well below the regression line in five of seven lungs, whereas in control lungs, the RBC pixel count fell on the regression line.
Representative data acquired by dynamic spectroscopy are illustrated in Fig. 5, which compares spectra from a control rat and from a rat 5 days after right-lung injury. Although the shapes of the replenishment curves were indistinguishable between the healthy and treated rats, the ratio of saturation RBC signal to barrier signal was dramatically different. The control animal showed an RBC/barrier = 0.92 vs. the injured animal with RBC/barrier = 0.57. Thus, the RBC/barrier ratio derived from spectroscopy performed on short replenishment timescales (0–200 ms) may be sensitive to alveolar-capillary gas transfer, although it lacks the spatial specificity of imaging.
Fig. 5.

Dynamic spectroscopy of 129Xe replenishment into the barrier and RBC compartments covering the entire lung of both a healthy control (no. 1) and right-lung-injured (no. 9) rat, 5 days postinstillation. (A) Dynamic spectra in control animal. (B) Fit of barrier and RBC signal replenishment in control animal. (C) Dynamic spectra in injured rat. (D) Fit of barrier and RBC signal replenishment in injured rat. Note that the ratio of RBC/barrier signal at saturation is markedly diminished in the injured animal (D) vs. the control animal (B).
A hallmark feature of the XACT technique is that regions showing barrier signal, but no RBC signal (RBC/barrier mismatch), corresponded to regions of barrier thickening found on histology. Thus, RBC/barrier ratios represent a simple and useful means of quantifying and comparing degrees of injury from the images. Table 1 summarizes the RBC/barrier ratios derived from imaging and spectroscopy in all of the animals studied. The image-derived RBC/barrier ratio in injured lungs of 0.59 ± 0.24 was significantly reduced (P = 0.002) compared to the 0.95 ± 0.10 ratio in control lungs. The spectroscopy-derived RBC/barrier ratio was 0.69 ± 0.12 in treated animals was also significantly reduced from the RBC/barrier ratio of 0.87 ± 0.14 (P = 0.02) determined from five healthy control rats (not shown). We postulate that there should be correspondence between the RBC/barrier ratios derived from the images and spectra in a given animal, because spectra simply represent a collapse of the phase-sensitive image into its spectral components. Close correspondence was observed in seven of the nine rats studied with the exception of the two rats, previously discussed, whose ventilation was blocked in regions of injury (#7 and #9). In these animals, the whole lung image-derived RBC/barrier ratio appeared normal, whereas the spectroscopy-derived ratio was markedly reduced. This discrepancy is not fully understood but could be a result of spectroscopy being performed at full inspiration when capillary blood volume would be reduced in injured areas.
Table 1.
RBC/barrier ratios from imaging and spectroscopy
| Animal/status |
RBC/barrier ratio |
||||
|---|---|---|---|---|---|
| ID | Injury/days | Injured lung | Control lung | Whole | Spectra |
| 1 | Control | NA | 0.95 | 0.96 | 0.92 |
| 2 | LL 15 Sham | 0.88 | 0.94 | 0.92 | 0.84 |
| 3 | LL 15 | 0.51 | 0.88 | 0.70 | 0.81 |
| 4 | LL 13 | 0.55 | 1.02 | 0.85 | 0.78 |
| 5 | LL11 | 0.45 | 1.06 | 0.83 | 0.83 |
| 6 | LL 8 | 0.25 | 0.85 | 0.65 | 0.67 |
| 7 | RL 15 | 0.89 | 1.01 | 0.95 | 0.69 |
| 8 | RL 7 | 0.56 | 0.80 | 0.71 | 0.51 |
| 9 | RL 5 | 0.93 | 1.03 | 0.99 | 0.57 |
Discussion
An important assumption about our imaging method is that the barrier/RBC images represent dissolved-phase 129Xe and are not a product of airspace 129Xe signal contamination. Three pieces of evidence bolster this case. First, the gas-phase signal is nearly 5 kHz away from the barrier/RBC resonances where the scanner is tuned. In radial imaging, such off-resonant artifacts manifest themselves as a halo around the primary image (20), and no such halo is observed. Second, we note the absence of the major extrapulmonary airways from the dissolved-phase images. Their presence would indicate a signal from the gas. Their absence verifies that Xe gas is not significantly absorbed by these conducting airways (19). Third, when lung tissue density, xenon solubility, and image acquisition parameters are taken into consideration, the dissolved-phase image resolution (1.25 × 1.25 mm2) and signal-to-noise ratio (6.8 ± 2) achieved are exactly as expected given the achievable airspace image resolution (0.31 × 0.31 mm2) and SNR (9.1 ± 2).
Another issue in interpreting the data is the degree to which the tissue barrier and RBC compartments have been completely separated in the images. The most compelling evidence for this separation is the clearly reduced 129Xe RBC signal in the injured lungs compared with the presence of RBC signal in control and sham-treated animals, an observation entirely consistent with predictions of the diffusion model. Meanwhile, the area of barrier compartment images always closely matched the area of airspace images, as expected given that these compartments are directly adjacent in the alveoli. However, we cannot rule out some residual overlap of the RBC/barrier signal in the images. The XACT method assumes that all phase differences are purely due to chemical shift differences from 129Xe in barrier vs. RBC compartments. However, imperfect magnetic field homogeneity across the image would also cause phase shifts that could confound the method. For example, we do not observe significant RBC image intensity in the right accessory lobe of the uninjured lungs (see Fig. 2C). 129Xe in this lobe may experience a slight reduction in magnetic field due to its proximity to the heart. This would cause the phase of the RBC signal to be retarded toward the barrier signal and the phase of the barrier signal to be retarded such that it subtracts from the RBC signal. These undesired phase shifts could be corrected using a phase-sensitive image of the airspace to map the field distortions. Because the airspace image results from a single resonance, any observed phase fluctuations are attributable only to magnetic field inhomogeneity.
A third consideration is whether the reduced RBC signals could result from shortened 129Xe relaxation times T1, T2, or T*2 postinjury rather than the proposed tissue barrier thickening. To cause the observed reduction in RBC signal would require a T1 relaxation time on the order of 50 ms. Although in vivo 129Xe relaxation times <4 sec have not been reported in the literature, such rapid relaxation could be caused by either a dramatically increased concentration of paramagnetic centers or reduced 129Xe mobility in regions of injury. If by some means an excess of free radicals occurred in regions of injury, this would likely depolarize 129Xe in both the tissue-barrier and RBC compartments, resulting in matched signal reduction. 129Xe binding to increased collagen deposits associated with fibrosis could also result in reduced 129Xe mobility and thus could reduce both T1 and T2, which would diminish the signal in the barrier compartment, not the vascular RBC compartment, opposite from our observations. Thus, although increased relaxation in regions of injury should be considered, it cannot explain our results.
Next, we should consider whether the RBC/barrier mismatch observation could be partially caused by reduced capillary density or blood volume rather than increased diffusion barrier thickness. We cannot definitively exclude a contribution from capillary destruction based on our data. Stained sections do show areas of lung that are so severely injured as to be fully consolidated, lacking alveoli, airways, and capillaries, and thus would not contribute any 129Xe signal. Other areas of injured lung clearly have intact alveoli with thickened alveolar septa and also have capillaries and RBCs (see Fig. 3). Although it is possible that a reduction of blood volume in the injured lung may contribute to the reduced RBC signal, the overriding factor appears to be the diffusional delay due to thickened alveolar septa.
A final issue is how the information derived from the XACT technique presented here compares to existing HP gas MRI methods that indirectly image gas exchange. For example, apparent diffusion coefficient (ADC) imaging (24, 25) of HP gases in the airspaces is inversely proportional to gas-exchanging surface to volume ratio, making it sensitive to alveolar microstructure breakdown in emphysema, for example. Recently, Ward et al. (26) observed a 25% reduction in ADC in a rat model of radiation fibrosis, presumably due to encroachment of the thickened tissue barrier on the alveolar airspace (26). By contrast, micrometer-scale thickening of alveolar septa is enough to completely extinguish the RBC image intensity on XACT. Similarly, we expect XACT to be more sensitive than XTC imaging (14, 19), which was developed to measure tissue thickness. Because the size of the XTC effect is proportional to total tissue volume, micrometer-scale thickening might increase the XTC effect by only tens of a percent. Thus, although both ADC and XTC imaging provide indirect measurements of gas exchange at higher resolution, XACT derives its sensitivity to micrometer-scale structural changes from the ability directly image and distinguish 129Xe in RBC vs. tissue-barrier compartments.
Conclusions
We have described a method for imaging 129Xe in the lung's airspace, dissolved in its tissue barrier and in its RBCs. By separately imaging 129Xe in these three compartments, we are able to image alveolar-capillary gas transfer, the fundamental role of the lung. We have performed initial validation of the XACT technique by showing an absence of 129Xe replenishment in RBCs in regions of injury, a result that is consistent with theoretical expectations based on delayed diffusion transfer of 129Xe from the alveoli. A simple method of quantifying gas-transfer efficiency is proposed by using the ratio of RBC/barrier pixel counts. With minor modifications, this technique could be translated to the clinical setting to image gas-exchange impairment in patients and to evaluate the efficacy of therapeutic regimens.
Experimental Procedures
Animal Preparation, Bleomycin Instillation.
The animal protocol was approved by the Institutional Animal Care and Use Committee at Duke University Medical Center. Interstitial fibrosis was induced by unilateral instillation of bleomycin (27). Rats were anesthetized with 46 mg/kg methohexital (Brevital, Monarch Pharma, Bristol, TN) and perorally intubated with an 18G catheter (Sherwood Medical, Tullamore, Ireland) while positioned supine on a 45° slant board. A curved PE50 catheter was advanced through the endotracheal tube and manipulated to enter the chosen (left or right) pulmonary main bronchus. Then a solution of bleomycin (Mayne Pharma, Paramus, NJ) in saline (2.5 units/kg) was slowly instilled over a period of 10 sec. For the smaller left lung, 0.07 ml at 6.8 units/ml was instilled, whereas the right lung received 0.2 ml at 2.5 units/ml bleomycin. Sham instillation was performed similarly by using an equivalent volume of saline.
129Xe Polarization.
129Xe was HP by using continuous flow and cryogenic extraction of 129Xe (28) based on a prototype commercial polarizer (IGI.9600.Xe, Magnetic Imaging Technologies, Durham, NC). Enriched xenon (83% 129Xe, Spectra Gases, Alpha, NJ) was used. A typical batch consisted of 500 ml of Xe gas polarized to 8–9% polarization in 45 min. HP 129Xe was collected in a 1-liter Tedlar bag (Jensen Inert Products, Coral Springs, FL) inside a Plexiglas cylinder. A hose connected the cylinder to a constant-volume HP gas compatible ventilator (29). For spectroscopy studies, ≈150 ml of enriched 129Xe was polarized and diluted with 350 ml of N2.
Animal Preparation, Imaging.
Animals were first anesthetized with i.p. injection of 56 mg/kg ketamine (Ketaset, Wyeth, Madison, NJ) and 2.8 mg/kg diazepam (Abbott Labs, Chicago, IL). During imaging, anesthesia was maintained with periodic injection of ketamine and diazepam at [1/4] the initial dose. Rats were perorally intubated by using a 16-gauge catheter (Sherwood Medical), positioned prone and ventilated at a rate of 60 breaths per min with a tidal volume of ≈2.0 ml. During 129Xe imaging, breathing gas was switched from air to a mixture of 75% HP xenon mixed with 25% O2 to achieve a tidal volume of 2 ml. A breath consisted of 300-ms inhalation, 200-ms breath-hold, and 500 ms for passive exhalation. The ventilator triggered the MRI scanner at the beginning of the breath hold for high-resolution airspace imaging during the breath-hold. Airway pressure and ECG were monitored continuously, and body temperature was controlled by warm air circulating through the bore of the magnet using feedback from a rectal temperature probe.
Airspace 129Xe Imaging Procedure.
Airspace 129Xe images were acquired by using a radial encoding sequence previously described (30). Details of the imaging hardware can be found in Supporting Text. Images were acquired without slice selection, 4-cm field of view, 8-kHz bandwidth, and reconstructed on a 128 × 128 matrix with a Nyquist resolution limit of 0.31 × 0.31 mm2 in plane. K space was filled by using 400 radial projections, 10 views per breath, and TR = 20 ms, thus requiring 40 breaths to complete the image. For each view n in a breath, a variable flip-angle scheme, calculated according to (31), was used to both use the available magnetization most efficiently and to generate images that distinguish the major airways from parenchyma. All imaging and spectroscopy used a truncated-sinc excitation pulse with one central lobe and single side lobes. To avoid contaminating the airspace image with 129Xe signal from the barrier and RBC compartments, we used a total pulse length of 1.2 ms with frequency centered on gas-phase 129Xe (0 ppm).
Dynamic Spectroscopy Procedure.
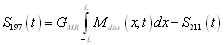
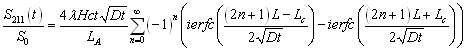
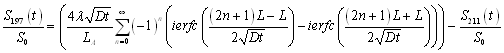
Dynamic spectra measuring 129Xe replenishment of both lungs were acquired with TR values ranging from 11 to 200 ms. We used 90° excitation pulses of 1.05-ms duration centered at 204 ppm to simultaneously read and destroy the 129Xe magnetization in the 197- and 211-ppm compartments. We acquired 256 points per spectrum at a bandwidth of 15 kHz (32-μs dwell time). The bandwidth of the 1.05-ms sinc pulse excited the barrier and RBC resonances with a 90° flip and a 0.15° flip to the airspace 129Xe to provide the 0-ppm reference frequency. Spectra were recorded by using TR values of 11, 15, 20, 30, 40, 50, 75, 100, 125, 150, 175, and 200 ms. For each TR value, the maximum number of spectra was acquired during the 200-ms breath-hold, averaged over five breaths. The first spectrum of each breath-hold period was discarded, because it resulted from 800 ms of replenishment rather than the specified TR period. The raw data for each spectrum were line-broadened (25 Hz), baseline-corrected, Fourier-transformed, and fit by using routines written in the MATLAB environment (MathWorks, Natick, MA). Curve fitting of the real and imaginary spectra before phase correction enabled us to extract the amplitudes, frequencies, line-widths, and phases of each resonance. This information was used to set the receiver frequency and phase to ensure that in subsequent barrier/RBC imaging, the imaginary channel contained the 129Xe-barrier image, and the real channel contained the 129Xe-RBC image. The dynamic replenishment of the dissolved signals vs. TR was fit using the equations described in Supporting Text to extract the saturation amplitudes of the barrier and RBC resonances.
Barrier/RBC 129Xe Replenishment Imaging Procedure.
Nonslice-selective 129Xe images of the barrier and RBC compartments were acquired by using 2D radial projection encoding with a TR of 50 ms, a 90° flip angle, a field of view of 8 cm, and a grid of 64 × 64 for a Nyquist resolution limit of 1.25 × 1.25 mm2. The combination of a 90° flip angle and a TR of 50 ms made the images sensitive to tissue barrier thickening of ≈5 μm. A 1.2-ms sinc pulse centered on the 211-ppm RBC resonance was used to excite only the 197- and 211-ppm resonances and not the airspace 129Xe. This minimum pulse duration yielding no detectable 0-ppm signal was determined by using phantoms containing only gas-phase HP 129Xe. An imaging bandwidth of 15 kHz ensured that radial encoding lasted 2 ms, similar to T*2 decay. K space was overfilled by using 2,400 frames acquired throughout the ventilation cycle to maximize signal averaging from the barrier/RBC compartments. Thus, the dissolved phase image required 120 breaths (2 min) to acquire. To discriminate the 197- and 211-ppm resonance, the echo time was calculated according to TE90 = 1/4Δf. At 2 T, we calculate TE90 = 755 μs for the 211-ppm RBC and 197-ppm barrier resonances. Empirically, however, we determined TE90 by using whole-lung spectroscopy and found that the optimal value was closer to 860–940 μs, varying slightly in each animal. The slight discrepancy between calculated and empirical echo times is not fully understood but might be due to the long duration of the rf pulse, compartmental exchange of 129Xe during the rf pulse, or field inhomogeneity over the entire lung.
Histology.
After imaging, rats were killed with a lethal dose of pentobarbital (Nembutal, Abbott Labs). Lungs were instilled in situ with 10% formalin at 25-cm H2O for 30 min, extracted, and then immersed in 10% formalin. The lungs were processed for conventional histology and stained with H&E and Masson's Trichrome for collagen. Slides were evaluated for signs of fibrosis (thickened alveolar septa and deposition of collagen). We also qualitatively compared the locations and extent of the injury on MR images with corresponding areas on the histology slides to confirm the presence of injured and normal lung. A semiquantitative measure of the fraction of each lung lobe exhibiting bleomycin was determined by visual inspection.
Image Analysis.
Images of 129Xe in the airspace, barrier, and RBCs were analyzed by using an automated MATLAB routine to quantify the number of image pixels containing signal. Pixels were considered “on” if they exceeded twice the mean of the background noise. Signal to noise for each image was calculated by dividing the mean value of all of the pixels above threshold with the mean background signal. The unilaterally induced injury made it fruitful to analyze the left and right lungs separately by manually drawing a border between the two lungs of the ventilation image. Because images were 2D, the portion of the right accessory lobe overlapping the left lung was unavoidably counted in the left lung. In each lung, the ratio of signal-containing pixels in RBC and barrier images (RBC/barrier ratio) was taken as the primary measure of gas-transfer efficiency.
Supplementary Material
Acknowledgments
We thank Scott Shofer and the late Tom Raidy for discussions, Sally Gewalt for help with phase-sensitive image reconstruction, Boma Fubara for assistance with histology, and Sally Zimney for help preparing this manuscript. This work was performed at the Duke Center for In Vivo Microscopy, a Biomedical Technology Resource Center supported by the National Institutes of Health/National Center for Research Resources (Grant P41 RR005959) and the National Cancer Institute (Grant R24 CA092656), with additional project support provided by the National Heart, Lung, and Blood Institute (Grant R01 HL055348) and GEMI Fund 2005.
Abbreviations
- RBC
red blood cell
- TR
repetition rate
- XTC
xenon polarization transfer contrast
- XACT
xenon alveolar capillary transfer imaging
- HP
hyperpolarized.
Footnotes
The authors declare no conflict of interest.
References
- 1.Salerno M, Altes TA, Mugler JP, Nakatsu M, Hatabu H, DeLange EE. Eur J Radiol. 2001;40:33–44. doi: 10.1016/s0720-048x(01)00347-3. [DOI] [PubMed] [Google Scholar]
- 2.Moller HE, Chen XJ, Saam B, Hagspiel KD, Johnson GA, Altes TA, de Lange EE, Kauczor HU. Magn Reson Med. 2002;47:1029–1051. doi: 10.1002/mrm.10173. [DOI] [PubMed] [Google Scholar]
- 3.Garg K, Welsh CH, Feyerabend AJ, Subber SW, Russ PD, Johnston RJ, Durham JD, Lynch DA. Radiology. 1998;208:201–208. doi: 10.1148/radiology.208.1.9646814. [DOI] [PubMed] [Google Scholar]
- 4.Hatabu H, Gaa J, Kim D, Li W, Prasad PV, Edelman RR. Magn Reson Med. 1996;36:503–508. doi: 10.1002/mrm.1910360402. [DOI] [PubMed] [Google Scholar]
- 5.West JB. Pulmonary Pathophysiology–The Essentials. Baltimore, MD: Williams & Wilkins; 1995. [Google Scholar]
- 6.Agusti AGN, Roca J, Gea J, Wagner PD, Xaubet A, Rodriguezroisin R. Am Rev Respir Dis. 1991;143:219–225. doi: 10.1164/ajrccm/143.2.219. [DOI] [PubMed] [Google Scholar]
- 7.Weibel ER. The Pathway for Oxygen–Structure and Function in the Mammalian Respiratory System. Cambridge, MA: Harvard Univ Press; 1984. [Google Scholar]
- 8.Mansson S, Wolber J, Driehuys B, Wollmer P, Golman K. Magn Reson Med. 2003;50:1170–1179. doi: 10.1002/mrm.10649. [DOI] [PubMed] [Google Scholar]
- 9.Albert MS, Cates GD, Driehuys B, Happer W, Saam B, Springer CS, Wishnia A. Nature. 1994;370:199–201. doi: 10.1038/370199a0. [DOI] [PubMed] [Google Scholar]
- 10.Sakai K, Bilek AM, Oteiza E, Walsworth RL, Balamore D, Jolesz FA, Albert MS. J Magn Reson Ser B. 1996;111:300–304. doi: 10.1006/jmrb.1996.0098. [DOI] [PubMed] [Google Scholar]
- 11.Albert MS, Balamore D, Kacher DF, Venkatesh AK, Jolesz FA. NMR Biomed. 2000;13:407–414. doi: 10.1002/1099-1492(200011)13:7<407::aid-nbm661>3.0.co;2-1. [DOI] [PubMed] [Google Scholar]
- 12.Ruppert K, Brookeman JR, Hagspiel KD, Driehuys B, Mugler JP. NMR Biomed. 2000;13:220–228. doi: 10.1002/1099-1492(200006)13:4<220::aid-nbm638>3.0.co;2-f. [DOI] [PubMed] [Google Scholar]
- 13.Abdeen N, Cross A, Cron G, White S, Rand T, Miller D, Santyr GE. Magn Reson Med. 2006;56:255–264. doi: 10.1002/mrm.20943. [DOI] [PubMed] [Google Scholar]
- 14.Ruppert K, Mata JF, Brookeman JR, Hagspiel KD, Mugler JP. Magn Reson Med. 2004;51:676–687. doi: 10.1002/mrm.10736. [DOI] [PubMed] [Google Scholar]
- 15.Parent RA. In: Treatise on Pulmonary Toxicology. Parent RA, editor. Vol 1. Boca Raton, FL: CRC Press; 1992. [Google Scholar]
- 16.Kitani K. Scand J Clin Lab Invest. 1972;29:167–172. doi: 10.3109/00365517209081071. [DOI] [PubMed] [Google Scholar]
- 17.Weathersby PK, Homer LD. Undersea Biomed Res. 1980;7:277–296. [PubMed] [Google Scholar]
- 18.Swanson SD, Rosen MS, Coulter KP, Welsh RC, Chupp TE. Magn Reson Med. 1999;42:1137–1145. doi: 10.1002/(sici)1522-2594(199912)42:6<1137::aid-mrm19>3.0.co;2-4. [DOI] [PubMed] [Google Scholar]
- 19.Ruppert K, Brookeman JR, Hagspiel KD, Mugler JP. Magn Reson Med. 2000;44:349–357. doi: 10.1002/1522-2594(200009)44:3<349::aid-mrm2>3.0.co;2-j. [DOI] [PubMed] [Google Scholar]
- 20.Gewalt SL, Glover GH, MacFall JR, Hedlund LW, Johnson GA. Magn Reson Med. 1993;29:99–106. doi: 10.1002/mrm.1910290117. [DOI] [PubMed] [Google Scholar]
- 21.Bergin CJ, Pauly JM, Macovski A. Radiology. 1991;179:777–781. doi: 10.1148/radiology.179.3.2027991. [DOI] [PubMed] [Google Scholar]
- 22.Dixon WT. Radiology. 1984;153:189–194. doi: 10.1148/radiology.153.1.6089263. [DOI] [PubMed] [Google Scholar]
- 23.Bernstein MA, KIng KF, Zhou XJ. Handbook of MRI Pulse Sequences. San Diego, CA: Elsevier Academic; 2004. [Google Scholar]
- 24.Chen XJ, Hedlund LW, Moller HE, Chawla MS, Maronpot RR, Johnson GA. Proc Natl Acad Sci USA. 2000;97:11478–11481. doi: 10.1073/pnas.97.21.11478. [DOI] [PMC free article] [PubMed] [Google Scholar]
- 25.Salerno M, de Lange EE, Altes TA, Truwit JD, Brookeman JR, Mugler JP. Radiology. 2002;222:252–260. doi: 10.1148/radiol.2221001834. [DOI] [PubMed] [Google Scholar]
- 26.Ward ER, Hedlund LW, Kurylo WC, Wheeler CT, Cofer GP, Dewhirst MW, Marks LB, Vujaskovic Z. Int J Radiat Oncol Biol Phys. 2004;58:1562–1569. doi: 10.1016/j.ijrobp.2003.12.010. [DOI] [PubMed] [Google Scholar]
- 27.Thrall RS, McCormick JR, Jack RM, McReynolds RA, Ward PA. Am J Pathol. 1979;95:117–127. [PMC free article] [PubMed] [Google Scholar]
- 28.Driehuys B, Cates GD, Miron E, Sauer K, Walter DK, Happer W. Appl Phys Lett. 1996;69:1668–1670. [Google Scholar]
- 29.Chen BT, Brau AC, Johnson GA. Magn Reson Med. 2003;49:78–88. doi: 10.1002/mrm.10336. [DOI] [PubMed] [Google Scholar]
- 30.Johnson GA, Cates G, Chen XJ, Cofer GP, Driehuys B, Happer W, Hedlund LW, Saam B, Shattuck MD, Swartz J. Magn Reson Med. 1997;38:66–71. doi: 10.1002/mrm.1910380111. [DOI] [PubMed] [Google Scholar]
- 31.Zhao L, Mulkern R, Tseng CH, Williamson D, Patz S, Kraft R, Walsworth RL, Jolesz FA, Albert MS. J Magn Reson B. 1996;113:179–183. [PubMed] [Google Scholar]
Associated Data
This section collects any data citations, data availability statements, or supplementary materials included in this article.