

Abstract
Short echo time proton MR Spectroscopic Imaging (MRSI) suffers from low signal-to-noise ratio (SNR), limiting accuracy to estimate metabolite intensities. A method to coherently sum spectra in a region of interest of the human brain by appropriate peak alignment was developed to yield a mean spectrum with increased SNR. Furthermore, principal component (PC) spectra were calculated to estimate the variance of the mean spectrum. The mean or alternatively the first PC (PC1) spectrum from the same region can be used for quantitation of peak areas of metabolites in the human brain at increased SNR. Monte Carlo simulations showed that both mean and PC1 spectra were more accurate in estimating regional metabolite concentrations than solutions that regress individual spectra against the tissue compositions of MRSI voxels. Back-to-back MRSI studies on 10 healthy volunteers showed that mean spectra markedly improved reliability of brain metabolite measurements, most notably for myo-inositol, as compared to regression methods.
Keywords: spectroscopy, principal component analysis, brain, short TE magnetic resonance spectroscopic imaging, noise reduction
Both single voxel MR spectroscopy (MRS) and MR spectroscopic imaging (MRSI) methods have been used to measure metabolite changes in various neurodegenerative diseases, such as Alzheimer’s disease, epilepsy, and amyotrophic lateral sclerosis (1). While MRSI is more efficient in assessing regional distributions of cerebral metabolites than MRS, it is technically more challenging. When using short echo time (TE) acquisitions, resonances from scalp lipids and residual water can severely contaminate metabolite spectra because of “voxel bleeding.” Using a combination of lipid nulling and k-space extrapolation (2), we previously achieved substantial reduction of lipid contaminations in proton (1H) MRSI spectra for echo times as short as 25 ms. Although we were able to measure regional distribution of N-acetylaspartate (NAA, a marker of neuronal integrity), choline (Cho), and creatine (Cr) containing compounds with high reliability (3), measurements of myo-inositol (mI, a proposed glial marker) (4) were less reliable (3). We attributed the high variability of mI measurements to a combination of a low signal to noise ratio (SNR) of the mI multiplet peaks and baseline fluctuations resulting from the close spectral proximity of mI and water, in addition to instrumental and biologic variability.
To reduce problems from low SNR and baseline fluctuations, we have developed a new approach for data analysis of MRSI. To increase SNR, we averaged spectra from a particular tissue type, e.g., cortical gray matter, within a particular anatomic structure in the brain, e.g., frontal lobe. Aligning the spectral peaks and phasing the data in each individual spectrum before summation maximized the gain in averaged SNR, yielding what we term a regional coherently averaged mean spectrum (RCMS). Under the assumption that baseline fluctuations and instrumental noise are random, an SNR gain of can theoretically be achieved for metabolites using RCMS, where N is the number of averaged spectra.
We previously demonstrated another way to improve SNR and reduce baseline fluctuations by modeling the coherent spectral signal characteristics, such as intensity and frequency, of metabolite resonances via a principal component analysis (PCA) based deformable shape and intensity model (5). Noise reduction with this approach did not lead to spectral line broadening, in contrast to conventional band-limited spectral filtering methods. In this study we explored the use of PCA to assess the spectral alignment and to quantify metabolite signals as an alternative to RCMS. The aims of this study were: (1) to demonstrate accuracy of RCMS and PCA spectral computations for short TE 1H MRSI data, and (2) to compare the reliability of RCMS and PCA with that of linear regression (LR) analysis of 1H MRSI data (6). Monte Carlo simulations were used to determine accuracy of LR, RCMS, and PCA in determining metabolite concentrations. Reliability of RCMS and PCA to measure mI and other metabolites were compared to that of LR from back-to-back 1H MRSI studies on volunteers.
METHODS
Calculation of RCMS
In any given region of interest, for example, the right parietal lobe, a subset of a spectral spatial MRSI data set (5) can be expressed as an (N × L) complex-valued matrix S. The rows of S represent spectra at each spatial location ri with i = 1 . . . N. We write s(ri,ω) to represent a spectrum at a particular spatial location ri. Similarly, columns of S represent spectral images at each frequency j = 1 . . . L; hence, s(r,ωj) represents an image of spectral component ωj. Here r = [x1, y1, z1 . . . xi, yi, zi, . . . xN, yN, zN]T is a vector with 3·N components of all mapped locations in the subset, and ri = [0,0,0 . . . xi,yi,zi . . . 0,0,0]T identifies a particular location within the subset. Similarly, ω = [ω1 . . . ωj . . . ωL] is a vector with L components of the spectral frequencies. At each location, the spectrum can be decomposed into 3 complex components: (1) narrow resonances sM(ri, ω) from brain metabolites; (2) broad resonances sB(ri, ω) from macromolecules and lipids that form the spectral baseline; and (3) independent identically distributed (iid) noise, σ, whose distribution is by definition spatially and spectrally invariant. A spectrum at location ri can thus be represented as:
| [1] |
The calculation of RCMS over S, i.e., , which represents an average over a set of spatial locations, is a 2-step process involving: (1) baseline correction with an estimated , and (2) phase and frequency alignment.
Baseline Correction
can be modeled using wavelet shrinkage technology (7), B-splines, or a priori spectral knowledge (8), and subtracted from s(ri, ω) to yield baseline corrected spectra for each MRSI voxel:
| [2] |
where σ’ is an error term.
Frequency and Phase Alignment
For each MRSI voxel, the local frequency shift due to macroscopic B0 inhomogeneities was calculated by maximizing the cross-correlation between the real component of and an “ideal” spectrum as a function of frequency and phase (9) variation:
| [3] |
where Δωi is the estimated frequency shift at location ri. The “ideal” spectrum consisted of the singlet resonances of NAA, Cr, Cho, and mI, with frequencies at 2.01, 3.01, 3.24, and 3.53 ppm, respectively, using prior knowledge about the spectral pattern obtained by in vitro NMR experiments (10) with a line-broadening of 5 Hz and no zero- or first-order phase. In addition, an automatic phase adjustment was fine-tuned using a parabolic interpolation algorithm by Brent (11) that maximizes the real part of frequency- and phase-corrected spectra.
Finally, an RCMS of a region is computed by averaging the frequency and phase adjusted spectra within this region:
| [4] |
where R represents a region of interest comprising N voxels.
Calculations of Principal Components Spectra
As an alternative to RCMS, the PC spectra were calculated from the same region R. This was accomplished by computing an N × N covariance matrix, Ψ:
| [5] |
where D is a difference matrix of size (N × L) and .
The PCi are obtained from the complex-valued eigenvectors e1 . . . ei . . . eN of the covariance matrix Ψ:
| [6] |
where λi are the eigenvalues and ei the eigenvectors with i = 1 . . . N. The numerical methods used in these calculations were described previously (5). The PCi spectra are then ranked by the magnitude of their associated eigenvalues. The first PC spectrum, PC1, represents the most coherent variation in the MRSI data set, while the last PC-spectrum PCN primarily represents random noise. We used percent component variance of PC1, %λ1:
| [7] |
as an indicator of the effectiveness of the spectral alignment.
Computer Simulations
The accuracy of PC1 and RCMS computations was tested on simulated MRSI data. A raw data set, SM(k,t), was generated according to:
| [8] |
Here, ρ is the relative signal amplitude, and the inverse Fourier transform is calculated with respect to r. Summations are carried out over metabolites M (NAA, Creatine (Cr), Choline (Cho). myo-inositol (mI)) and B = 4 brain tissue types, corresponding to CSF, gray matter, white matter, and scalp (lipids), which were based on the brain model by the International Consortium for Brain Mapping (ICBM) (12). The first term in the exponential function in Eq. [8] represents signal oscillations at frequencies of the metabolites, ωm. For simplicity, only one spectral line was assumed for each metabolite. The second term in the exponential function represents a frequency shift due to spatial encoding gradients. The third term in the exponential function represents a frequency shift Δωr to simulate regional B0 variations in the brain. The fourth term in the exponential function represents signal decays due to Lorentzian, TL, and Gaussian, TG. Lastly, σ is Gaussian noise.
Monte Carlo simulations were carried out to allow variations of Δωr at different SNR. A noiseless MRSI dataset was the gold standard. Spectra from each voxel of the simulated MRSI data, as well as RCMS and PC1 spectra, were fitted using an automated spectral fitting routine to estimate peak areas, ρ, for each metabolite (13). The difference between the fitted peak areas and the gold standard ρ0 was expressed as an error index, , to represent fitting errors.
Human Subjects
Ten healthy volunteers (age range 21 to 78 years, mean age 43.8 ± 18.4) were scanned twice on the same day in separate sessions to determine measurement reliability. Before scanning, all subjects gave written informed consent to be in this study, which was approved by the committees of human research at the University of California and the San Francisco VA Medical Center. Acquisition of MRSI data were performed on a 1.5 T MR scanner (Vision, Siemens Medical Systems, Iselin, NJ, USA) using a multislice sequence with a repetition time TR of 1800 ms, a short spin-echo time of 25 ms, and lipid signal nulling by slice selective inversion recovery (3). Briefly, 3 axial-oblique MRSI slices of 15 mm thickness with a nominal in-plane resolution of (7.5 mm)2 were acquired. To obtain anatomic information and to allow tissue segmentation, a double spin echo sequence and a 3D magnetization-prepared rapid gradient echo (MPRAGE) sequence were used. The double spin-echo data, acquired in the same orientation as the MRSI data, yielded “quasi” 1H- and T2-weighted MR images with TR/TE1/TE2 = 5000/20/80 ms, voxel size = 1.0 × 1.25 × 3.0 mm. The MPRAGE data yielded T1-weighted MR images, with TR/TE/TI = 13.5/7/30 ms, flip angle = 15°, voxel size = 1.0 × 1.0 × 1.4 mm. Processing of the MRSI data included a finite impulse response filter to selectively suppress the residual water signal, as well as selective lipid k-space extrapolation to reduce lipid artifacts (2).
Anatomic MR images were aligned with the MRSI data. The major brain lobes, including frontal, parietal, temporal, and occipital structures, were outlined and a semiautomated method was used to segment images into gray matter (GM), white matter (WM), and CSF. Then, anatomic labels and segmentation were used together to obtain gray matter, white matter, and CSF by brain lobes for each MRSI data set (14). Voxels were included in the analysis if they contained more than 60% brain tissue, and metabolite intensities of each voxel were furthermore normalized to brain tissue content. Tissue content was estimated for each voxel by convolving the tissue-segmented MR images with the discrete Fourier transform of the MRSI spatial response function to emulate the lower spatial resolution of MRSI, including ringing effects (6).
Metabolic concentrations in parietal and frontal lobe GM and WM were calculated using LR, based on individual fitted metabolite areas, as described in (6). As an established method, LR provided a reference for comparisons with the newly developed methods.
Statistics
For measurements of reliability, intraclass correlation coefficients (ICC) were calculated as described in (15) and given by:
| [9] |
where is the variance of metabolite measurements between subjects, is the within-subjects variance from two scans, σ2 represents variability due to noise, and N is the number of subjects. Values of ICC close to unity represent highest reliability, while values of ICC less than 0.5 indicate unreliable measurements. In addition to ICC, coefficients of variation (CoV) were also calculated as a measure of reliability.
RESULTS
Errors in estimating the simulated NAA data as a function of SNR are depicted in Fig. 1, separately for each method. This shows that errors from both RCMS and PC1 are substantially smaller than those from LR over a wide range of SNR. This implies that metabolite estimates based on RCMS and PC1 are considerably more robust than those based on LR.
FIG. 1.
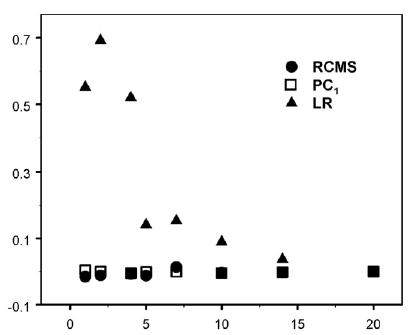
Errors in estimating NAA concentrations of simulated MRSI data by RCMS, PC1, and LR plotted against the SNR.
Figure 2 shows representative mI and NAA images from a 78-year-old healthy volunteer. Spectra from parietal lobe GM of the same volunteer are depicted in Fig. 3. The RCMS (a) and the PC1 spectrum (b) in Fig. 3 were calculated from the same 85 voxels. In (c) is shown the spectrum from a single voxel in that region after baseline correction. Note that the shape of the PC1 spectrum is similar to the RCMS with improved SNR compared to the spectrum from a single voxel. Baseline fluctuations (thick arrows) as seen in the single voxel spectrum are largely diminished in the PC1 and RCMS spectra.
FIG. 2.
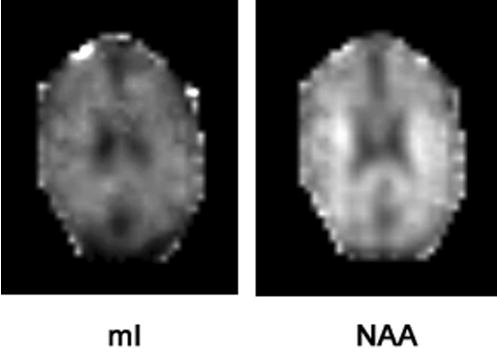
mI (left) and NAA (right) images from a 78-year-old normal elderly.
FIG. 3.
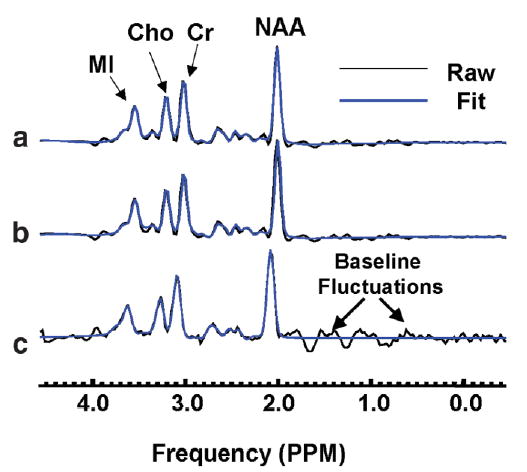
(a) Regional coherently averaged mean spectrum (RCMS) calculated from 85 voxels from parietal lobe gray matter, (b) PC1 spectrum from the same voxels, and (c) a single voxel spectrum in the same area after baseline correction and before alignment. Baseline fluctuations (thick arrows) were largely reduced in both RCMS and PC1 spectra.
Table 1 lists percent component variance %λ1 between the three different methods before and after alignment for the simulated MRSI data. The results show that spectral alignment significantly increases the variance accounted for by PC1 (P < 0.0001, two-sided t test), indicating that coherence among the spectra is improved.
Table 1.
Percent Variance of PC1 Spectra, % λ1, in Regions of Parietal GM, Frontal GM, and WM Before and After Spectral Alignment
| % λ1 before alignment | % λ1 after alignment | P values* | |
|---|---|---|---|
| Parietal GM | 72.91 ± 8.10 | 83.53 ± 6.33 | <0.0001 |
| Frontal GM | 71.09 ± 8.51 | 81.75 ± 8.58 | <0.0001 |
| WM | 71.03 ± 9.14 | 84.47 ± 6.69 | <0.0001 |
P values are for two-sided t test.
Table 2 lists reliability (in terms of ICC) of the back-to-back MRSI studies on volunteers, using RCMS, PC1, or LR, separately for gray matter and white matter, of frontal and parietal lobes. In frontal and parietal lobe GM, PC1 provided the most reliable results for mI, followed by RCMS, whereas LR yielded unreliable results. In white matter, the three methods achieved comparable levels of reliability to measure mI. Similar results were obtained for Cho. For NAA and Cr, which usually yield higher SNR than mI and Cho, the methods provided comparable reliability for measurements in gray matter and white matter.
Table 2.
ICC Results of Metabolite Measurements by Lobe and Tissue Type from Back-to-Back MRSI Studies of 10 volunteers
| Method | ml | NAA | Cr | Cho | |
|---|---|---|---|---|---|
| Parietal GM | RCMS | 0.60 | 0.87 | 0.86 | 0.83 |
| PC1 | 0.87 | 0.98 | 0.98 | 0.92 | |
| LR | 0.11 | 0.73 | 0.74 | 0.33 | |
| Frontal GM | RCMS | 0.77 | 0.90 | 0.94 | 0.77 |
| PC1 | 0.88 | 0.98 | 0.98 | 0.93 | |
| LR | 0.22 | 0.85 | 0.82 | 0.33 | |
| WM | RCMS | 0.78 | 0.91 | 0.93 | 0.95 |
| PC1 | 0.78 | 0.98 | 0.96 | 0.96 | |
| LR | 0.82 | 0.72 | 0.89 | 0.95 |
ICC values lower than 0.5 indicate unreliable measurements.
Table 3 lists CoV of the same experimental MRSI data in parietal GM, frontal GM, and WM. This shows variability in measuring mI in frontal lobe gray matter was significantly reduced using either RCMS or PC1 compared to LR, whereas in other regions the improvements from RCMS or PC1 were not as prominent. For NAA, there were non-significant trends of improvement in WM and parietal GM for PC1 compared to LR. Improvements from RCMS were not significant. Significant improvement was also achieved in various brain regions for Cho and Cr with PC1 or RCMS. There was no statistically significant difference between RCMS and PC1 measurements in any brain region.
Table 3.
Coefficients of Variation (CoV) of Metabolite Measurements by Lobe and Tissue Type from Back-to-Back MRSI Studies of 10 Volunteers
| ml | NAA | Cr | Cho | ||
|---|---|---|---|---|---|
| Parietal GM | RCMS | 8.9 ± 8.1 | 4.1 ± 3.0 | 5.0 ± 2.8 | 5.6 ± 4.6† |
| PC1 | 6.5 ± 5.6 | 3.2 ± 1.7† | 2.7 ± 2.0 | 5.3 ± 4.9* | |
| LR | 15.8 ± 11.3 | 9.2 ± 6.2 | 8.2 ± 7.0 | 28.2 ± 22.9 | |
| Frontal GM | RCMS | 13.1 ± 6.0* | 5.8 ± 4.5 | 6.5 ± 2.3† | 9.6 ± 5.6* |
| PC1 | 11.8 ± 7.0* | 4.8 ± 3.4 | 3.7 ± 2.8* | 10.2 ± 7.1* | |
| LR | 28.6 ± 12.9 | 10.7 ± 7.2 | 13.4 ± 6.9 | 29.1 ± 20.0 | |
| WM | RCMS | 10.4 ± 6.5 | 4.0 ± 2.6 | 4.1 ± 2.7 | 4.7 ± 4.4 |
| PC1 | 9.8 ± 6.8 | 2.4 ± 0.8† | 3.4 ± 1.8 | 5.8 ± 3.7 | |
| LR | 9.5 ± 4.9 | 8.2 ± 5.3 | 6.9 ± 3.7 | 4.3 ± 2.8 |
P < 0.006,
0.017 > P > 0.006 for two-sided t test.
DISCUSSION
The main results are: (1) variability of MRSI was markedly reduced after carefully aligning frequency and phase of individual spectra; and (2) both RCMS and PC1 substantially improved reliability of mI measurements compared to LR, which has previously been used to analyze MRSI data (6,16).
Low SNR and random baseline fluctuations limit accuracy of brain metabolite measurements. We improved SNR and reduced the impact of baseline fluctuations by averaging coherent spectra after carefully aligning their frequency and phase, a process we labeled RCMS. We further applied PCA to extract the most coherent components from aligned spectra. The results document that both RCMS and PCA were superior to LR in reliably measuring metabolites, especially mI, which usually has poor SNR.
Evaluation of metabolite spectra using PCA was first introduced by Brown et al. (17) and later extended by Gonen et al. (18) to analyze 2D and 3D MRSI data. The method was further improved by including contributions from both real and imaginary spectral components (19) and by considering variations in amplitude, frequency, phase, and linewidth together (20). In this study, PCA was primarily used to examine the goodness of spectral alignment. This is possible since the alignment reduces variance in frequency, phase, and baseline features, as well as their contributions to PC1. The percent component variations of PC1 can, therefore, be used as an indicator of effectiveness of the frequency alignment, phase adjustment, and baseline corrections. Furthermore, we also used PC1 for quantification of metabolite concentrations (21).
Our results suggest that PC1 and RCMS are similarly effective in improving reliability of MRSI measurements. This indicates that the first principal component and mean distribution of the data are roughly the same. This similarity was also noticed by other investigators (17). Small differences between PC1 and RCMS could be observed when SNR is low. In our study PC1 yielded a higher ICC and lower CoV than RCMS. However, the differences between test-retest CoV were not statistically significant in any region of the brain. Therefore, if simplicity of data processing is a priority, an analysis of RCMS is preferable over analysis of PCA spectra (21).
A limitation of both RCMS and PC1 is that a normal distribution of metabolite concentrations within each tissue type and brain region is assumed so that averaging does not sacrifice signal information. However, deviations from a normal distribution may occur, especially in brain regions affected by pathology. To the extent that skewed distributions of metabolite concentrations reflect underlying pathology, information may be lost by RCMS and PC1. Therefore, RCMS and PC1 may not be appropriate across a range of pathologies with non-uniform metabolite distribution, such as heterogeneous tumors including neovasculature infiltration and necrosis. Tissue segmentation programs, which are capable in separating lesion from adjacent normal brain tissue, can be used to limit RCMS analyses on brain diseases with focal but relatively uniform metabolic pattern changes, such as multiple sclerosis, white matter lesions, or certain types of tumors. In addition, the RCMS and PC1 analyses in this study assumed iid noise. However, this is no longer correct for newer acquisition methods, e.g., those based on parallel imaging, which induce noise patterns that can be partially correlated. However, it should be pointed out that the LR method suffers from the same limitations in that a normal distribution of metabolite values and iid noise are assumed.
Another limitation is the assumption that B1 is uniform across the sample. Generally, however, a uniform B1 cannot be assumed because of sensitivity variations of RF coils and local dielectric effects in brain tissue, especially at higher magnetic fields. Unless B1 corrections are applied, RCMS and PC1 will be confounded by spatially varying magnitudes of the spectra s(ri, ω).
Finally, the present implementation of frequency and phase alignments in the frequency domain may have been compromised by problems related to the discrete Fourier transformation, such as artifacts due to data truncation, which may be avoided by aligning spectra in the time domain. On the other hand, correction of spectral baselines can more effectively be performed in the frequency domain (7), since it is generally sufficient to limit the correction to a broad bandwidth of the baselines across the spectrum.
CONCLUSION
A new scheme to analyze MRSI data is proposed to improve reliability and accuracy in measuring mI and other major brain metabolites. The findings from this study are consistent with the hypothesis that RCMS and PC1 can improve SNR and correct for baseline fluctuations, which are the major sources of error in quantifying brain metabolites from MRSI data.
Acknowledgments
We thank Dr. Tim Cootes of the University of Manchester for many helpful conversations about deformable shape model using PCA. We also thank Diana Truran, Meera Krishnan, Marybeth Kedzior, and Shannon Buckley for scanning the elderly subjects.
Footnotes
Grant Sponsor: NIH; Grant Numbers: AG10897, AG12435, EB00207, EB00822, and EB000766. Grant Sponsor: VA Research: MIRECC and REAP.
References
- 1.Hsu YY, Du AT, Schuff N, Weiner MW. Magnetic resonance imaging and magnetic resonance spectroscopy in dementias. J Geriatr Psychiatry Neurol. 2001;14:145–166. doi: 10.1177/089198870101400308. [DOI] [PMC free article] [PubMed] [Google Scholar]
- 2.Haupt CI, Schuff N, Weiner MW, Maudsley AA. Removal of lipid artifacts in 1H spectroscopic imaging by data extrapolation. Magn Reson Med. 1996;35:678 – 687. doi: 10.1002/mrm.1910350509. [DOI] [PMC free article] [PubMed] [Google Scholar]
- 3.Wiedermann D, Schuff N, Matson GB, Soher BJ, Du AT, Maudsley AA, Weiner MW. Short echo time multislice proton magnetic resonance spectroscopic imaging in human brain: metabolite distributions and reliability. Magn Reson Imaging. 2001;19:1073–1080. doi: 10.1016/s0730-725x(01)00441-6. [DOI] [PubMed] [Google Scholar]
- 4.Ross BD, Bluml S, Cowan R, Danielsen E, Farrow N, Tan J. In vivo MR spectroscopy of human dementia. Neuroimaging Clin N Am. 1998;8:809 – 822. [PubMed] [Google Scholar]
- 5.Zhu XP, Du AT, Jahng GH, Soher BJ, Maudsley AA, Weiner MW, Schuff N. Magnetic resonance spectroscopic imaging reconstruction with deformable shape-intensity models. Magn Reson Med. 2003;50:474 – 482. doi: 10.1002/mrm.10572. [DOI] [PMC free article] [PubMed] [Google Scholar]
- 6.Schuff N, Ezekiel F, Gamst AC, Amend DL, Capizzano AA, Maudsley AA, Weiner MW. Region and tissue differences of metabolites in normally aged brain using multislice 1H magnetic resonance spectroscopic imaging. Magn Reson Med. 2001;45:899 –907. doi: 10.1002/mrm.1119. [DOI] [PMC free article] [PubMed] [Google Scholar]
- 7.Young K, Soher BJ, Maudsley AA. Automated spectral analysis II: application of wavelet shrinkage for characterization of non-parameterized signals. Magn Reson Med. 1998;40:816 – 821. doi: 10.1002/mrm.1910400606. [DOI] [PubMed] [Google Scholar]
- 8.Kaiser L, Young K, Soher J, Weiner M. Macromolecular and lipid contributions in short echo time 1H MRS at 4 Tesla: 1) reliability in normal controls and 2) comparative study between amyotrophic lateral sclerosis patients and controls. Proceedings of the 13th Annual Meeting of ISMRM; Miami Beach, FL, USA. 2005. p. 123. [Google Scholar]
- 9.Le Fur Y, Ziegler A, Bourgeois D, Decorps M, Remy C. Phased spectroscopic images: application to the characterization of the 1H 1.3-ppm resonance in intracerebral tumors in the rat . Magn Reson Med. 1993;29:431– 435. doi: 10.1002/mrm.1910290402. [DOI] [PubMed] [Google Scholar]
- 10.Govindaraju V, Young K, Maudsley AA. Proton NMR chemical shifts and coupling constants for brain metabolites. NMR Biomed. 2000;13:129 –153. doi: 10.1002/1099-1492(200005)13:3<129::aid-nbm619>3.0.co;2-v. [DOI] [PubMed] [Google Scholar]
- 11.Brent BP. Algorithms for minimization without derivatives. New Jersey: Prentice-Hall; 1973. [Google Scholar]
- 12.Kwan RK, Evans AC, Pike GB. MRI simulation-based evaluation of image-processing and classification methods. IEEE Trans Med Imaging. 1999;18:1085–1097. doi: 10.1109/42.816072. [DOI] [PubMed] [Google Scholar]
- 13.Soher BJ, Young K, Govindaraju V, Maudsley AA. Automated spectral analysis III: application to in vivo proton MR spectroscopy and spectroscopic imaging. Magn Reson Med. 1998;40:822– 831. doi: 10.1002/mrm.1910400607. [DOI] [PubMed] [Google Scholar]
- 14.MacKay S, Ezekiel F, Di Sclafani V, Meyerhoff DJ, Gerson J, Norman D, Fein G, Weiner MW. Alzheimer disease and subcortical ischemic vascular dementia: evaluation by combining MR imaging segmentation and H-1 MR spectroscopic imaging. Radiology. 1996;198:537–545. doi: 10.1148/radiology.198.2.8596863. [DOI] [PMC free article] [PubMed] [Google Scholar]
- 15.Shrout PE, Fleiss JL. Intraclass correlations: uses in assessing rater reliability. Psychol Bull. 1979;2:420 – 428. doi: 10.1037//0033-2909.86.2.420. [DOI] [PubMed] [Google Scholar]
- 16.Lim KO, Spielman DM. Estimating NAA in cortical gray matter with applications for measuring changes due to aging. Magn Reson Med. 1997;37:372–377. doi: 10.1002/mrm.1910370313. [DOI] [PubMed] [Google Scholar]
- 17.Stoyanova R, Kuesel AC, Brown TR. Application of principal-component analysis for NMR spectral quantification. Journal of Magnetic Resonance Series A. 1995;115:265–269. [Google Scholar]
- 18.Gonen O, Arias-Mendoza F, Goelman G. 3D localized in vivo 1H spectroscopy of human brain by using a hybrid of 1D-Hadamard with 2D-chemical shift imaging. Magn Reson Med. 1997;37:644 – 650. doi: 10.1002/mrm.1910370503. [DOI] [PubMed] [Google Scholar]
- 19.Elliott MA, Walter GA, Swift A, Vandenborne K, Schotland JC, Leigh JS. Spectral quantitation by principal component analysis using complex singular value decomposition. Magn Reson Med. 1999;41:450 –455. doi: 10.1002/(sici)1522-2594(199903)41:3<450::aid-mrm4>3.0.co;2-9. [DOI] [PubMed] [Google Scholar]
- 20.Van Huffel S, Wang Y, Vanhamme L, Van Hecke P. Automatic frequency alignment and quantitation of single resonances in multiple magnetic resonance spectra via complex principal component analysis. J Magn Reson. 2002;158:1–14. doi: 10.1016/s1090-7807(02)00055-1. [DOI] [PubMed] [Google Scholar]
- 21.Zhu XP, Young K, Soher JB, Yin H, Ezekiel F, Weiner MW, Schuff N. New spectral analysis of short echotime multislice 1H MRSI in human brain using eigen spectra, baseline correction and frequency alignment; Proceedings of the 13th Annual Meeting of ISMRM; Miami Beach, FL, USA. 2005. p. 55. [Google Scholar]