

Abstract
With the use of localized 13 C MRS in conjunction with [1-13C]-Dglucose infusion, it is possible to study brain glycogen metabolism in vivo. The purpose of this study was to validate in vivo 13C MRS measurements by comparing them with results from a standard biochemical assay. To increase the [1–13C] glycogen concentration, 11 rats were subjected to an episode of acute hypoglycemia followed by a mild hyperglycemic recovery period during which [1-13C]-D-glucose was infused. The total brain [1-13C] glycogen of the same animal was determined from the enzymatically determined total brain glycogen content, which was fixed by focused microwave irradiation (4 kW in 1.4 s) immediately after the end of the in vivo NMR measurements. The corresponding isotopic enrichment (IE) of glycogen was measured by in vitro 1H MRS of protons bound to glucose C1-α. The in vivo [1-13C] glycogen concentration was strongly correlated to the in vitro [1-13C] glycogen content determined by biochemical measurement in a linear manner (R = 0.79). The results are consistent with the notion that localized 13C MRS measurements closely reflect 13C glycogen content in the brain.
Keywords: biochemical validation, 13C MRS, brain glycogen, metabolism, hypoglycemia
Brain glycogen is the largest glucose storage form in the central nervous system (CNS) and is increasingly being recognized as an important factor in brain energy metabolism (1,2). For example, its concentration exceeds that of brain glucose by severalfold, and depletion of glycogen significantly affects neuronal survival (3). It has been reported that brain glycogen may be higher than previously thought (4-6), which may be explained by the fact that brain glycogen is a highly labile metabolite and requires a highly sensitive and accurate method for its biochemical measurement.
We recently developed a localized 13C MRS method to quantify the 13C brain glycogen signal. In previous studies brain glycogen metabolism was assessed in vivo with 13C-labeling to enhance sensitivity (7,8). To date, in vivo 13C MRS is the only method available to assess brain glycogen content and metabolism noninvasively. In vivo brain glycogen metabolism studies using 13C MRS suggested that glycogen plays an important role as an emergency supply of energy during limited glucose transport that occurs in acute hypoglycemia (9). The observed supercompensation of brain glycogen following hypoglycemia suggests a profound effect of acute hypoglycemia on brain glycogen metabolism and content, which may affect glucose-sensing and may explain in part the defective counterregulation observed after a single episode of insulin-induced hypoglycemia (1). The 13C MRS method for the localized measurement of brain glycogen metabolism and content was expanded to in vivo human studies (10).
In liver, muscle, and heart, a variable proportion of total glycogen has been reported to exist in a low-molecular-weight form, namely proglycogen (∼400 kDa), and in the form of macroglycogen (∼107 Da) (11). Therefore, the brain glycogen signal is likely to have complex NMR relaxation properties (12) that can affect the reliability of its measurement in vivo, even though the majority of glycogen, if not all, can be detected by 13C NMR spectroscopy in the heart (13), muscle (14), and liver (15,16).
Therefore, in vivo localized 13C MRS measurement of brain glycogen should represent the total 13C glycogen in the brain. The aim of this study was to validate in vivo 13C NMR measurements of brain glycogen C1 by comparison with a standard biochemical assay.
MATERIALS AND METHODS
Animal Preparation
All in vivo studies were performed according to the guidelines of the University of Minnesota for the care and use of laboratory animals, and were approved by the Institutional Animal Care and Use Committee (IACUC). Eleven male Sprague-Dawley rats (150–175 g; Harlan Inc., WI, USA) were obtained 2 weeks before the studies. On the day of the experiment, the rats (252 ± 2 g, mean ± SD) had been subjected to a 16-hr overnight fasting period. They were prepared under 2% isoflurane anesthesia in a 2:1 mixture of nitrous oxide (N2O) and oxygen (O2), and ventilated with a pressure-driven ventilator (Kent Scientific Inc., CT, USA). Both femoral arteries were catheterized for blood sampling (plasma glucose and blood gas) and both femoral veins were catheterized for administration of test substances (α-chloralose, insulin and [1-13C]-D-glucose). Once vascular access was secured, anesthesia was switched to α-chloralose (Sigma-Aldrich Inc., MO, USA) with a 40-mg/kg bolus followed by a ∼26.7-mg/kg/hr continuous i.v. infusion.
Shortly thereafter, insulin (1 U/mL, Humulin® R; Lilly Inc., IN, USA) was administered to reach the target hypoglycemic condition of plasma glucose < 2 mM. Simultaneously, a 20% w/v solution of [1-13C]-D-glucose (Isotec Inc., OH, USA; CIL Inc., MA, USA) was infused at a rate ranging from 0.1 to 1 mL/hr to avoid plasma glucose falling below 1 mM. Immediately after ∼2 hr of acute hypoglycemia, a 13C glucose bolus followed by an adjustable continuous glucose infusion rate was used to establish mild hyperglycemia at a target concentration of ∼11 mM. During the second hour of this hyperglycemia recovery period, the animals were stereotaxically fixed with ear bars in an in-house-made holder, as described previously (8), and placed in the magnet.
Throughout the entire study period, the animals' body temperature was maintained at 37°C by warm water circulation (RTE-101 bath circulator; Thermo NESLAB, NH, USA) based on feedback from a rectal temperature probe (Cole Palmer Inc., IL, USA.). During the hypoglycemic study, arterial blood was withdrawn at 5–10-min intervals and spun down to obtain plasma glucose levels with an Analox GM7 analyzer (Analox Instruments, MA, USA). Concurrently, physiological parameters (i.e., PaO2, PaCO2 and pH) were maintained based on measurements of withdrawn arterial blood with a blood gas analyzer (Rapidlab 248; Bayer Corp., UK) at ∼30-min intervals, which were adapted to be the sampling intervals during hyperglycemia.
Localized 13C MRS Measurement of In Vivo 13C Glycogen of Rat Brain
All in vivo MRS studies were performed in a horizontal 9.4-T/31-cm magnet (Magnex Scientific, UK) with an 11-cm-diameter gradient coil capable of switching to 300 mT/m in 500 μs, interfaced with an INOVA console (Varian Inc., CA, USA). A quadrature 1H radiofrequency (RF) 14-mm-diameter coil and a linear polarized, three-turn 11-mm-diameter 13C RF coil (17,18) were used as the transceiver. A sphere containing 99% 13C-enriched formic acid (FA) was located at the center of the 13C coil as an external reference, and the coil was placed on the animal's head as described previously (7,8,18). Fast Automatic Shimming Technique by Mapping Along Projections (FASTMAP) shimming with echo-planar imaging (EPI) readout (19) was applied to adjust B0 field homogeneity in a nominal ∼440 μL volume of interest. The Single-shot Inversion Recovery based Non-Echo (SIRENE) sequence (7) was applied for 3D localization with optimized outer volume suppression (e.g., for glycogen, the inversion time (TI) was 0.11 s) (7,8,18) to ensure elimination of signals from noncerebral tissue, and bilevel WALTZ-16 RF pulses were applied at the water frequency for generation of a nuclear Overhauser effect (NOE) and for decoupling during acquisition (7).
Twelve 64-scan localized 13C MR spectra (repetition time (TR) = 1 s) acquired during the last half hour of hyperglycemia recovery were summed, apodized by 20-Hz exponential line-broadening, zero-filled, and Fourier transformed. The glycogen C1 signal intensity () was fitted using built-in spectrometer software (Varian Inc.) with a fixed linewidth obtained from the spectrum obtained by summing all acquisitions during the entire experiment. was quantified using the external reference method, based on the measurement of the signal from a phantom containing 400 mM of natural abundance oyster glycogen (Sigma-Aldrich Inc.) () under identical experimental conditions as for the in vivo studies (8), including temperature. The glycogen C1 signal intensity in the phantom was slightly temperature-dependent, as judged from separate measurements at 21°C, 37°C, and 55°C using the same settings as for the in vivo studies described above except that no localization, no decoupling, and TR = 20 s were used. The in vitro oyster glycogen C1 signal intensity at ambient room temperature (21°C) was reduced by ∼16% compared to that at 37°C, which was ∼8% lower than that at 55°C. In vivo 13C glycogen content ([13C-Glyc]invivo) was calculated based on Eq. [1] from . The in vivo signal was corrected with a small correction factor (<15%), which included measured differential coil loading determined from the obtained the FA signals in reference studies () and in vivo experiments (), and NOE/T1 effects assessed from the fully relaxed glycogen signal as in previous studies (7,8):
| [1] |
The glycogen solution was 400 mM natural abundance (1.1%) oyster glycogen, and 1 mM ∼ 1 μmol/g was assumed.
Enzymatic Determination of In Vitro Glycogen Concentration
Shortly after completion of the in vivo 13C MRS measurement (<10 min), the animals were carefully killed with the use of a focused microwave fixation device (Gerling Applied Electronics, Modesta, CA) at 4 kW within 1.4 s (6). The brain (excluding cerebellum) was removed from the skull and stored in a −80°C freezer (Thermo Forma, OH, USA) for further processing.
Within 8 weeks, the frozen brains were pulverized under liquid N2 using a mortar and a pestle. The well-mixed brain powder was separated into two ∼200-mg samples to determine brain glycogen content using a standard biochemical assay (20), as follows: Briefly, 500 μL of 0.03 M HCl were added to each sample, homogenized well (25-kHz ultrasonic processor, Cole Parmer Inc.), and heated for 45 min at 80∼90°C in a water bath. From each sample, two identical 200-μL aliquots were taken and treated in exactly the same way, except that 5 μL of 5-mM sodium acetate was added to the “minus” sample (to yield tissue glucose concentration), and 5 μL of amyloglucosidase (Roche Diagnostics Corp., IN, USA) solution was added to the “plus” sample (to yield total tissue glucosyl concentration). The samples were pH-adjusted to 5 and incubated for ∼2 hr at 37°C in a reciprocal water-bath shaker (New Brunswick Scientific Co., Inc., NJ, USA).
Glucose levels were determined at room temperature and the readouts were ensured to be in the linear range of the analyzer (Analox GM7 analyzer, see above). The glucose concentration of the brain extracts ([Glc], μmol/g wet weight) for each sample was calculated from the glucose analyzer readout ([Glc]readout) by correcting for dilution using the following equation:
| [2] |
where W represents the weight (1 mL = 1 g) from the different source, indicated by the respective subscript. The free brain glucose ([Glc]free) and the digested glucose ([Glc]dig) were obtained and calculated from the “minus” and “plus” samples (see above), respectively. The difference of these two from the same animal resulted in the in vitro glycogen concentration ([Glyc]invitro).
Glycogen concentrations are expressed as μmol glucosyl units/g wet weight throughout.
1H MRS Assessment of the Isotopic Enrichment (IE) of Glycogen (IEGlyc)
The assay samples obtained as described above were carefully filtered with Millipore Ultrafree-CL filters (10 kDa; Millipore Corp., MA, USA) to remove high-molecular-weight compounds. The filtered solution was frozen with liquid N2 and lyophilized by a dual-stage rotary vane vacuum pump (Leybold Vakuum GmbH, DE). The freeze-dried samples were resuspended in 600 μLD2O (low para-magnetic; CIL Inc., MA, USA) for 1H MRS.
In vitro 1H NMR studies were performed in a vertical 14.1-T magnet (Oxford NMR 600, UK) equipped with an INOVA console (Varian Inc.). 1D proton spectra without water suppression were acquired using the following parameters: 6.7 μs 90° pulse, TR = 20 s, and 64 averages at 37°C. The integrals of glucose C1-α proton signals were used to determine IE based on the proton signals bound to 12C1-α glucose (IH-12C1α) and 13 C1-α glucose (IH-13Clα), respectively, using the following equation:
| [3] |
IE was obtained by 1H MRS from the free background glucose sample (W/O amyloglucosidase, denominated by the subscript free) and on the digested glucose sample (W/amyloglucosidase, denominated with the subscript dig), respectively (see above). The IE of glycogen, IEGlyc, was calculated from Eq. [4] with the corresponding IE, [Glc] and [Glyc]invitro:
| [4] |
In vitro 13C glycogen ([13C-Glyc]invitro) was calculated from the product of [Glyc]invitro and IEGlyc.
Statistics
The experimental errors of each in vivo 13C glycogen measurement were determined from all the arrayed spectra used for final in vivo 13C glycogen quantification, as described in Materials and Methods. The errors of the glycogen assay were determined by two parallel measurements, as described above. The rest of the errors in the present studies were calculated according to the law of propagation of measurement errors, with exception of the FA signal (Eq. [1]), glycogen phantom study, and 1H MRS determination of IE (all of which were assumed negligible). All data are represented as the mean ± SD. Significance was determined by means of a two-tailed Student's t-test, and a P-value < 0.05 was considered statistically significant.
RESULTS
To achieve a high glycogen tissue content and a high degree of 13C labeling of the glucose residues of brain glycogen, supercompensation resulting from insulin-induced acute hypoglycemia (21) was adopted in the present studies. All 11 rats were intravenously administered 38 ± 5 U/kg of insulin, which resulted in acute insulin-induced hypoglycemia (plasma glucose = 1.60 ± 0.03 mM) for 2.0 ± 0.1 hr, followed by hyperglycemic recovery (plasma glucose = 12.0 ± 1.3 mM) for 12.4 ± 1.2 hr. Throughout the in vivo experiments the animals were maintained under physiological conditions (i.e., pH = 7.39 ± 0.02, pCO2 = 39.6 ± 1.9 mmHg, pO2 = 154.4 ± 14.2 mmHg, and temperature = 37.1 ± 0.1 °C).
The arrayed spectra acquired for the determination of in vivo 13C glycogen were visually verified to be close to steady state. The brain [1-13C]-glycogen signal was typically detected with a high SNR (Fig. 1). The external reference quantification of in vivo 13C glycogen signal indicated a modest temperature dependence of glycogen C1 signals in the oyster glycogen solution (see Materials and Methods) and thus was applied at 37°C. The in vivo 13C glycogen concentration ranged from 2.7 to 10.5 μmol/g wet weight, and the estimated average error of the NMR measurements was SDNMR = 1.3 μmol/g and <2.1 μmol/g.
FIG. 1.

In vivo localized 13C NMR spectra of brain glucose and glycogen. The spectrum shown was obtained right at the end of the in vivo 13C MRS study and is the sum of 768 scans from 12 64-scan interleaved spectra from a 440-μL volume. The brain glycogen C1 signal is well above the noise level (SNR). Processing consisted of 20 Hz exponential multiplication, zero-filling, FFT, and phase correction. The spectrum is shown with a linear baseline correction.
In vitro glycogen content was determined on the same brains as measured by in vivo NMR, resulting in total brain glycogen concentrations ranging from 5.9 to 15.6 μmol/g wet weight. In vitro 13C enrichment of glucose was based on 1H MRS measurements at 14.1-T with well-resolved 12C1-α glucose proton signals at 5.21 ppm and 13C1-α glucose proton signals at 5.07 and 5.35 ppm (Fig. 2). From 90% of IEfree and 81% of IEdig, an average 77% IE of glycogen (IEGlyc) was calculated based on Eq. [4]. Multiplying the total enzymatic glycogen content ([Glyc]invitro) with the IE of glycogen (IEGlyc) resulted in in vitro 1-13C glycogen concentrations ranging from 4.0 to 13.6 μmol/g with an average SDinvitro of 0.6 μmol/g and <2.3 μmol/g.
FIG. 2.

Spectra of H1α-D-glucose signals from both in vitro NMR samples of one rat. The spectra were obtained from the “minus” (a) and “plus” samples (b) at 14.1-T. The vertical scale was normalized based on the intensity of the creatine CH2 peak signal at 3.93 ppm (not shown). 13C-H1α in the figure represents the H1α protons bound to 13C, and 12C-H1α reflects those protons bound to 12C.
When the in vivo 13C glycogen concentration was plotted as a function of in vitro 13C glycogen content (Fig. 3), a highly linear correlation with a slope of 0.75 ± 0.07, mean ± SE (solid line) was obtained. All but two of the measured data points were within experimental error of the identity line (dashed line).
FIG. 3.
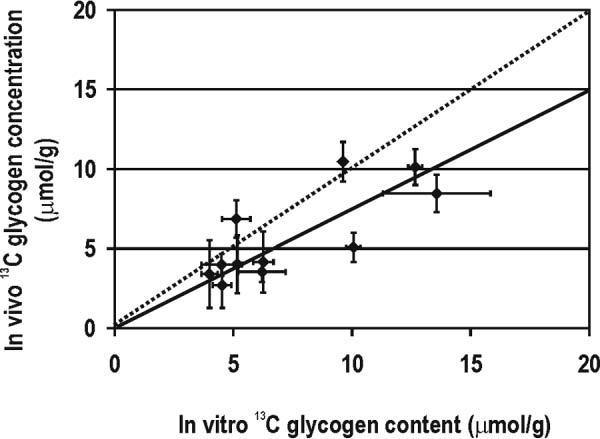
Comparison between in vivo and in vitro 13C glycogen measurements. In vivo 13C glycogen concentration (vertical axis) is plotted as a function of the 1-13C glycogen content measured biochemically (horizontal axis). Each data point stands for one animal study, and error bars represent the corresponding calculated experimental errors. The solid line represents the best fit with linear regression (y = ax) of all data with 0.75 ± 0.07 (R = 0.79). The dotted line is the identity line.
DISCUSSION
In this study we used a “gold standard” method (i.e., amyloglucosidase assay of glycogen) to directly compare the quantification of brain [1-13C]-glycogen to that obtained with in vivo localized 13C MRS in the same brain. The correlation was high over a wide range of 13C glycogen concentrations and close to identity within experimental errors, as shown in Fig. 3.
The low 13C MRS sensitivity was compensated was compensated by increasing the 13C content of brain glycogen by inducing supercompensation as in previous studies (9), which was adapted in this study by first depleting brain glycogen using insulin-induced moderate hypoglycemia and then repleting it using 13C glucose infusions. The ensuing supercompensation was observed in the present study even after ∼12 hr of recovery both by in vivo NMR and by biochemical methods, with an average post-hypoglycemic 13C glycogen level of 6.8 ± 3.3 μmol/g, confirming qualitatively the findings of previous reports (9).
A higher brain 13C glycogen content led to a high SNR of in vivo NMR signals (Fig. 1) and resulted in an excellent estimation of in vivo 13C glycogen concentrations with only 768 scans, which is far fewer scans than used in previous muscle glycogen measurements (14). This was evidenced by SDNMR = 1.3 μmol/g in absolute terms, which is comparable to the error (in terms of 13C concentration) observed in previous validation studies performed in rabbit muscle (14) and liver (15), despite the fact that brain glycogen was severalfold less concentrated. This implies increases in sensitivity ascribed to improvements in B0, RF coil design, and localization methodology. We minimized the potential effect of the observed temperature dependence of glycogen signal (∼10% signal intensity loss) on the accuracy of the in vivo quantification by performing the external reference at body temperature (i.e., 37°C).
In the present study, in vitro brain glycogen was determined in the same brain tissue, obtained immediately after the in vivo NMR measurement. Brain tissue was rapidly fixed within 1.4 s, as in previous studies by our group (20,22) and others (6,23,24), which minimized potential underestimation of the brain glycogen concentration due to its rapid postmortem degradation. In particular, the physiological conditions of the animals at the time of fixation were identical to those used when the NMR measurement was performed (data not shown). In vitro 1H NMR spectra of glucose C1-α proton signals on processed post-assay samples at 14.1-T exhibited well-resolved proton signals (Fig. 2), from which in vitro 13C glycogen content was calculated. Despite the involved error propagation SDinvitro was lower than SDNMR, especially at lower concentrations.
The errors of both in vivo 13C glycogen signals and in vitro 13C glycogen contents may include additional factors beyond measurement errors, such as variations in plasma glucose. Previous studies have shown that steady-state plasma glucose has a linear relationship with brain glucose (18,20,25-27). Given the effect of brain glucose on brain glycogen content (unpublished data; also see Refs. 9 and 22 and references therein), it is possible that variations in the plasma glucose levels can affect brain 13C glycogen levels. In this study, the maximum difference of plasma glucose did not exceed 3.5 mM. However, if we exclude data points with a plasma glucose difference higher than 1.8 mM before and after the arrayed spectra acquisition, the slope of comparison between the two methods was 0.72 with R = 0.78, which is not significantly different (P > 0.05) and therefore does not affect the conclusions of the present study.
Considering the overall variation of in vivo 13C glycogen quantification (SDNMR = 1.3 μmol/g) and one specific data point with a standard deviation (SD) of SDinvitro = 2.3 μmol/g, all points but one were within the identity line (dashed line in Fig. 3). The excellent agreement between the two methods is further supported by plotting the differences of the two methods against the mean brain 13C glycogen content (Fig. 4), in which only two differences fall outside ± 2 SD (SD = 2.1 μmol/g of the difference, shaded area in Fig. 4) of the line of perfect agreement (solid line), the rest being within ± 2 SDNMR (SDNMR = 1.3 μmol/g).
FIG. 4.
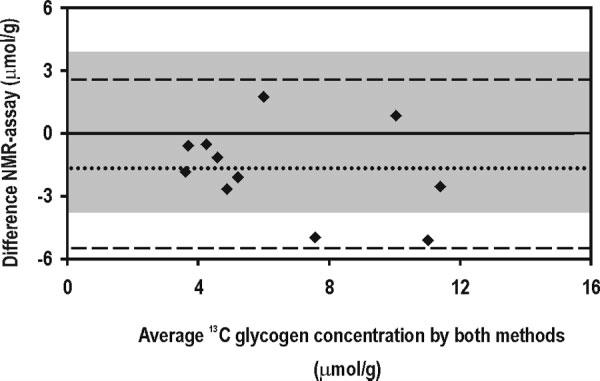
Difference between the two methods plotted against the mean brain 13C glycogen concentration. Each closed diamond represents the difference between the two methods plotted against the corresponding mean from the two methods. The dotted line indicates the average difference (–1.7 μmol/g), and the dashed lines indicate the average ± 2 SD (SD = 2.1 μmol/g of the difference). The shaded area covers the 95% confidence interval of the measurements assuming perfect agreement of the methods (i.e., 0 ± 2 SD).
It has been reported that the T2 of glycogen is multiexponential (12) and that the complex structure of glycogen may lead to significant fractions of the glycogen C1 resonance having a substantially larger linewidth. The fact that the slope was slightly below 1 (Fig. 3) could signify a small overall contribution of broad resonances to the signal that was not accounted for.
The aforementioned two forms of glycogen—proglycogen and macroglycogen—appear to behave differently in glycogen metabolism. For example, it has been reported that proglycogen is not be actively involved in glycogen metabolism (28) and therefore is not likely to be labeled by 13C label administration. Although in the present study the majority of brain glycogen was depleted by the introduction of acute hypoglycemia, in principle it is possible that some proglycogen was not depleted and completely labeled due to longer turnover times. This could explain the small but significant reduction in IE of glycogen 77%, compared to tissue glucose 90%. This is consistent with a previous 13C MRS study on cardiac glycogen (13).
Whatever the origin of the minor discrepancy between the in vivo and biochemical measurements, its consequence must be minimal in investigations that show large changes in brain glycogen C1 content, as previously reported (9).
We conclude that NMR measurements of brain glycogen C1 overall reliably reflect the biochemically measured 13C glycogen content. Therefore, in vivo 13C MRS in conjunction with 13C glucose infusion is an accurate and precise method for assessing in vivo brain glycogen metabolism.
ACKNOWLEDGMENTS
The authors acknowledge helpful discussions with Drs. Gulin Öz, Malgorzata Marjanska, and Pierre-Gilles Henry.
Footnotes
Grant sponsor: National Institutes of Health; Grant numbers: R01 NS42005; P41 RR08079; Grant sponsors: Juvenile Diabetes Research Foundation International; W.M. Keck Foundation; Centre d'Imagerie BioMedicale; Leenaards Foundation; Jeantet Foundation.
Correspondence to: Rolf Gruetter, Laboratory for Functional and Metabolic Imaging (LIFMET), Ecole Polytechnique Federale de Lausanne, Station 6, CH-1015 Lausanne, Switzerland. E-mail: rolf.gruetter@epfl.ch
REFERENCES
- 1.Gruetter R. Glycogen: the forgotten cerebral energy store. J Neurosci Res. 2003;74:179–183. doi: 10.1002/jnr.10785. [DOI] [PubMed] [Google Scholar]
- 2.Brown AM, Tekkok SB, Ransom BR. Glycogen regulation and functional role in mouse white matter. J Physiol. 2003;549(Pt 2):501–512. doi: 10.1113/jphysiol.2003.042416. [DOI] [PMC free article] [PubMed] [Google Scholar]
- 3.Swanson RA, Choi DW. Glial glycogen stores affect neuronal survival during glucose deprivation in vitro. J Cereb Blood Flow Metab. 1993;13:162–169. doi: 10.1038/jcbfm.1993.19. [DOI] [PubMed] [Google Scholar]
- 4.Choi IY, Gruetter R. In vivo 13C NMR assessment of brain glycogen concentration and turnover in the awake rat. Neurochem Int. 2003;43:317–322. doi: 10.1016/s0197-0186(03)00018-4. [DOI] [PubMed] [Google Scholar]
- 5.Cruz NF, Dienel GA. High glycogen levels in brains of rats with minimal environmental stimuli: implications for metabolic contributions of working astrocytes. J Cereb Blood Flow Metab. 2002;22:1476–1489. doi: 10.1097/01.WCB.0000034362.37277.C0. [DOI] [PubMed] [Google Scholar]
- 6.Kong J, Shepel PN, Holden CP, Mackiewicz M, Pack AI, Geiger JD. Brain glycogen decreases with increased periods of wakefulness: implications for homeostatic drive to sleep. J Neurosci. 2002;22:5581–5587. doi: 10.1523/JNEUROSCI.22-13-05581.2002. [DOI] [PMC free article] [PubMed] [Google Scholar]
- 7.Choi IY, Tkac I, Gruetter R. Single-shot, three-dimensional “non-echo” localization method for in vivo NMR spectroscopy. Magn Reson Med. 2000;44:387–394. doi: 10.1002/1522-2594(200009)44:3<387::aid-mrm8>3.0.co;2-3. [DOI] [PubMed] [Google Scholar]
- 8.Choi IY, Tkac I, Ugurbil K, Gruetter R. Noninvasive measurements of [1-13C]glycogen concentrations and metabolism in rat brain in vivo. J Neurochem. 1999;73:1300–1308. doi: 10.1046/j.1471-4159.1999.0731300.x. [DOI] [PubMed] [Google Scholar]
- 9.Choi IY, Seaquist ER, Gruetter R. Effect of hypoglycemia on brain glycogen metabolism in vivo. J Neurosci Res. 2003;72:25–32. doi: 10.1002/jnr.10574. [DOI] [PMC free article] [PubMed] [Google Scholar]
- 10.Oz G, Henry PG, Seaquist ER, Gruetter R. Direct, noninvasive measurement of brain glycogen metabolism in humans. Neurochem Int. 2003;43:323–329. doi: 10.1016/s0197-0186(03)00019-6. [DOI] [PubMed] [Google Scholar]
- 11.Alonso MD, Lomako J, Lomako WM, Whelan WJ. A new look at the biogenesis of glycogen. FASEB J. 1995;9:1126–1137. doi: 10.1096/fasebj.9.12.7672505. [DOI] [PubMed] [Google Scholar]
- 12.Overloop K, Vanstapel F, Van Hecke P. 13C-NMR relaxation in glycogen. Magn Reson Med. 1996;36:45–51. doi: 10.1002/mrm.1910360109. [DOI] [PubMed] [Google Scholar]
- 13.Garlick PB, Pritchard RD. Absolute quantification and NMR visibility of glycogen in the isolated, perfused rat heart using 13C NMR spectroscopy. NMR Biomed. 1993;6:84–88. doi: 10.1002/nbm.1940060113. [DOI] [PubMed] [Google Scholar]
- 14.Gruetter R, Prolla TA, Shulman RG. 13C NMR visibility of rabbit muscle glycogen in vivo. Magn Reson Med. 1991;20:327–332. doi: 10.1002/mrm.1910200216. [DOI] [PubMed] [Google Scholar]
- 15.Gruetter R, Magnusson I, Rothman DL, Avison MJ, Shulman RG, Shulman GI. Validation of 13C NMR measurements of liver glycogen in vivo. Magn Reson Med. 1994;31:583–588. doi: 10.1002/mrm.1910310602. [DOI] [PubMed] [Google Scholar]
- 16.Borgs M, Van Hecke P, Overloop K, Decanniere C, Van Huffel S, Stalmans W, Vanstapel F. In situ 13C NMR quantification of hepatic glycogen. NMR Biomed. 1993;6:371–376. doi: 10.1002/nbm.1940060604. [DOI] [PubMed] [Google Scholar]
- 17.Adriany G, Gruetter R. A half-volume coil for efficient proton decoupling in humans at 4 tesla. J Magn Reson. 1997;125:178–184. doi: 10.1006/jmre.1997.1113. [DOI] [PubMed] [Google Scholar]
- 18.Choi IY, Lee SP, Kim SG, Gruetter R. In vivo measurements of brain glucose transport using the reversible Michaelis-Menten model and simultaneous measurements of cerebral blood flow changes during hypoglycemia. J Cereb Blood Flow Metab. 2001;21:653–663. doi: 10.1097/00004647-200106000-00003. [DOI] [PubMed] [Google Scholar]
- 19.Gruetter R, Tkac I. Field mapping without reference scan using asymmetric echo-planar techniques. Magn Reson Med. 2000;43:319–323. doi: 10.1002/(sici)1522-2594(200002)43:2<319::aid-mrm22>3.0.co;2-1. [DOI] [PubMed] [Google Scholar]
- 20.Lei H, Gruetter R. Effect of chronic hypoglycemia on glucose concentration and glycogen content in rat brain: A localized 13C NMR study. J Neurochem. 2006;99:260–268. doi: 10.1111/j.1471-4159.2006.04115.x. [DOI] [PMC free article] [PubMed] [Google Scholar]
- 21.Choi IY, Lei H, Gruetter R. Effect of deep pentobarbital anesthesia on neurotransmitter metabolism in vivo: on the correlation of total glucose consumption with glutamatergic action. J Cereb Blood Flow Metab. 2002;22:1343–1351. doi: 10.1097/01.WCB.0000040945.89393.46. [DOI] [PubMed] [Google Scholar]
- 22.Morgenthaler FD, Koski DM, Kraftsik R, Henry PG, Gruetter R. Biochemical quantification of total brain glycogen concentration in rats under different glycemic states. Neurochem Int. 2006;48:616–622. doi: 10.1016/j.neuint.2005.12.034. [DOI] [PMC free article] [PubMed] [Google Scholar]
- 23.Sagar SM, Sharp FR, Swanson RA. The regional distribution of glycogen in rat brain fixed by microwave irradiation. Brain Res. 1987;417:172–174. doi: 10.1016/0006-8993(87)90195-8. [DOI] [PubMed] [Google Scholar]
- 24.Swanson RA, Morton MM, Sagar SM, Sharp FR. Sensory stimulation induces local cerebral glycogenolysis: demonstration by autoradiography. Neuroscience. 1992;51:451–461. doi: 10.1016/0306-4522(92)90329-z. [DOI] [PubMed] [Google Scholar]
- 25.Gruetter R, Seaquist ER, Kim S, Ugurbil K. Localized in vivo 13C-NMR of glutamate metabolism in the human brain: initial results at 4 tesla. Dev Neurosci. 1998;20:380–388. doi: 10.1159/000017334. [DOI] [PubMed] [Google Scholar]
- 26.Seaquist ER, Damberg GS, Tkac I, Gruetter R. The effect of insulin on in vivo cerebral glucose concentrations and rates of glucose transport/metabolism in humans. Diabetes. 2001;50:2203–2209. doi: 10.2337/diabetes.50.10.2203. [DOI] [PubMed] [Google Scholar]
- 27.de Graaf RA, Pan JW, Telang F, Lee JH, Brown P, Novotny EJ, Hetherington HP, Rothman DL. Differentiation of glucose transport in human brain gray and white matter. J Cereb Blood Flow Metab. 2001;21:483–492. doi: 10.1097/00004647-200105000-00002. [DOI] [PubMed] [Google Scholar]
- 28.Lomako J, Lomako WM, Whelan WJ, Dombro RS, Neary JT, Norenberg MD. Glycogen synthesis in the astrocyte: from glycogenin to proglycogen to glycogen. FASEB J. 1993;7:1386–1393. doi: 10.1096/fasebj.7.14.8224611. [DOI] [PubMed] [Google Scholar]