

Abstract
Orientation tuning has been studied extensively in the visual system, but little is known about it in the somatosensory system. Here we investigate tuning in the second somatosensory (SII) region using a motorized stimulator that presented a small oriented bar to the 12 finger pads of digits 2–5 (D2–D5) of the macaque monkey. A subset (23%; n = 218) of the 928 SII region neurons [the same 928 neurons studied by Fitzgerald et al. (2004, 2006)] exhibited tuning, and most of these were tuned on one or two finger pads. All eight 22.5° separated orientations were represented as the preferred orientation of multiple neurons, although not necessarily in equal numbers. A measure of bandwidth indicated that tuning in the SII region is sharp and is similar to the tuning observed in visual cortical areas. In addition, two-dimensional Gaussians that were fit to the tuning curves had very high r2 values, indicating that most tuning curves are both unimodal and symmetrical with respect to their preferred orientation. Most tuned neurons had additional untuned pads, although the responsiveness of these pads tended to be less than the responsiveness of tuned pads. Neurons with multiple tuned pads tended to have similar preferred orientations on their tuned pads, which can be interpreted as evidence for integration of information across fingers or as a form of positional invariance. Finally, comparison of the tuning properties showed that there are small but significant differences between the posterior, central, and anterior fields of the SII region.
Keywords: somatosensory cortex, tactile, SII, orientation, receptive field, object recognition
Introduction
Identifying oriented stimulus features is important in both visual and tactile perception. In vision, oriented features segregate scenes and objects into their component parts, and in touch, oriented features are important for signaling the locations of edges and corners of objects in contact with the body. Although orientation has been studied extensively in the macaque visual system since the initial report of orientation tuning in the primary visual cortex (V1) (Hubel and Wiesel, 1968), where and how orientation is represented in the somatosensory system is not as well understood. Cortical lesion studies suggest that area 3b of primary somatosensory cortex (SI) (Randolph and Semmes, 1974) and the second somatosensory cortex (SII) (Murray and Mishkin, 1984) play a critical role in tactile object processing, because lesions of these areas greatly impair the monkey's ability to discriminate oriented tactile features.
There have been a few single-unit studies of orientation tuning in the somatosensory system; most were studies of SI cortex, and together they provided mixed results concerning the prevalence of tuning. Pubols and LeRoy (1977) reported that at least 19% of the neurons in anesthetized raccoon SI are preferentially responsive to certain orientations of a hand-held bar. Hyvarinen and Poranen (1978) reported that only a very small percentage (<2%) of neurons may be tuned in monkey SI, in a study in which animals were trained to respond when an oriented bar stopped vibrating. Warren et al. (1986) also reported only a very small percentage (3%) of tuned neurons in awake monkey SI cortex. More recently, two studies of area 3b (DiCarlo et al., 1998; DiCarlo and Johnson, 2000) indicated that some neurons have elongated bands of excitation and/or inhibition that may produce orientation tuning, and Hsiao et al. (2002) reported that 75% of neurons in areas 3b and 1 showed orientation tuning. Collectively, these six studies indicate that the orientation of a tactile stimulus is represented in SI cortex, but the prevalence of tuned neurons there and in other somatosensory areas is not clear.
Other than recent studies from our laboratory in which we discussed a subset of these data (Fitzgerald et al., 1999; Hsiao et al., 2002), there have been no previous studies of orientation tuning in the SII region. However, because anatomical studies indicate that the SII region receives feedforward input from SI (Friedman et al., 1980, 1986, 2000; Burton et al., 1995; Disbrow et al., 2003) and because some SII region neuronal receptive fields (RFs) can, within a finger pad, distinguish between different spatial frequency textures (Sinclair and Burton, 1993; Jiang et al., 1997; Pruett et al., 2000, 2001) and letters (Hsiao et al., 1993) and are responsive to a small punctate probe (Burton and Sinclair, 1990), orientation tuning may likely be observed in the SII region. In our companion paper (Fitzgerald et al., 2006), we characterize the sizes and shapes of the RFs of these neurons; here we characterize their tuning properties.
Materials and Methods
The details of the recording methods that were used in this study have been reported previously (Fitzgerald et al., 2004). Briefly, we recorded from single neurons in the SII hand region of four hemispheres of two rhesus monkeys (Macaca mulatta). A total of 35–45 d were spent recording in each hemisphere. Single-neuron data were collected while the monkeys performed a visual detection task that maintained them in a nearly constant state of alertness. The monkeys were trained to allow their hands to be restrained during the recording sessions, because this allowed for accurate and repeatable stimulation of the digits by the motorized tactile stimulator.
This stimulator, which was described by Fitzgerald et al. (2004), indented a small oriented bar (Altem plastic) onto individual finger pads of digits 2–5 (of the hand contralateral to the recorded hemisphere) in a randomized sequence, generating eight repetitions at each of eight, 22.5° separated bar orientations for the 12 finger pads of these four digits. Stimuli were presented in a pseudorandom order to minimize the time spent traveling between finger pads. After stimulating a pad with a random sequence of two repetitions of each of the eight orientations, the bar was moved to a randomly chosen neighboring finger pad. This sequence was repeated until each pad had been presented with eight repetitions of each of the eight orientations. Stimulus duration was 500 ms, with an indentation force of 10 g. The bar was approximately the width of a monkey's finger and had rounded ends; its short axis was a 90° wedge, and its long axis was circular with an 8 mm radius, effectively producing a length of ∼7 mm.
After the recordings were completed, each monkey was deeply anesthetized and perfused transcardially. Electrode tracks, which had been marked with fluorescent dyes (DiCarlo et al., 1996), were reconstructed in Neurolucida (MicroBrightField, Williston, VT) and AutoCAD (Autodesk, San Rafael, CA) to confirm that the recordings were made in the SII region.
Responsiveness of each neuron to the oriented bar stimuli was assessed in a two-step manner. In the first step, each of the 12 stimulated finger pads was tested for orientation tuning with a one-way ANOVA on the firing rates evoked during the 500 ms presentation of each of the eight, 22.5° separated orientations (overall p < 0.05, Bonferroni corrected for 12 comparisons). In the second step, each finger pad that did not exhibit tuning was tested for untuned excitatory or inhibitory responsiveness by pooling the data from all eight orientations and comparing the mean spontaneous firing rate (500 ms window before stimulus onset) with the mean rate evoked during the 500 ms presentation of the oriented bars (unpaired two-tailed t test, overall p < 0.05, Bonferroni corrected for up to 12 comparisons). Thus, in this two-step manner, each finger pad was classified as orientation tuned, untuned excitatory, untuned inhibitory, or not responsive.
For each neuron with two or more orientation tuned finger pads, we assessed similarity of tuning on the different tuned pads using two methods (see Figs. 12, 13). In both methods, the preferred orientation of each tuned pad was represented as the mean angular vector of the firing rates evoked by the eight (22.5° separated) orientations. The mean angular vector was calculated as the sum of eight orientation vectors, in which the magnitude of each orientation vector was equal to the mean firing rate and the direction was the orientation of the bar in 360° circular space. In Figure 12, we show scatter plots of the preferred orientations of the best two (highest peak firing rate) tuned pads, which allows for a direct comparison of the similarity of the preferred orientations of the two pads. In Figure 13, we compared the preferred orientations of the tuned pads by determining the angular range of their mean angular vectors. The cumulative probability distribution functions for angular range under the hypothesis of uniformity are described by the following equation (Mardia and Jupp, 2000):
 |
where w is the angular sample range (length of the smallest arc that contains all of the observations), n is the number of tuned pads, r is the maximum circular range for a given n, and the sum is over values of k such that 1 − k(1 − r/2π) > 0.
Figure 12.

Scatter plot of similarity of tuning. Each point represents the preferred orientation (mean angular vector) of the best tuned pad versus the preferred orientation of the second best pad, for each neuron with two or more tuned pads. Best tuned pad is defined as the pad with highest evoked firing rate at its preferred orientation, and the second best pad had the second highest such rate. The two gray dashed lines mark the distance midway between most similar (equal) and least similar (90° different; black dashed lines) orientations. The plots wrap around, and the data are plotted as close to the equivalence line as possible. p field, Posterior field; c field, central field; a field, anterior field.
Figure 13.
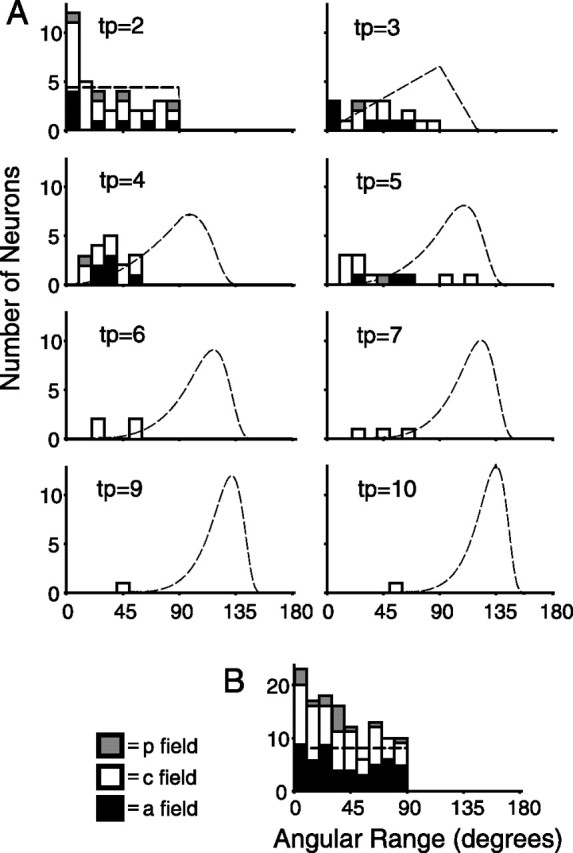
Angular range analysis of similarity of tuning. A, Stacked histograms describing the angular range of each neuron with: 2, 3, 4, 5, 6, 7, 9, and 10 tuned pads (tp). The peak of each stack, in which each stack may contain neurons from each of the three SII region fields, represents the total number of neurons from all of those fields. Dashed lines represent the probability density functions (see equation in Materials and Methods) of angular range for a random distribution of the given number of angular vectors per neuron. An additional histogram (B) shows the angular range of neurons that had only one significantly tuned pad and depicts the angular range between that pad and the pad of second greatest tuning. p field, Posterior field; c field, central field; a field, anterior field.
For the populations of neurons with two to seven tuned pads from each of the three SII region fields, we convolved the equation with itself to determine whether each population mean angular range was significantly smaller than expected by chance. For example, in the case of SII region central field neurons with two tuned pads (there were 25 neurons of this type), we convolved the equation with itself 25 times to determine whether the observed population mean angular range (32.34°) was significantly smaller than chance. The equation was also used to calculate the probability density functions shown in Figure 13. For neurons with only one significantly tuned pad (see Fig. 13B), we performed the same convolution as described above for neurons with two tuned pads, by comparing the tuning of that pad with the tuning of the pad of second greatest tuning (based on one-way ANOVA p value).
We classified each neuron as belonging to the SII region posterior, central, or anterior field based on the subjective multiunit response properties (for details, see Fitzgerald et al., 2004).
Results
Using the motorized tactile stimulation protocol, we studied 928 SII region neurons with RFs on the hand; these were the same 928 neurons studied by Fitzgerald et al. (2004, 2006). A total of 749 (81%) of these neurons were responsive (Fitzgerald et al., 2006, their Materials and Methods) to the oriented bar stimuli, and 218 (23% of the total; 29% of the responsive) neurons exhibited orientation tuning on one or more finger pads. What follows is a description of the orientation tuning characteristics of these neurons and a comparison of these characteristics between neurons in the posterior field (21 tuned neurons of 146 total neurons, 14%), central field (122 of 372, 33%), and anterior field (75 of 410, 18%), and these proportions are significantly different [one-way ANOVA, p < 0.001; central field > posterior field, central field > anterior field, Tukey's honestly significant difference (HSD) post hoc test, p < 0.001]. Here we describe the following: the number of tuned pads per tuned neuron; the somatotopic distribution of tuned pads; the preferred orientations; standard measures of tuning such as aspect ratio, bandwidth, and Gaussian curve fits; the relative strengths of responsiveness of tuned and untuned excitatory pads; and for neurons with multiple tuned pads, the similarity of preferred orientations.
Examples of tuned neurons
Figures 1–4 show raster plots, peristimulus time histograms (PSTHs), and orientation tuning curves for four example tuned neurons from the central field. Figure 1 shows a neuron that had seven tuned pads. The PSTHs show that, for this neuron, the tuning properties (i.e., the differences between the preferred and nonpreferred orientations) evolve rapidly and are sustained throughout the response. Furthermore, the center of the RF was located on the distal pads of D2 and D3 and showed a mild drop off in responsiveness as one progresses across separate digits and a sharp drop off as one progresses within the digits. Although the degree of tuning observed on the middle pad of D4 (D4m) and the proximal pad of D3 (D3p) did not reach statistical significance, these pads also appear to show tuning. This neuron was typical of the large majority of tuned neurons in that the tuning arose from different excitatory firing rates at the different orientations. What is remarkable about the responses of this neuron is the obvious similarity in preferred orientation across the different pads (Fig. 1, bottom). Below (see Figs. 11–13) we show that such similarity is much greater than expected by chance for the populations of neurons with multiple tuned pads, which suggests that these neurons play an integrative function in processing tactile shape information.
Figure 1.
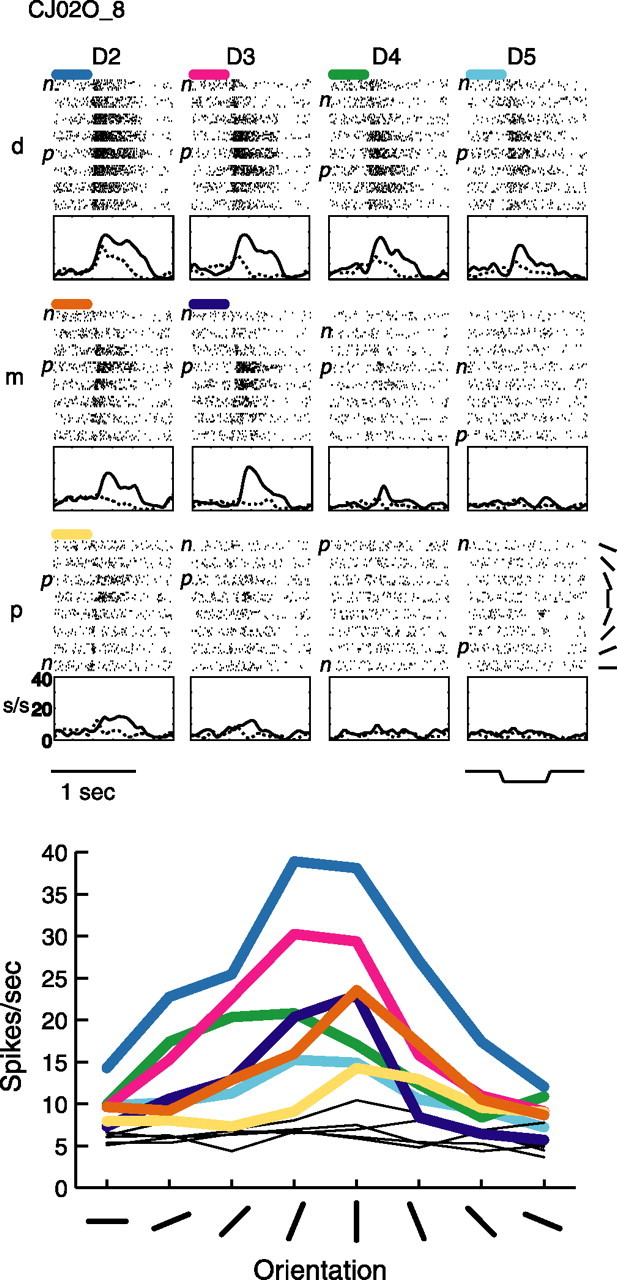
Example tuned neuron CJ02O_8. Shown are raster plots and PSTHs (top) for all 12 stimulated pads of this central field neuron, as well as orientation tuning curves for all 12 pads (bottom). In the rasters, stimulus trials are first sorted into the 12 stimulated finger pads (D2–D5, d–p) and then, within each pad, are sorted by the orientation of the bar (see top, bottom right panel). The bar stimulus indentation profile is also shown (top, bottom right panel). Each PSTH graph is shown below its corresponding finger pad, and only the preferred (highest firing rate; solid line) and nonpreferred (lowest firing rate; dashed line) orientation rates are plotted after convolving these rates with a Gaussian. The short, colored bars above the raster plots indicate tuned pads and correspond to the colored tuning curves shown in the orientation tuning plot at the bottom. Each point in each tuning curve corresponds to the mean evoked firing rate during the 500 ms indentation of the oriented bar at the given orientation on the given finger pad. The thin black lines in the orientation tuning plot represent untuned pads. D, Digit; d, distal; m, middle; p, proximal; p, preferred orientation; n, nonpreferred orientation; s/s, spikes per second.
Figure 2.
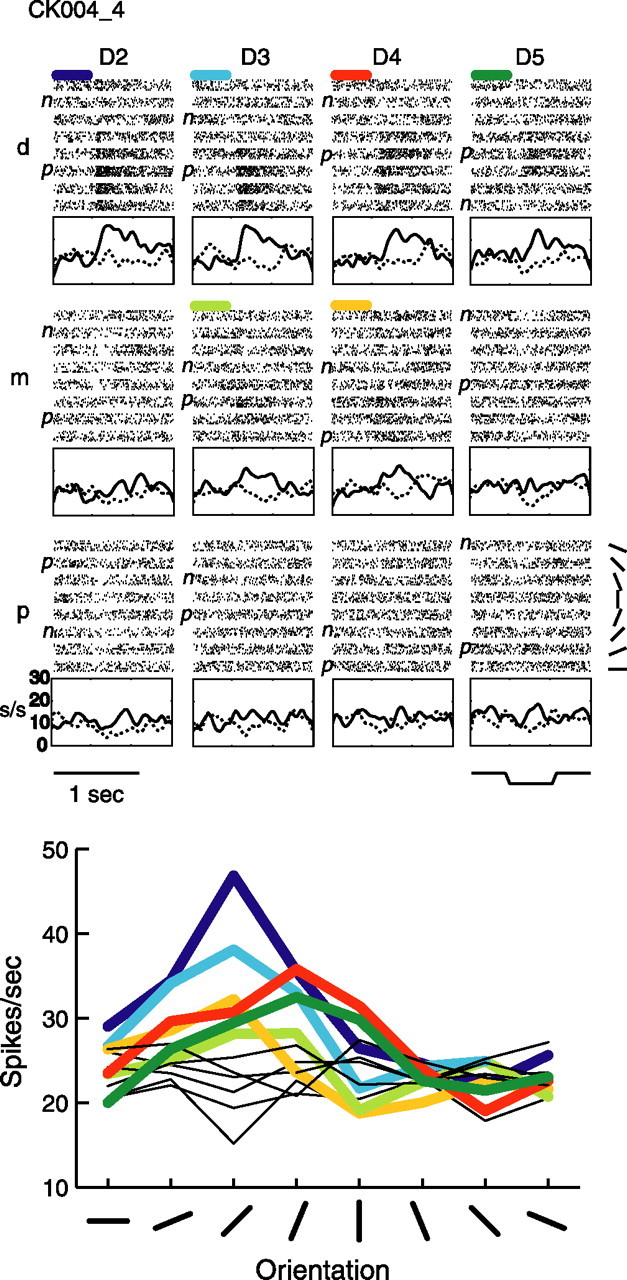
Example tuned neuron CK004_4. Raster, PSTH, and orientation tuning plots are arranged as in Figure 1, with the same abbreviations, for this central field neuron.
Figure 3.
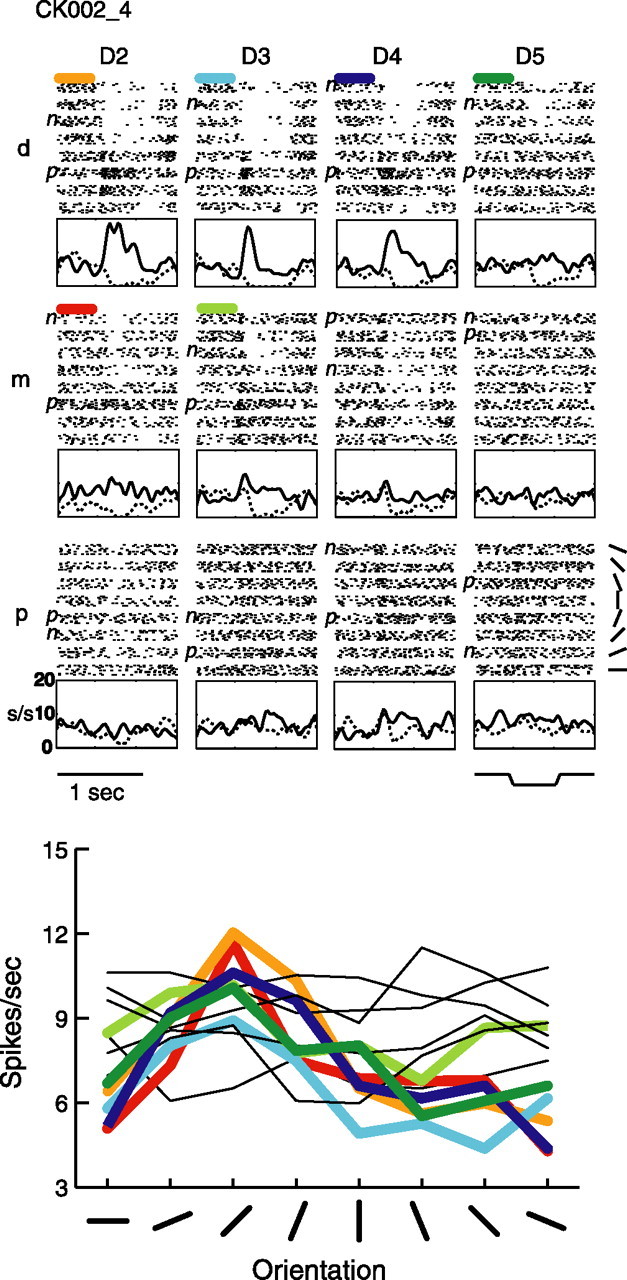
Example tuned neuron CK002_4. Raster, PSTH, and orientation tuning plots are arranged as in Figure 1, with the same abbreviations, for this central field neuron.
Figure 4.
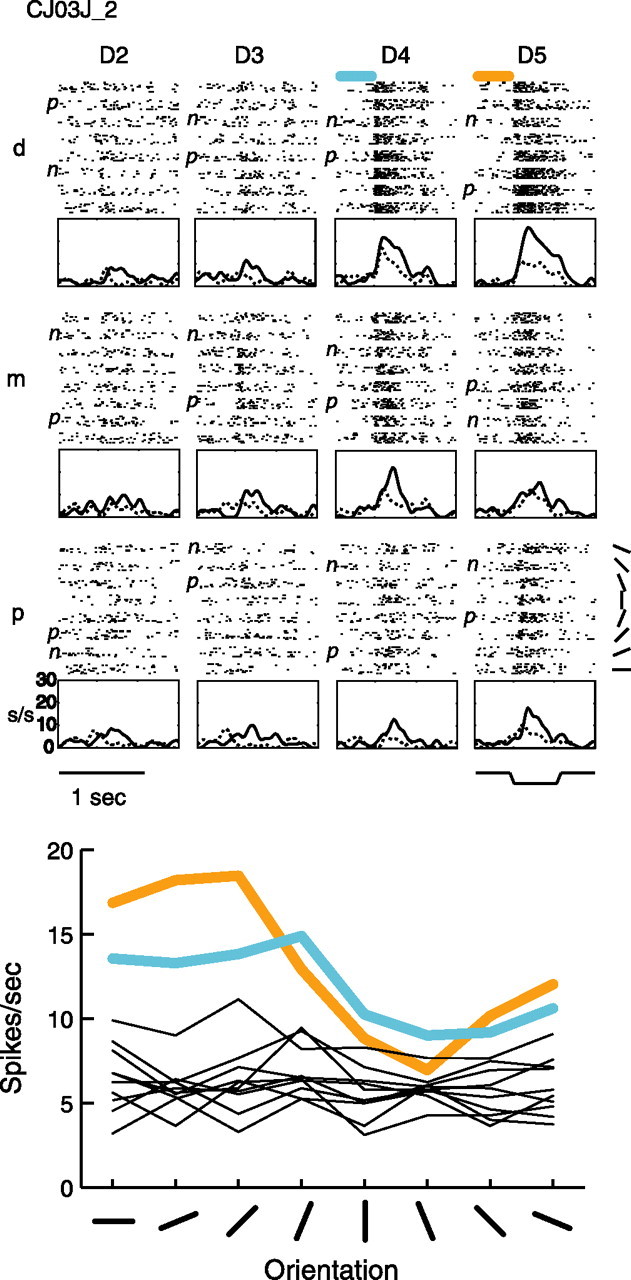
Example tuned neuron CJ03J_2. Raster, PSTH, and orientation tuning plots are arranged as in Figure 1, with the same abbreviations, for this central field neuron.
Figure 11.
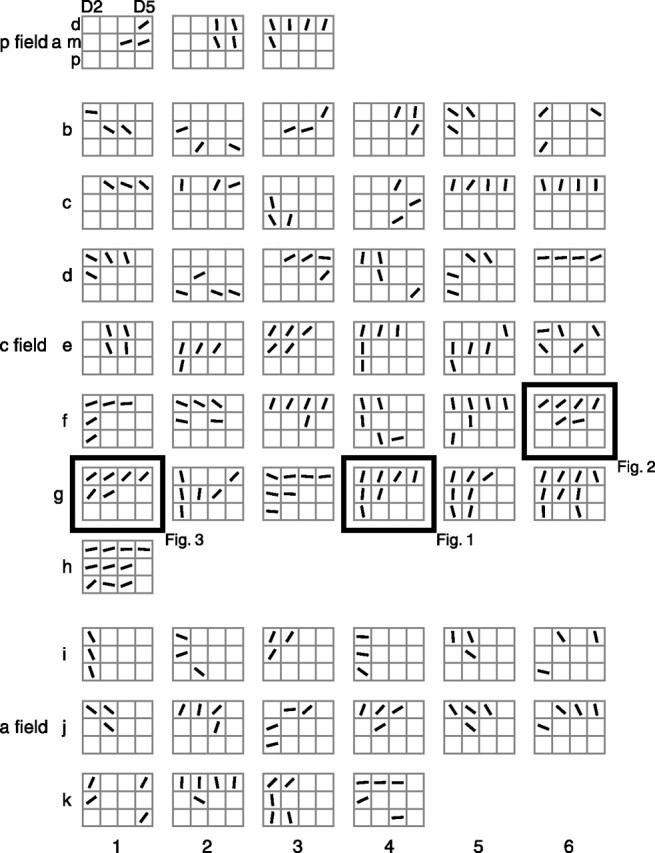
Preferred orientation diagrams. Shown are diagrams of all 56 neurons with three or more tuned pads. Each gray 3 × 4 grid represents the 12 pads of D2–D5 for a single neuron (as shown for the top left diagram), with the top row of each grid representing the distal pads and the left column representing D2 (in which left-hand and right-hand RFs are interspersed; right-hand RFs are reflected leftward, although their preferred orientations are not reflected). Each black oriented line segment within a square represents the preferred orientation (mean angular vector) of that tuned pad. a represents posterior field neurons, b–h represent central field neurons, and i–k represent anterior field neurons. Within each field, the diagrams are arranged in ascending order based on number of tuned pads. The example neurons from Figures 1–3 are framed and labeled. p field, Posterior field; c field, central field; a field, anterior field.
Figure 2 shows an example neuron that was tuned on six pads. This neuron also showed a sustained increase in response during indentation of the preferred orientation; however, the bandwidth of tuning was sharper than that of the neuron shown in Figure 1. What is particularly interesting about this neuron is that there appears to be a slight shift in the preferred orientation between digits D2 and D3 versus digits D4 and D5, demonstrating that some neurons have pads with similar but not identical tuning properties.
The third example neuron (Fig. 3) shows a very different tuning pattern. For this neuron, the tuning is based primarily on inhibitory rather than excitatory mechanisms, which was not commonly observed in the tuned neurons. This neuron also has six tuned pads, and the tuning across these pads is primarily based on a suppression of the response at some orientations, with weak excitation at other orientations.
The final example neuron is shown in Figure 4. This neuron has two tuned pads (D4d and D5d) and six untuned pads (D2m, D3m, D4m, D4p, D5m, D5p). This neuron is different from the other three examples in that, for the tuned pads, the initial response to the oriented bar is not tuned, and the tuning is the result of a longer sustained response at the more responsive orientations. This neuron was more typical of the population of tuned neurons in that it had only a few tuned pads that were outnumbered by untuned pads.
Some neurons have multiple tuned pads
The distribution of the number of tuned pads per tuned neuron is shown in Figure 5. Because 12 pads were stimulated, this number can be as high as 12, although 10 tuned pads was the largest number that we observed for a single neuron. Most tuned neurons had only a few tuned pads and also tended to have untuned excitatory and/or untuned inhibitory pads that together usually outnumbered the tuned pads (Fitzgerald et al., 2006). On average, tuned posterior field neurons had 1.62 tuned pads, tuned central field neurons had 2.33 tuned pads, and tuned anterior field neurons had 1.69 tuned pads, and these three means are significantly different (Table 1) (one-way ANOVA, p < 0.05; central field > anterior field, Tukey's HSD post hoc test, p < 0.05). These results suggest that the central field is more involved in spatial form processing than the other two fields.
Figure 5.

Tuned pads per tuned neuron. A neuron is defined as tuned if it had one or more pads that passed a one-way ANOVA for having different evoked firing rates for the eight bar orientations. p, Posterior field; c, central field; a, anterior field.
Table 1.
Standard measures of orientation tuning
| Fig. 5, T pads | Fig. 7, AR | Fig. 8, BW | Fig. 9, Gaus r2 | |||||||
|---|---|---|---|---|---|---|---|---|---|---|
| All | Mean | Best | All | Mean | Best | All | Mean | Best | ||
| p field | ||||||||||
| n | 21 | 34 | 21 | 21 | 34 | 21 | 21 | 34 | 21 | 21 |
| Avg | 1.62 | 0.775 | 0.765 | 0.769 | 58.24 | 58.55 | 62.14 | 0.821 | 0.815 | 0.805 |
| SD | 1.12 | 0.154 | 0.162 | 0.157 | 24.22 | 24.18 | 26.53 | 0.166 | 0.139 | 0.198 |
| Range | 1–5 | 0.434–1.00 | 0.434–1.00 | 0.434–1.00 | 22.5–112.5 | 22.5–112.5 | 22.5–112.5 | 0.096–0.987 | 0.380–0.951 | 0.096–0.978 |
| c field | ||||||||||
| n | 122 | 284 | 122 | 122 | 284 | 122 | 122 | 284 | 122 | 122 |
| Avg | 2.33 | 0.686 | 0.671 | 0.660 | 71.62 | 71.52 | 70.64 | 0.844 | 0.814 | 0.832 |
| SD | 1.87 | 0.170 | 0.169 | 0.173 | 27.16 | 22.38 | 25.27 | 0.150 | 0.152 | 0.157 |
| Range | 1–10 | 0.270–1.00 | 0.270–1.00 | 0.270–1.00 | 22.5–135.0 | 22.5–123.75 | 22.5–112.5 | 0.004–0.999 | 0.203–0.999 | 0.203–0.999 |
| a field | ||||||||||
| n | 75 | 127 | 75 | 75 | 127 | 75 | 75 | 127 | 75 | 75 |
| Avg | 1.69 | 0.758 | 0.738 | 0.735 | 60.06 | 56.06 | 55.50 | 0.798 | 0.774 | 0.776 |
| SD | 1.17 | 0.169 | 0.173 | 0.180 | 28.36 | 25.29 | 26.76 | 0.219 | 0.238 | 0.243 |
| Range | 1–5 | 0.351–1.00 | 0.351–1.00 | 0.351–1.00 | 22.5–135.0 | 22.5–135.0 | 22.5–135.0 | 0.000–0.997 | 0.005–0.990 | 0.005–0.990 |
| ANOVA | 0.012 | 0.000 | 0.006 | 0.002 | 0.000 | 0.000 | 0.000 | 0.044 | 0.317 | 0.137 |
| Tukey's HSD | ||||||||||
| p versus c | 0.147 | 0.010 | 0.052 | 0.022 | 0.020 | 0.054 | 0.349 | 0.737 | 1.00 | 0.819 |
| p versus a | 0.981 | 0.857 | 0.797 | 0.699 | 0.936 | 0.904 | 0.553 | 0.777 | 0.647 | 0.815 |
| c versus a | 0.020 | 0.000 | 0.021 | 0.010 | 0.000 | 0.000 | 0.000 | 0.035 | 0.306 | 0.115 |
T, Tuned; AR, aspect ratio; BW, bandwidth; Gaus, Gaussian; All, all tuned pads; Mean, mean of all tuned pads for each tuned neuron; Best, just the best tuned pad of each tuned neuron; p, posterior field; c, central field; a, anterior field; n, number of neurons or pads; Avg, average/mean; ANOVA, p value of one-way ANOVA comparing the means of the three SII region fields; Tukey's HSD, p value of Tukey's honestly significant difference post hoc test comparing the means of pairs of fields.
Distal and lateral finger pads more frequently exhibit tuning
Table 2 shows the somatotopic distribution of the 445 tuned finger pads of the 218 tuned neurons, displayed in terms of number of tuned pads for each stimulated finger pad. For the overall distribution, distal pads tend to outnumber middle pads, which in turn outnumber proximal pads, although this trend does not hold for D5. In addition, D2 tends to be better represented than D3 and D4, which are similarly represented, and D5 is least well represented. In terms of the three SII region fields, the central and anterior fields show similar trends, and there are few data for the posterior field, although in this field D5 may be overrepresented.
Table 2.
Somatotopic distribution of orientation tuned pads
| Number of tuned pads | Finger pad | ||||||||||||
|---|---|---|---|---|---|---|---|---|---|---|---|---|---|
| D2d | D2m | D2p | D3d | D3m | D3p | D4d | D4m | D4p | D5d | D5m | D5p | Totals | |
| p field | 3 | 2 | 3 | 3 | 0 | 1 | 2 | 3 | 0 | 9 | 4 | 4 | 34 |
| c field | 43 | 38 | 21 | 33 | 23 | 12 | 43 | 16 | 10 | 28 | 5 | 12 | 284 |
| a field | 30 | 17 | 12 | 19 | 10 | 6 | 11 | 2 | 3 | 5 | 3 | 9 | 127 |
| Totals | 76 | 57 | 36 | 55 | 33 | 19 | 56 | 21 | 13 | 42 | 12 | 25 | 445 |
p, Posterior; c, central; a, anterior.
All orientations are represented
We next determined whether all orientations are represented in the three fields by examining the distribution of preferred orientations, calculated here simply as the orientation of highest evoked firing rate for each tuned pad. Inspection of Figure 6 reveals that all eight orientations were represented in each of the three SII region fields, although not necessarily in equal numbers: in the posterior field, there is a maximum at 0° (mediolateral/horizontal) and 90° (distal-proximal/vertical); in the central field, there is a maximum at 90°; and in the anterior field, there is a maximum at 45° (oblique). However, not all of these apparent non-uniformities were statistically significant, because only the central field and anterior field all tuned pads distributions differ significantly from uniform (Rayleigh's test, p < 0.05).
Figure 6.
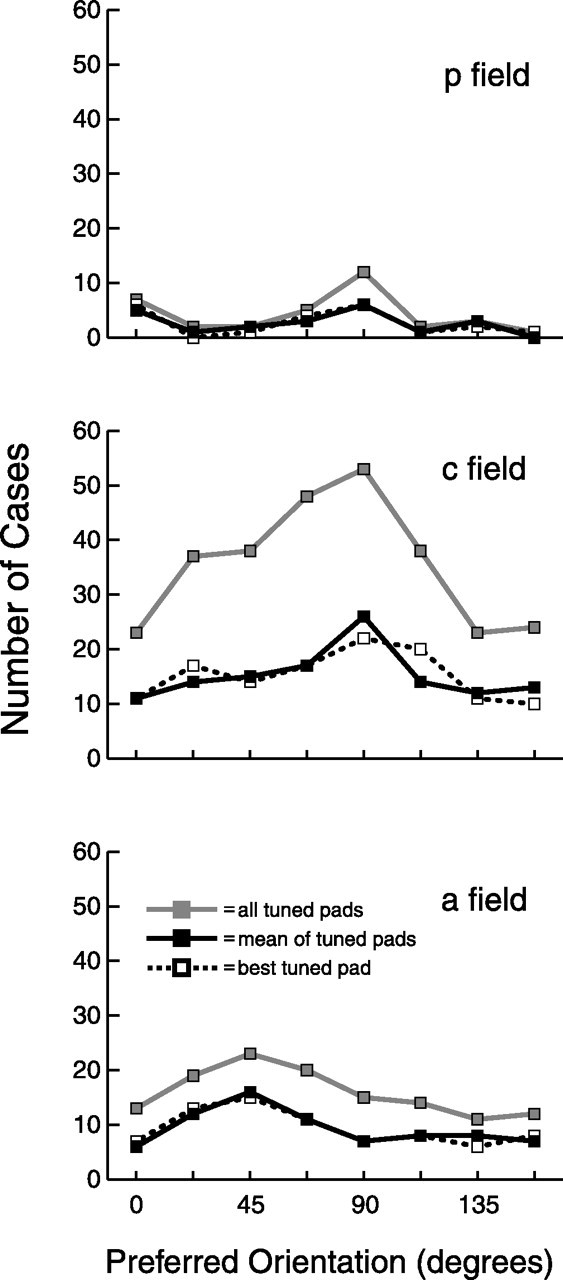
Preferred orientation. Preferred orientation is defined here as the orientation of highest evoked firing rate for the eight bar orientations. All tuned pads indicate the preferred orientations of the entire set of tuned pads of all tuned neurons. Mean of tuned pads indicates the mean preferred orientation of the tuned pads of each tuned neuron. Best tuned pad indicates the preferred orientation of the pad with highest evoked rate at its preferred orientation of the tuned pads of each tuned neuron. p, Posterior field; c, central field; a, anterior field.
Some neurons show robust tuning with standard measures
In Figures 7 and 8, we used two standard measures, aspect ratio and bandwidth, to describe the orientation tuning of SII region neurons. Aspect ratio is defined as follows: (preferred orientation firing rate − nonpreferred orientation firing rate)/preferred orientation firing rate, where preferred and nonpreferred correspond to the maximum and minimum evoked firing rates, respectively, of the eight different bar orientations for an individual tuned pad. Figure 7 shows that the average aspect ratio in all three fields, for all three measures, was 0.73; for perspective, an aspect ratio of 0.75 corresponds to a 4:1 ratio of firing rate between the preferred orientation and the nonpreferred orientation. There were significant differences (one-way ANOVA, Tukey's HSD post hoc test, p < 0.05) between the three fields for all three measures of aspect ratio, as shown in Figure 7 and Table 1, which reveals that posterior and anterior field neurons show better tuning (i.e., have greater aspect ratios) than central field neurons.
Figure 7.
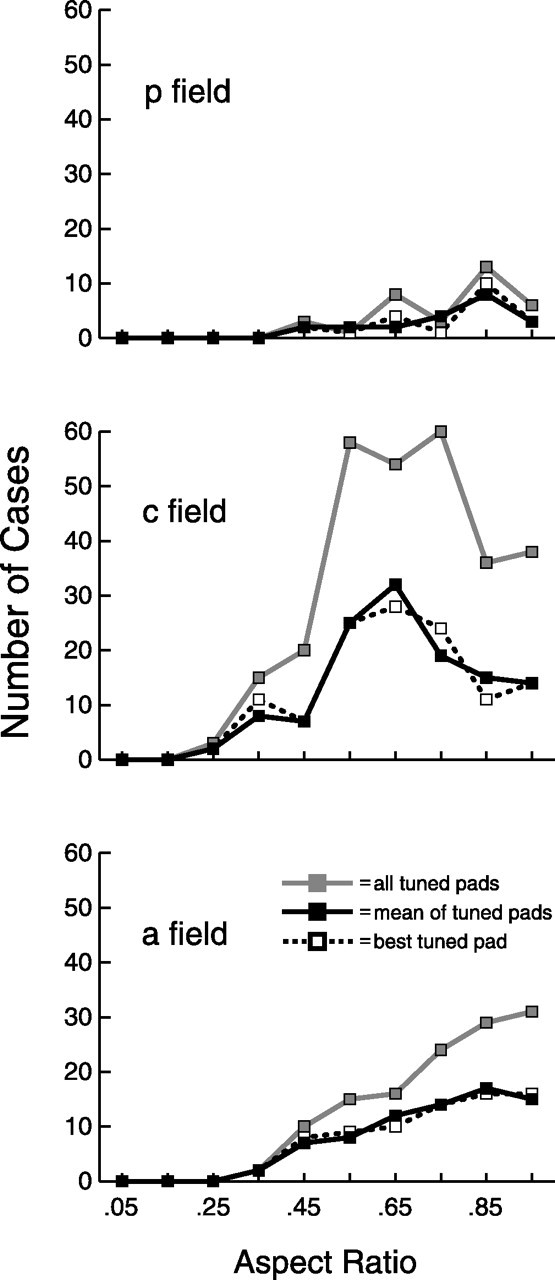
Aspect ratio. Aspect ratio is defined as follows: (preferred orientation firing rate − nonpreferred orientation firing rate)/preferred orientation firing rate, where preferred and nonpreferred correspond to the maximum and minimum evoked firing rates, respectively, of the eight different bar orientations for an individual tuned pad. All tuned pads, mean of tuned pads, and best tuned pad are defined as in Figure 6.
Figure 8.
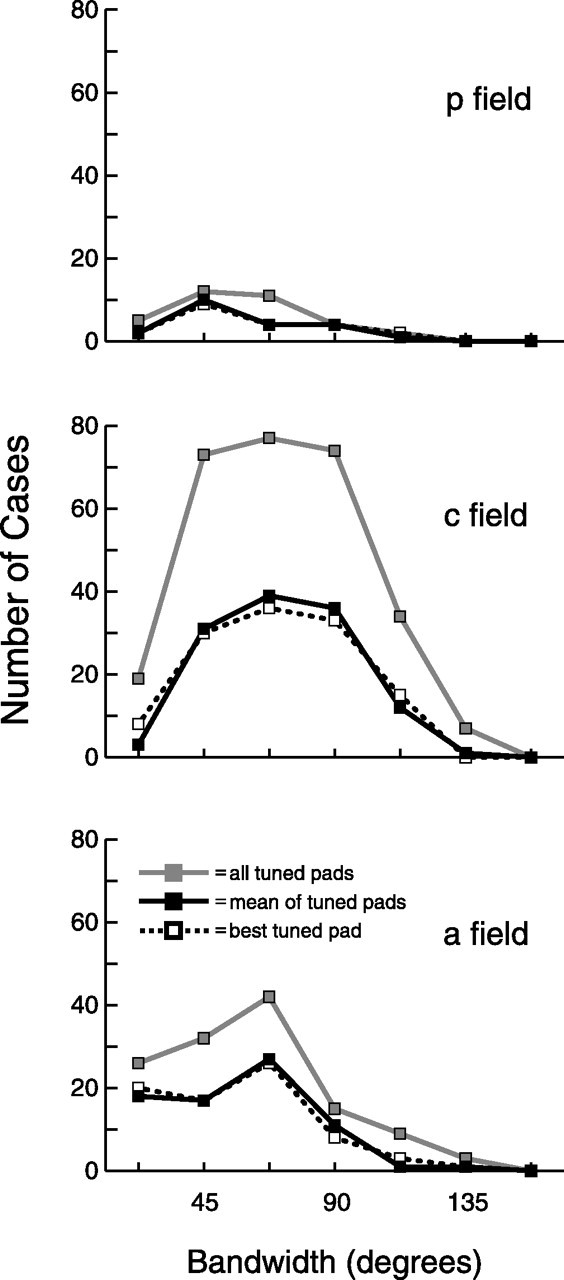
Bandwidth. Bandwidth is defined as the width at half peak of the orientation tuning curve of each tuned pad. All tuned pads, mean of tuned pads, and best tuned pad are defined as in Figure 6.
Figure 8 shows the distribution of bandwidths of tuned SII region neurons. Bandwidth is defined as the width at half peak of the orientation tuning curve of each tuned pad. The average bandwidth in all three fields, for all three measures, was 63°. There were significant differences (one-way ANOVA, Tukey's HSD post hoc test, p < 0.05) between the three fields for all three measures of bandwidth, as shown in Figure 8 and Table 1, which reveals that posterior and anterior field neurons are more sharply tuned (i.e., have narrower bandwidths) than central field neurons. Therefore, whereas central field neurons more frequently exhibit tuned responses, neurons in the flanking fields show better and more sharply tuned responses.
The tuning curves are well fit by Gaussians
We determined how well SII region tuning curves are fit by two-dimensional, noncircular Gaussians by fitting such Gaussians to the tuning curve of each tuned pad (Fig. 9). The average r2 value in all three fields, for all three measures, was 0.81, which is consistent with our observation that most SII region tuning curves were unimodal and symmetrically distributed around the preferred orientation. The only significant difference in r2 value (one-way ANOVA, Tukey's HSD post hoc test, p < 0.05) between the three fields, as shown in Figure 9 and Table 1, was for all tuned pads, with central field neurons having greater values than anterior field neurons.
Figure 9.
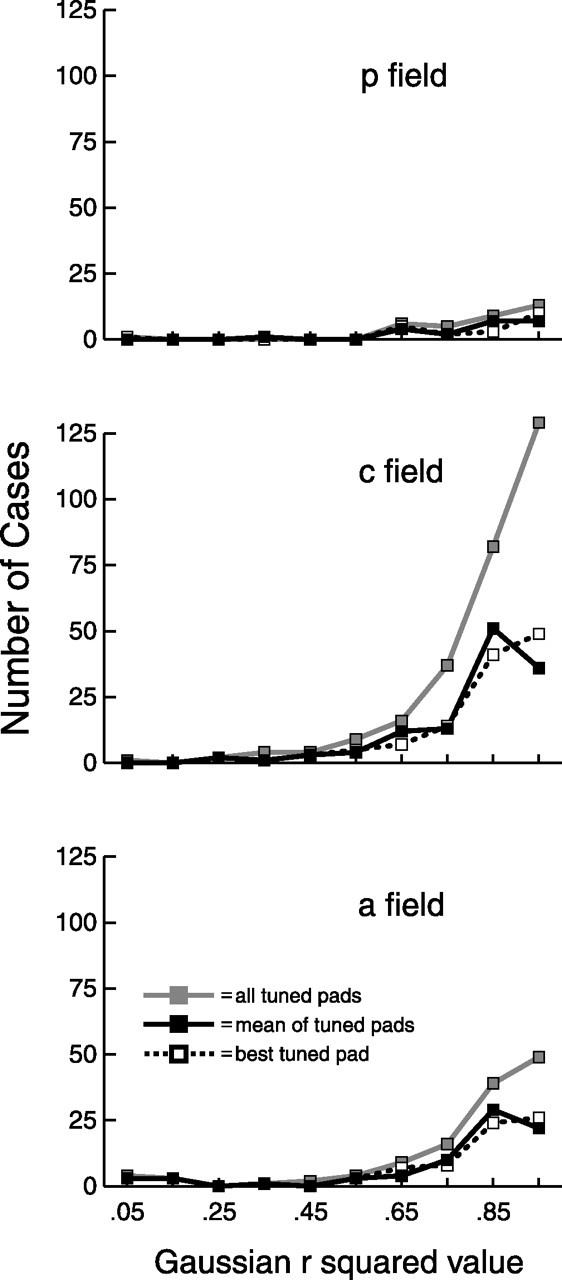
Gaussian r2 value. Noncircular, two-dimensional Gaussians were fit to the tuning curve of each pad, which consisted of the mean evoked firing rates for the eight bar orientations. Each Gaussian had four free parameters: mean, SD, amplitude, and horizontal asymptote. All tuned pads, mean of tuned pads, and best tuned pad are defined as in Figure 6.
Most tuned pads are more responsive than untuned excitatory pads
Previously, we reported that SII region neurons with tuned pads tend to have additional untuned pads (Fitzgerald et al., 2006). Here we compare the relative responsiveness of these two kinds of pads. If, for example, the peak firing rate of the tuned pads of a neuron is much lower than the peak firing rate of its untuned excitatory pads, then perhaps the tuning is not an important functional property of that neuron. Figure 10 shows scatter plots of the mean peak firing rate of tuned pads versus mean peak firing rate of untuned excitatory pads for neurons with both of these types of pads, for the three SII region fields. Mean peak firing rate is defined as the preferred orientation firing rate for each tuned or untuned excitatory pad, averaged across each of these two groups of pads, per neuron. (Although untuned excitatory pads are not by definition tuned, peak firing rate was also used for such pads to make the comparison with tuned pads unbiased.) Figure 10 shows that, for all three fields, tuned pads tend to have higher peak firing rates than untuned excitatory pads, which suggests that the tuning is an important functional property of these neurons.
Figure 10.

Firing rate of tuned pads versus untuned excitatory pads. We calculated the mean peak firing rate (in which peak rate is defined as the preferred orientation firing rate) for each tuned or untuned excitatory pad and averaged across each of these two groups of pads, per neuron. Each point represents one neuron that had one or more tuned pads and one or more untuned excitatory pads. Although untuned excitatory pads are not by definition tuned, peak firing rate was also used for such pads to make the comparison with peak firing rate of tuned pads unbiased. p, Posterior field; c, central field; a, anterior field.
We performed an additional analysis on each of these neurons to determine whether the tuned pad of highest peak firing rate had a greater firing rate than that of the untuned excitatory pad of highest peak rate. Here are the results in terms of number of neurons (tuned pad greater, tie, untuned excitatory pad greater): posterior field (13, 0, 3), central field (91, 2, 16), anterior field (54, 2, 12), and total (158, 4, 31). These results are consistent with those in Figure 10, indicating that tuned pads tend to have higher peak rates than untuned excitatory pads.
Many tuned neurons show similar preferred orientations on different pads
As described previously, many of the SII region neurons that we studied, such as those shown in Figures 1–4, appear to have similar preferred orientations on their tuned pads. Figure 11 shows diagrams of the preferred orientations of each neuron (n = 56) with three or more tuned pads. Inspection of this figure indicates that most of these neurons had similar preferred orientations on all of their tuned pads, although there are exceptions such as the neurons shown in positions b2 and e6. We performed two analyses to quantify this trend. Figure 12 shows scatter plots of the preferred orientations of the best two (highest peak firing rate) tuned pads for neurons with two or more tuned pads. In each of the three graphs, well over half of the points fall within the two gray dashed lines, which mark the distance midway between most similar (equal) and least similar (90° different; black dashed lines) orientations.
In Figure 13, we further quantified the similarity of tuning for each neuron by calculating the minimum angle (angular range) that subtended the angular vectors representing the preferred orientation of each of the tuned pads, and then tested whether the mean angular range of each population of neurons with n tuned pads (for each SII region field) was significantly smaller than expected by chance (Table 3). Inspection of the graphs in Figure 13 reveals that the observed angular ranges cluster on the left side of the probability distributions, indicating that SII region angular ranges tend to be smaller than expected by chance, and this trend was statistically significant (p < 0.05) for the following: posterior field groups of neurons with one, three, four, and five tuned pads; all central field groups of neurons (n = 1–10 tuned pads); and anterior field groups of neurons with three, four, and five tuned pads. In addition, when we combined the data from all three fields, each group of neurons (n = 1–10 tuned pads) was significant (p < 0.005). These results demonstrate that the pattern of tuning across pads for SII region neurons is highly structured and organized.
Table 3.
Data from similarity of tuning analysis (Fig. 13)
| Fig. 13, Sim T | ||||||||||
|---|---|---|---|---|---|---|---|---|---|---|
| T pads | 1 | 2 | 3 | 4 | 5 | 6 | 7 | 8 | 9 | 10 |
| p field | ||||||||||
| n | 14 | 4 | 1 | 1 | 1 | 0 | 0 | 0 | 0 | 0 |
| Mean | 31.63 | 39.25 | 20.12 | 19.76 | 40.15 | NA | NA | NA | NA | NA |
| SD | 22.53 | 31.07 | NA | NA | NA | NA | NA | NA | NA | NA |
| Range | 1.35–85.74 | 6.66–80.88 | NA | NA | NA | NA | NA | NA | NA | NA |
| p value | 0.031 | 0.345 | 0.041 | 0.005 | 0.013 | NA | NA | NA | NA | NA |
| c field | ||||||||||
| n | 60 | 25 | 10 | 10 | 8 | 4 | 3 | 0 | 1 | 1 |
| Mean | 37.16 | 32.34 | 46.15 | 36.45 | 42.54 | 38.57 | 46.40 | NA | 44.90 | 52.52 |
| SD | 25.68 | 27.84 | 24.66 | 14.17 | 38.90 | 19.17 | 19.36 | NA | NA | NA |
| Range | 0.64–88.03 | 0.97–80.15 | 18.30–88.99 | 19.76–59.29 | 10.81–113.66 | 21.47–57.22 | 28.67–67.05 | NA | NA | NA |
| p value | 0.014 | 0.009 | 0.003 | 0.000 | 0.000 | 0.000 | 0.000 | NA | 0.000 | 0.000 |
| a field | ||||||||||
| n | 51 | 8 | 7 | 6 | 3 | 0 | 0 | 0 | 0 | 0 |
| Mean | 39.81 | 31.22 | 32.52 | 36.40 | 49.52 | NA | NA | NA | NA | NA |
| SD | 27.93 | 30.32 | 25.36 | 11.21 | 21.87 | NA | NA | NA | NA | NA |
| Range | 0.00–89.86 | 5.00–83.87 | 3.67–64.52 | 23.10–56.08 | 24.69–65.90 | NA | NA | NA | NA | NA |
| p value | 0.099 | 0.075 | 0.000 | 0.000 | 0.000 | NA | NA | NA | NA | NA |
| Combined | ||||||||||
| n | 125 | 37 | 18 | 17 | 12 | 4 | 3 | 0 | 1 | 1 |
| Mean | 37.63 | 32.85 | 39.41 | 35.45 | 44.09 | 38.57 | 46.40 | NA | 44.90 | 52.52 |
| SD | 26.23 | 27.95 | 24.84 | 12.98 | 32.57 | 19.17 | 19.36 | NA | NA | NA |
| Range | 0.00–89.86 | 0.97–83.87 | 3.67–88.99 | 19.76–59.29 | 10.81–113.66 | 21.47–57.22 | 28.67–67.05 | NA | NA | NA |
| p value | 0.002 | 0.003 | 0.000 | 0.000 | 0.000 | 0.000 | 0.000 | NA | 0.000 | 0.000 |
| ANOVA/t test | 0.579 | 0.890 | 0.285 | 0.995 | 0.780 | NA | NA | NA | NA | NA |
| Tukey's HSD | ||||||||||
| p versus c | 0.759 | 0.896 | NA | NA | NA | NA | NA | NA | NA | NA |
| p versus a | 0.559 | 0.891 | NA | NA | NA | NA | NA | NA | NA | NA |
| c versus a | 0.857 | 0.995 | NA | NA | NA | NA | NA | NA | NA | NA |
Sim T, Similarity of tuning on different finger pads; T, tuned; p, posterior field; c, central field; a, anterior field; Combined, data from all three SII region fields; n, number of neurons; Mean, mean angular range; p value, p value testing whether the mean angular range is smaller than chance; ANOVA/t test, p value of one-way ANOVA (or two-tailed t test) comparing the mean angular range of the three fields (or two fields if n = 0, 1 for one of the fields); Tukey's HSD, p value of Tukey's honestly significant difference post hoc test comparing the mean angular range of pairs of fields; NA, not applicable.
Discussion
Tuning is common on a limited number of pads in SII region neurons
We observed orientation tuning on one or more finger pads in 14% of posterior field neurons, 33% of central field neurons, and 18% of anterior field neurons, which indicates that tuning, especially in the central field, is commonly found in SII region neurons. Recent studies (DiCarlo et al., 1998; DiCarlo and Johnson, 2000; Hsiao et al., 2002; Sripati and Johnson, 2002) have shown that a large fraction (∼70%) of the neurons in SI show orientation tuned responses. Because neurons in the SII region receive input from SI cortex, this suggests that neurons in the SII hand region are receiving convergent input from tuned SI neurons and that the SII region serves to integrate information across the hand. However, most of the tuned neurons in the SII region had only one or two tuned pads (Fig. 5), indicating that the tuning of a typical SII region RF does not extend across the hand.
There are several possibilities that might explain the low rate of convergence. The simplest explanation is that the 10 g stimulation force we used was too light to activate some of the finger pads. We find this unlikely because the 10 g force used with the 90°, wedge-shaped bar felt quite robust and salient. Another possibility is that, if the SII region is at an intermediate stage of processing, then additional convergence could be observed in higher-order somatosensory cortical areas that receive input from the SII region, such as somatosensory areas of the insula (Robinson and Burton, 1980; Friedman et al., 1986; Schneider et al., 1993; Fitzgerald et al., 2000). A third possibility is that the rate of convergence would increase if the monkey was performing a behavioral task that required it to attend to the stimuli, because many studies have shown that neurons in the SII region are greatly affected by the focus of attention (Poranen and Hyvarinen, 1982; Hsiao et al., 1993; Sinclair and Burton, 1993; Burton et al., 1997; Jiang et al., 1997; Fitzgerald et al., 1998; Nakama et al., 2000; Steinmetz et al., 2000; Pruett et al., 2001; Meftah et al., 2002; Romo et al., 2002; Sripati and Johnson, 2002; Chapman and Meftah, 2005). Indeed, the last two studies have shown that attention in the SII region functions as a gain.
Tuning in the SII region versus visual cortex
We used standard measures of tuning [preferred orientation (Fig. 6), aspect ratio (Fig. 7), bandwidth (Fig. 8), and Gaussian fits (Fig. 9)] to characterize the tuning of SII region neurons. Figure 6 indicates that all orientations are not equally represented in the central and anterior fields, and the bias toward vertical orientations in the central field may explain human greater sensitivity to edges presented proximal-distally to the finger pad (Essock et al., 1997). However, Craig (1999) reported no anisotropy in orientation discrimination. In V1, both horizontal and vertical orientations may be overrepresented (Mansfield, 1974; Mansfield and Ronner, 1978; De Valois et al., 1982).
Aspect ratio and bandwidth are two other measures that we used to describe tuning in SII region neurons. The average aspect ratio of these neurons was nearly 4:1, which indicates that there is strong tuning in SII region neurons. The average bandwidth was 63°, which is fairly broadly tuned, and is similar to the reported tuning of V4 neurons to visually presented bars (Desimone and Schein, 1987), and more broadly tuned than V1 neurons (Schiller et al., 1976; De Valois et al., 1982). Lower-order somatosensory cortical areas, such as areas of SI including area 3b, may have more narrowly tuned neurons (Pubols and LeRoy, 1977; Hyvarinen and Poranen, 1978; Warren et al., 1986; DiCarlo et al., 1998; DiCarlo and Johnson, 2000; Hsiao et al., 2002). Finally, two-dimensional Gaussians fit the tuning curves of SII region neurons well (average r2 value of 0.81), indicating that these tuning curves tend to be unimodal and may be similar in shape to visual cortical tuning curves (Albright, 1984; McAdams and Maunsell, 1999; Prince et al., 2002). The similarity in orientation selectivity in the visual and somatosensory systems supports the hypothesis that the two systems use common mechanisms for processing shape.
Receptive field properties of tuned SII region neurons
It is unclear from the current study which RF mechanisms give rise to the tuning: any asymmetry in the RF could produce it, including a skin mechanical or geometric anisotropy that exists in each finger pad because it is not a uniformly flat, infinitely broad surface. In addition, a small region of excitation or inhibition offset from the center of the finger pad could produce tuning when a bar is simply rotated around the center of the pad, as it is in the current study, and certain orientations touch the spot and others do not. Alternatively, tuning could arise from oriented bands of excitation or inhibition that align with the bar in certain orientations and do not in others. Finally, tuning could arise from a positionally invariant RF mechanism in which a similar preferred orientation is present at any location within the pad. One of the principal results of the current study, that a tuned SII region neuron tends to have a similar preferred orientation on different finger pads (Figs. 11–13), is consistent with any of these types of RF mechanisms and suggests that the RF structures may be similar across the finger pads.
Functional roles of tuned neurons
In our companion work (Fitzgerald et al., 2006), we hypothesized that the multipad RFs could be the kernels that underlie the representation of tactile objects. We showed that many neurons have RFs spatially arrayed across the hand, with a variety of excitatory and/or inhibitory pads, and proposed that individual pads are responsible for coding local features of objects and combinations of pads are responsible for coding the shape of large objects that span multiple fingers. If neurons are coding for large shapes, then one would expect that orientation tuning would not be randomly arrayed across the hand, consistent with the data in Figures 11–13, but instead would be organized with adjacent pads having similar tuning. For example, the neuron shown at position d6 in Figure 11 could be coding contact of the hand with the edge of a table. We also hypothesize that these response properties are modulated by proprioceptive input (Fitzgerald et al., 2004), which provides information about the relative locations of the cutaneous views of the three-dimensional structure of objects.
An alternative interpretation of these results, which does not preclude the previous interpretation, is that the orientation tuned neurons are part of a hierarchical scheme in which neurons at successively higher stages show positional invariance to specific tactile features. As such, neurons at lower stages such as area 3b would be processing orientation information from single finger pads (analogous to neurons in V1), and neurons in the SII region would be processing orientation information independent of where the bars fall on the hand. If the sensory systems are involved in transforming their input into an invariant representation underlying memory and perception (Phillips et al., 1988), then these SII region neurons could lie midway along this transformation pathway.
In either case, the results here suggest that the SII region central field is specialized for processing cutaneous information. In the first paper in this series (Fitzgerald et al., 2004), we reported that neurons in the posterior and anterior fields are sensitive to both cutaneous and proprioceptive input. The results here suggest that these two fields cannot be easily distinguished based on their responses to the bars. We speculate that the strong proprioceptive responses indicate that these two fields may play an integrative role in combining cutaneous and proprioceptive input for representing different features such as the size and/or shape of large objects.
Footnotes
This work was supported by National Institutes of Health Grant NS34086.
References
- Albright TD (1984). Direction and orientation selectivity of neurons in visual area MT of the macaque. J Neurophysiol 52:1106–1130. [DOI] [PubMed] [Google Scholar]
- Burton H, Sinclair RJ (1990). Second somatosensory cortical area in macaque monkeys. I. Neuronal responses to controlled, punctate indentations of glabrous skin on the hand. Brain Res 520:262–271. [DOI] [PubMed] [Google Scholar]
- Burton H, Fabri M, Alloway K (1995). Cortical areas within the lateral sulcus connected to cutaneous representations in areas 3b and 1: a revised interpretation of the second somatosensory area in macaque monkeys. J Comp Neurol 355:539–562. [DOI] [PubMed] [Google Scholar]
- Burton H, Sinclair RJ, Hong SY, Pruett JR, Whang KC (1997). Tactile-spatial and cross-modal attention effects in the second somatosensory and 7b cortical areas of rhesus monkeys. Somatosens Mot Res 14:237–267. [DOI] [PubMed] [Google Scholar]
- Chapman CE, Meftah EM (2005). Independent controls of attentional influences in primary and secondary somatosensory cortex. J Neurophysiol 94:4094–4107. [DOI] [PubMed] [Google Scholar]
- Craig JC (1999). Grating orientation as a measure of tactile spatial acuity. Somatosens Mot Res 16:197–206. [DOI] [PubMed] [Google Scholar]
- Desimone R, Schein SJ (1987). Visual properties of neurons in area V4 of the macaque: sensitivity to stimulus form. J Neurophysiol 57:835–868. [DOI] [PubMed] [Google Scholar]
- De Valois RL, Yund EW, Hepler N (1982). The orientation and direction selectivity of cells in macaque visual cortex. Vision Res 22:531–544. [DOI] [PubMed] [Google Scholar]
- DiCarlo JJ, Johnson KO (2000). Spatial and temporal structure of receptive fields in primate somatosensory area 3b: effects of stimulus scanning direction and orientation. J Neurosci 20:495–510. [DOI] [PMC free article] [PubMed] [Google Scholar]
- DiCarlo JJ, Lane JW, Hsiao SS, Johnson KO (1996). Marking microelectrode penetrations with fluorescent dyes. J Neurosci Methods 64:75–81. [DOI] [PubMed] [Google Scholar]
- DiCarlo JJ, Johnson KO, Hsiao SS (1998). Structure of receptive fields in area 3b of primary somatosensory cortex of the alert monkey. J Neurosci 18:2626–2645. [DOI] [PMC free article] [PubMed] [Google Scholar]
- Disbrow E, Litinas E, Recanzone GH, Padberg J, Krubitzer LA (2003). Cortical connections of the second somatosensory area and the parietal ventral area in macaque monkeys. J Comp Neurol 462:382–399. [DOI] [PubMed] [Google Scholar]
- Essock EA, Krebs WK, Prather JR (1997). Superior sensitivity for tactile stimuli oriented proximally-distally on the finger: implications for mixed Class 1 and Class 2 anisotropies. J Exp Psychol Human Percept Perform 23:515–527. [Google Scholar]
- Fitzgerald PJ, Lane JW, Hsiao SS (1998). Attentional effects in somatosensory cortex during an orientation discrimination task. Soc Neurosci Abstr 24:444.11. [Google Scholar]
- Fitzgerald PJ, Lane JW, Yoshioka T, Nakama T, Hsiao SS (1999). Multi-digit receptive field structures and orientation tuning properties of neurons in SII cortex of the awake monkey. Soc Neurosci Abstr 25:673.8. [Google Scholar]
- Fitzgerald PJ, Mikula SA, Prasad S, Yoshioka T, Hsiao SS (2000). Functional organization and cortical connections of macaque second somatosensory cortex. Soc Neurosci Abstr 25:547.1. [Google Scholar]
- Fitzgerald PJ, Lane JW, Thakur PH, Hsiao SS (2004). Receptive field properties of the macaque second somatosensory cortex: evidence for multiple functional representations. J Neurosci 24:11193–11204. [DOI] [PMC free article] [PubMed] [Google Scholar]
- Fitzgerald PJ, Lane JW, Thakur PH, Hsiao SS (2006). Receptive field (RF) properties of the macaque second somatosensory cortex: RF size, shape, and somatotopic organization. J Neurosci 26:6485–6495. [DOI] [PMC free article] [PubMed] [Google Scholar]
- Friedman DP, Jones EG, Burton H (1980). Representation pattern in the second somatosensory area of the monkey cerebral cortex. J Comp Neurol 192:21–41. [DOI] [PubMed] [Google Scholar]
- Friedman DP, Murray EA, O'Neill JB, Mishkin M (1986). Cortical connections of the somatosensory fields of the lateral sulcus of macaques: evidence for a corticolimbic pathway for touch. J Comp Neurol 252:323–347. [DOI] [PubMed] [Google Scholar]
- Hsiao SS, O'Shaughnessy DM, Johnson KO (1993). (1993) Effects of selective attention on spatial form processing in monkey primary and secondary somatosensory cortex. J Neurophysiol 70:444–447. [DOI] [PubMed] [Google Scholar]
- Hsiao SS, Lane JW, Fitzgerald PJ (2002). Representation of orientation in the somatosensory system. Behav Brain Res 135:93–103. [DOI] [PubMed] [Google Scholar]
- Hubel DH, Wiesel TN (1968). Receptive fields and functional architecture of monkey striate cortex. J Physiol (Lond) 195:215–243. [DOI] [PMC free article] [PubMed] [Google Scholar]
- Hyvarinen J, Poranen A (1978). Movement-sensitive and direction and orientation-selective cutaneous receptive fields in the hand area of the post-central gyrus in monkeys. J Physiol (Lond) 283:523–537. [DOI] [PMC free article] [PubMed] [Google Scholar]
- Jiang W, Tremblay F, Chapman CE (1997). Neuronal encoding of texture changes in the primary and the secondary somatosensory cortical areas of monkeys during passive texture discrimination. J Neurophysiol 77:1656–1662. [DOI] [PubMed] [Google Scholar]
- Mansfield RJW (1974). Neural basis of orientation perception in primate vision. Science 186:133–135. [DOI] [PubMed] [Google Scholar]
- Mansfield RJW, Ronner SF (1978). Orientation anisotropy in monkey visual cortex. Brain Res 149:229–234. [DOI] [PubMed] [Google Scholar]
- Mardia KV, Jupp PE (2000). In: Directional statistics pp. 107Chichester, UK: Wiley.
- McAdams CJ, Maunsell JHR (1999). Effects of attention on orientation-tuning functions of single neurons in macaque cortical area V4. J Neurosci 19:431–441. [DOI] [PMC free article] [PubMed] [Google Scholar]
- Meftah EM, Shenasa J, Chapman CE (2002). Effects of a cross-modal manipulation of attention on somatosensory cortical neuronal responses to tactile stimuli in the monkey. J Neurophysiol 88:3133–3149. [DOI] [PubMed] [Google Scholar]
- Murray EA, Mishkin M (1984). Relative contributions of SII and area 5 to tactile discrimination in monkeys. Behav Brain Res 11:67–83. [DOI] [PubMed] [Google Scholar]
- Nakama T, Lane JW, Fitzgerald PJ, Sripati A, Johnson KO, Yantis S, Hsiao SS (2000). Attentional modulation of bilateral neuronal responses in the secondary somatosensory cortex during an orientation discrimination task. Soc Neurosci Abstr 26:788.8. [Google Scholar]
- Phillips JR, Johnson KO, Hsiao SS (1988). Spatial pattern representation and transformation in monkey somatosensory cortex. Proc Natl Acad Sci USA 85:1317–1321. [DOI] [PMC free article] [PubMed] [Google Scholar]
- Poranen A, Hyvarinen J (1982). Effects of attention on multiunit responses to vibration in the somatosensory regions of the monkey's brain. Electroencephalogr Clin Neurophysiol 53:525–537. [DOI] [PubMed] [Google Scholar]
- Prince SJD, Pointon AD, Cumming BG, Parker AJ (2002). Quantitative analysis of the responses of V1 neurons to horizontal disparity. J Neurophysiol 87:191–208. [DOI] [PubMed] [Google Scholar]
- Pruett JR, Sinclair RJ, Burton H (2000). Response patterns in second somatosensory cortex (SII) of awake monkeys to passively applied tactile gratings. J Neurophysiol 84:780–797. [DOI] [PubMed] [Google Scholar]
- Pruett JR, Sinclair RJ, Burton H (2001). Neural correlates for roughness choice in monkey second somatosensory cortex (SII). J Neurophysiol 86:2069–2080. [DOI] [PubMed] [Google Scholar]
- Pubols LM, LeRoy RF (1977). Orientation detectors in the primary somatosensory neocortex of the raccoon. Brain Res 129:61–74. [DOI] [PubMed] [Google Scholar]
- Randolph M, Semmes J (1974). Behavioral consequences of selective subtotal ablations in the postcentral gyrus of Macaca mulatta Brain Res 70:55–70. [DOI] [PubMed] [Google Scholar]
- Robinson CJ, Burton H (1980). Organization of somatosensory receptive fields in cortical areas 7b, retroinsula, postauditory, and granular insula of M. fascicularis J Comp Neurol 192:69–92. [DOI] [PubMed] [Google Scholar]
- Romo R, Hernandez A, Zainos A, Lemus L, Brody CD (2002). Neuronal correlates of decision-making in secondary somatosensory cortex. Nat Neurosci 5:1217–1225. [DOI] [PubMed] [Google Scholar]
- Schiller PH, Finlay BL, Volman SF (1976). Quantitative studies of single-cell properties in monkey striate cortex. II. Orientation specificity and ocular dominance. J Neurophysiol 39:1320–1333. [DOI] [PubMed] [Google Scholar]
- Schneider RJ, Friedman DP, Mishkin M (1993). A modality-specific somatosensory area within the insula of the rhesus monkey. Brain Res 621:116–120. [DOI] [PubMed] [Google Scholar]
- Sinclair RJ, Burton H (1993). Neuronal activity in the second somatosensory cortex of monkeys (Macaca mulatta) during active touch of gratings. J Neurophysiol 70:331–350. [DOI] [PubMed] [Google Scholar]
- Sripati AP, Johnson KO (2002). Cortical gain mechanisms consistent with attentional modulation. Soc Neurosci Abstr 28:55.5. [Google Scholar]
- Steinmetz PN, Roy A, Fitzgerald PJ, Hsiao SS, Johnson KO, Niebur E (2000). Attention modulates synchronized neuronal firing in primate somatosensory cortex. Nature 404:187–190. [DOI] [PubMed] [Google Scholar]
- Warren S, Hamalainen HA, Gardner EP (1986). Objective classification of motion- and direction-sensitive neurons in primary somatosensory cortex of awake monkeys. J Neurophysiol 56:598–622. [DOI] [PubMed] [Google Scholar]