

Abstract
Improving the anti-demineralizing/remineralizing and mechanical properties of amorphous calcium phosphate (ACP) composites has been the focus of our recent research. In this study, an ethoxylated bisphenol A dimethacrylate (EBPADMA) was blended with triethylene glycol dimethacrylate (TEGDMA), 2-hydroxyethyl methacrylate (HEMA) and methacryloxyethyl phthalate (MEP) to form three experimental resins. The resins were formulated to have 3 different EBPADMA/TEGDMA molar ratios (0.50, 0.85 and 1.35) and a constant HEMA/MEP molar ratio (8.26 ± 0.33). The resins were photo-activated for visible light polymerization and composites were prepared by admixture of either unmilled or milled zirconia-ACP filler (40 % by mass). One aim of the study was to test if improved ion release can be achieved by elevating the EBPADMA/TEGDMA ratio while lowering the level of surface active methacryloxyethyl phthalate in the resin without adversely affecting the strength, degree of vinyl conversion and water sorption of composites. A second aim was to assess the effect of using milled vs. unmilled ACP on these properties of the various composites. Both copolymers blends and composites were assessed for the biaxial flexure strength, degree of vinyl conversion and water sorption, and the composites were evaluated for the mineral ion release as well. Overall ion release of all composites was significantly above the theoretical minimum necessary for remineralization and calcium ion release was not impeded by calcium binding with the carboxylic acid groups of methacryloxyethyl phthalate. Increased supersaturation was attained with increasing EBPADMA/TEGDMA ratio in the resin. Variations in resin composition had no effect on the biaxial flexure strength or degree of vinyl conversion of composites. The biaxial flexure strength values of the milled ACP composites were higher than the biaxial flexure strength values of unmilled ACP composites (56 % and 79 %, respectively for dry and wet specimens). Degree of vinyl conversion of composites was only moderately reduced (13.6 % and 7.3 %, for unmilled and milled ACP, respectively) compared to unfilled resins [(80.2 ± 3.1) %]. Water sorption decreased in the following order: unmilled ACP composites > milled ACP composites ≥ copolymer blends. Fine-tuning of the resin and utilizing milled ACP filler improved the remineralizing potential of ACP composites without impeding their vinyl conversion, mechanical strength or water sorption.
Keywords: amorphous calcium phosphate, biaxial flexure strength, degree of vinyl conversion, mineral ion release, water sorption
1. Introduction
Traditional polymeric dental composites are multiphase materials consisting of a resin matrix phase activated for free radical polymerization and a reinforcing glass phase that has been surface treated with a silane coupling agent. On polymerization these two disparate phases interact to form a complex third phase called the interface. A unique bioactive composite was developed recently with the potential to remineralize minor defects in tooth structure, and also provide anti-cariogenic or anti-demineralizing environment to prevent further tooth decay. These anti-cariogenic and remineralizing properties derive from the filler phase of the composite, i.e. amorphous calcium phosphate (ACP), than on exposure to an aqueous milieu releases in a steady, sustained manner calcium and phosphate ions. ACP polymeric composites formulated as sealants, basing materials, orthodontic cements, etc. have been the focus of our recent research [1-5]. ACP, a precursor to apatite formation both in vitro and in vivo [6-9] readily converts to apatite by a complex, surface-mediated dissolution and recrystallization. This propensity, primarily controlled by the chemistry of microenvironment [10-13], makes ACP suitable as a mineralizing agent. ACP also has been proven to be more osteoconductive than apatite in vivo [14] and its biodegradability was found to be higher than that of tricalcium phosphate [15]. As the filler phase in polymeric composites current forms of ACP enhance the modulus of the polymeric matrix phase, but have an adverse effect on mechanical strength, in contrast to conventional, silanized glass-reinforced dental composites. To overcome this shortcoming, we have lately focused our attention on the role of matrix structure and composition as a tool to control the physicochemical and mechanical properties of ACP composites. A primary goal of this study was to assess if improved ion release of these composites could be achieved by elevating the ethoxylated bisphenol A dimethacrylate (EBPADMA)/triethylene glycol dimethacrylate (TEGDMA) ratio while lowering the level of surface active methacryloxyethyl phthalate (MEP; [4, 16]) in the EBPADMA/TEGDMA/2-hydroxyethyl methacrylate (HEMA)/MEP resin system without adversely affecting biaxial flexure strength, degree of vinyl conversion and water sorption of composites. A second goal was to compare the effects of unmilled vs. milled ACP on these properties by formulating the composites with ACP fillers of distinctively different particle size distribution [as-made (heterodispersed) ACP, and milled (fine) ACP].
2. Materials and methods
2.1. Synthesis and evaluation of zirconia-ACP (Zr-ACP) fillers
Zr-ACP was precipitated instantaneously in a closed system at 23 °C upon rapidly mixing equal volumes of a 800 mmol/L Ca(NO3)2 solution, a 536 mmol/L Na2HPO4 solution that contained a molar fraction of 2 % Na4P2O7 as a stabilizing component for ACP, and an appropriate volume of a 250 mmol/L ZrOCl2 solution (mole fraction of 10 % ZrOCl2 based on the calcium reactant [2, 4]). The reaction pH varied between 8.6 and 9.0. The suspension was filtered, the solid phase was washed subsequently with ice-cold ammoniated water and acetone and then lyophilized. Dry Zr-ACP (designated unmilled) was kept in desiccator until its utilization in composite preparation. A portion of this unmilled Zr-ACP was mixed with high density ZrO2 balls (2 mm in diameter; Glen Mills Inc., Clifton, NJ, USA) in isopropanol (added in the amount sufficient to cover the Zr-ACP/ZrO2 mixture) and milled (ball-milling machine, Dayton Electric MFG Co., Chicago, Il, USA) at 57 rad/s for 2.5 h. Zr-ACP solid was separated from the ZrO2 balls by sieving, the residual isopropanol removed by rotary evaporation (approx. 2h at 50 °C), and the milled powder was vacuum-dried at 40 °C for 24 h (designated milled Zr-ACP). Milled Zr-ACP was also kept in a desiccator until used in composites. Analytical methods/techniques used to characterize ACP fillers and the results of the analyses are summarized in Table 1.
Table 1.
Physicochemical characterization of the Zr-ACP fillers utilized in the study.
| Method/technique | Instrument/manufacturer | Property/parameter | Findings |
|---|---|---|---|
| X-ray diffraction (XRD) | DMAX 2000, Rigaku/USA Inc., MA, USA | Long-range crystalline order | No discrete XRD peaks; two diffuse broad bands in 2θ(°) = 4 to 60 region, typical for both fillers. |
| Fourier-transform Infrared spectroscopy (FTIR) | Nicolet Magna-IR FTIR System 550, Nicolet Instrument Corporation, WI, USA | Short-range structural arrangement | Identical for both types of fillers: PO4 stretching and PO4 bending absorption bands at (1200 to 900) cm−1 and (630 to 500) cm−1, respectively - characteristic for noncrystalline calcium phosphate. |
| Particle size analysis | SA-CP3, Shimadzu Scientific Instruments, Inc., D, USA | Particle size distribution (PSD) range, median diameter (dm), specific surface area (SSA)) | Highly heterogeneous PSD for the unmilled Zr-ACP filler: particle range (0.1 to 80) μm, dm = (5.9 ± 0.7) μm, SSA = (0.5 ± 0.1) m2/g. By contrast, milled Zr-ACP had quite narrow PSD (spanning from 0.2 μm to 3.0 μm) with dm = (0.9 ± 0.2) μm and SSA = (3.8 ± 1.0) m2/g. |
| Scanning electron microscopy (SEM) | JSM-5400, JEOL Inc., MA, USA | Morphology, topology | Dramatic reduction in the particle sizes of milled vs unmilled Zr-ACP filler. |
| Thermogravimetric analysis (TGA) | 7 Series Thermal Analysis System, Perkin Elmer CT, USA | Overall water content and thermal decomposition pattern | Total water content ((17.1 ± 1.5) % by mass) and the ratio of the surface-bound mobile water)/structurally incorporated water (approx. ratio of 2.5) of the fillers was unaffected by milling. |
| Ultraviolet/visible spectrophotometry | UV/VIS Carey Model 219 spectrophotometer, Varian Analytical Instruments, CA, USA | Calcium/phosphate ratio of the solid | Average calcium/phosphate = (1.89 ± 0.9), unaffected by milling, was higher than theoretically expected (1.50) due to the formation of HCl-insoluble amorphous Zr phosphate (approx. 22 % by mass) during Zr-ACP synthesis. |
2.2. Formulation of the resins
The experimental resins were formulated from the commercially available dental monomers and components of the photoinitiator system (Table 2). The indicated acronyms will be used throughout this manuscript. Compositions of the experimental resins and their acronyms are given in Table 3.
Table 2.
Monomers and photoinitiator system employed in resin formulations.
| Chemical name | Acronym | Manufacturer |
|---|---|---|
| ethoxylated bisphenol A dimethacrylate | EBPADMA | Esstech, PA, USA |
| triethylene glycol dimethacrylate | TEGDMA | Esstech, PA, USA |
| 2-hydroxyethyl methacrylate | HEMA | Esstech, PA, USA |
| methacryloxyethyl phtalate | MEP | Esstech, PA, USA |
| camphorquinone | CQ | Aldrich. WI, USA |
| ethyl-4-N,N-dimethylaminobenzoate | 4EDMAB | Aldrich. WI, USA |
Table 3.
| Resin/monomer | EBPADMA | TEGDMA | HEMA | MEP |
|---|---|---|---|---|
| ETHMI* | 43.17 | 43.24 | 10.08 | 2.51 |
| ETHMII | 54.45 | 31.94 | 10.00 | 2.61 |
| ETHMIII | 62.85 | 23.22 | 10.36 | 2.57 |
Molar ratio EBPADMA:TEGDMA in ETHMI, ETHMII andETHMIII formulations: 0.50, 0.85 and 1.35, respectively.
Photoinitiator system comprised of a mass fraction of 0.20 % CQ and 0.80 % 4EDMAB.
2.3. Preparation of composite and copolymer (unfilled resin) disk specimens
Composite pastes were made from mixing the ETHM resins (Table 3; 60 % by mass) and the unmilled or milled Zr-ACP (40 % by mass) by hand spatulation. The pastes were molded into disks (diameter: (15.1 ± 0.2) mm, thickness: (1.42 ± 0.11) mm) by filling the circular openings of flat Teflon molds, covering each side of the mold with a Mylar film plus a glass slide, and then clamping the assembly together with spring clips. The disks were photo-polymerized with visible light (irradiation 120 per each side of the assembly; Triad 2000, Dentsply International, York, PA, USA). Copolymer disk specimens were prepared using circular Teflon molds (diameter: (14.9 ± 0.3) mm; thickness: (1.00 ± 0.20) mm) with one open face and a Teflon bottom layer to prevent the resin from seeping out the bottom of the mold. The resin was poured into the cavity, and the filled cavity was then covered with Mylar film and a glass slide. The assembly was not clamped together by spring clips to avoid introducing air voids. The unfilled copolymer disk specimens were first photo-polymerized on the glass slide-face of the mold for 120 s, and then these cured disks were removed from their molds and cured on the reverse side for an additional 120 s.
2.4. Physicochemical and mechanical assessment of copolymers and composites
The extent of vinyl conversion attained upon polymerization of copolymers and composites (number of samples, n ≥ 8/group) was measured by mid-FTIR. Changes in the 1637 cm-1 absorption band for the vinyl group were monitored against the absorption band of phenyl ring at 1582 cm-1 (used as internal standard) immediately after and 24 h after photocuring at 23 °C.
Mineral ion release from each individual composite disk specimen (n ≥ 3/group) in a continuously stirred, HEPES-buffered (pH = 7.40) 240 mOsm/kg saline solution, was examined at 23 °C. Ca and PO4 levels were determined at predetermined time intervals by utilizing spectrophotometric analytical methods [17, 18]. Data were corrected for variations in the total area of surface disk exposed to the immersion solution using a simple relation for a given surface area (in mm2), A: normalized value = (measured value) × (500/A).
The following procedure was applied to determine water sorption of copolymers and composites specimens (n ≥ 5/group): disk specimens were initially dried over anhydrous CaSO4 until a constant mass was achieved (± 0.1 mg). The specimens were then exposed to an air atmosphere of 75 % relative humidity at room temperature (23 °C) by keeping them suspended over a saturated aqueous NaCl slurry in closed systems. Gravimetric mass changes were recorded at 3 d, 5 d, 7 d, 10 d, 24 d, 35 d and 41 d of exposure to this relative humidity. The water sorption (mass fraction %) of any individual specimen at any given time interval (t) was calculated by relating its mass at the time t, Wt, and the mass of a dry specimen (Wo; initial dry value) by using the equation:
| (1) |
Mechanical strength of copolymers and composites (n ≥ 5/group) was assessed under biaxial flexure conditions [19]. Biaxial flexure strength of dry and wet disk specimens (after 40 days of immersion in HEPES-buffered, pH = 7.40, saline solutions at 23 °C) was determined by using a computer-controlled Universal Testing Machine (Instron 5500R, Instron Corp., Canton, MA, USA; crosshead speed: 0.5 mm/min) operated by Testworks4 software. The failure stress was calculated according to the ASTM specification F417-78 [20].
2.5. Statistical analysis of the experimental data
One standard deviation is indicated in this paper for comparative purposes as the estimated standard uncertainty of the measurements. Experimental data were analyzed by ANOVA (α = 0.05). Significant differences between specific groups were determined by all pair-wise multiple comparisons (two-tail t-test; unequal variances).
3. Results
3.1. Degree of vinyl conversion
The mid-FTIR conversion results for the various resin formulations and their composites compiled in Fig. 1 showed that degree of vinyl conversion attained at 24 h compared to the degree of vinyl conversion immediately after curing increased on average (13.5 ± 2.7) %. Statistical analysis of the 24 h data revealed an average (80.2 ± 3.1) % of vinyl conversion in the copolymer series. In both composite series, degree of vinyl conversion decreased in the following order: ETHMI > (ETHMII, ETHMIII). Immediate and 24 h degree of vinyl conversion of composites was reduced by up to 13.6 % (unmilled ACP) and up to 7.3 % (milled ACP) compared to their corresponding copolymers.
Fig. 1.
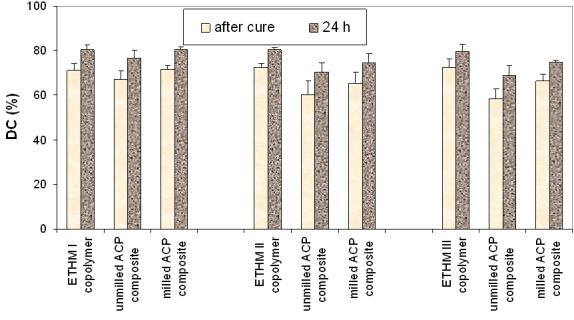
Degree of vinyl conversion (mean ± standard deviation (SD; indicated by bars)) of ETHMI, ETHMII and ETHMIII copolymers, unmilled and milled ACP composites immediately after cure and at 24 h post-curing. The SD is taken as a measure of the standard uncertainty; the number of samples in each group n ≥ 8.
3.2. Ion release from composites
Kinetic profiles of calcium and phosphate release from ACP composites are shown in Fig. 2a and 2b, respectively. The maximum concentrations of calcium and phosphate released from composites after 720 h of immersion in buffered saline are compared in Fig. 3. The immersion solutions containing the maximum concentrations of calcium and phosphate (Table 4) were all supersaturated with respect to apatite. Attained supersaturation levels were significantly above a minimum necessary for mineral redeposition ([4]; ΔGo < 0) to occur. The apparent increase in the maximum calcium and phosphate levels with the increasing EBPADMA/TEGDMA ratio in the resin was found statistically significant for both types of ACP composites (Fig. 3; 0.04 ≥ p ≥ 0.0001, at 95 % confidence level).
Fig. 2.
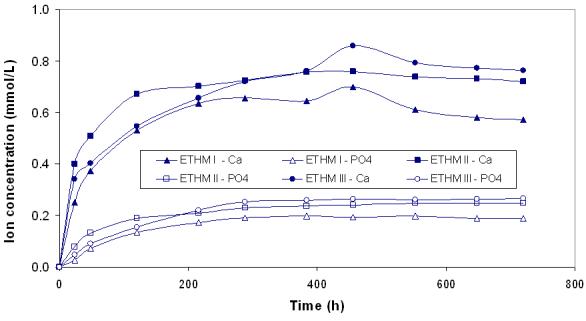
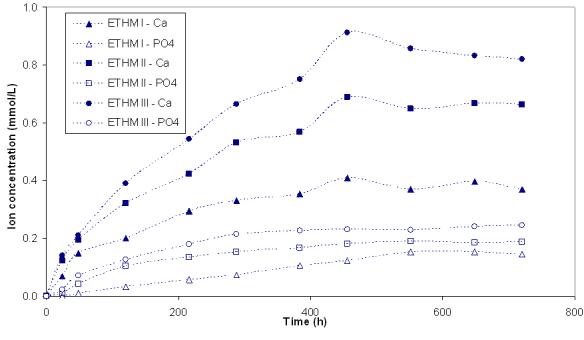
Ion release kinetic profiles of umilled ACP (a) and milled ACP (b) composites. SDs of the reported values ranged from 0.005 mmol/L to 0.011 mmol/L and from 0.003 mmol/L to 0.009 mmol/L for calcium and phosphate, respectively; n ≥ 3.
Fig. 3.
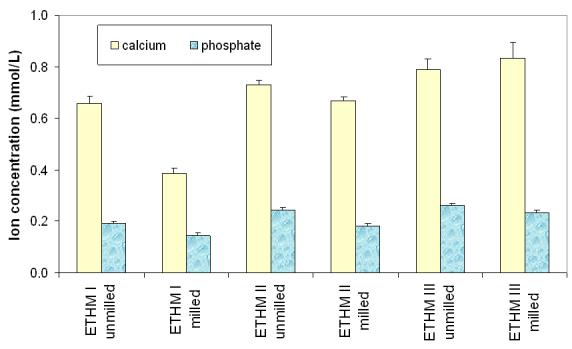
Maximum concentration of the mineral ions (mean ± SD (indicated by bars)) released from ETHMI, ETHMII and ETHMIII resin composites filled with unmilled or milled Zr-ACP after 720 h of immersion in buffered saline. The SD is taken as a measure of the standard uncertainty; n ≥ 3.
Table 4.
Comparison of the ion activity product (IAP; mean ± standard deviation (SD)) and the thermodynamic stability* (ΔGo, mean ± SD) of the solutions containing the maximum concentrations of Ca and PO4 released from Zr-ACP/EBPADMA/TEGDMA/HEMA/MEP composites. Negative ΔGo value indicates solution supersaturated with respect to stoichiometric hydroxyapatite, Ca10(OH)2(PO4)6. Number of repetitive experiments in each group n ≥ 4.
| Resin | IAP | ΔGo (kJ/mol) | ||
|---|---|---|---|---|
| unmilled ACP | milled ACP | unmilled ACP | milled ACP | |
| ETHMI | 103.59 ± 0.76 | 106.63 ± 1.27 | − (4.35 ± 0.21) | − (3.42 ± 0.39) |
| ETHMII | 102.51 ± 0.72 | 103.68 ± 1.19 | − (4.65 ± 0.22) | − (4.32 ± 0.36) |
| ETHMIII | 102.05 ± 0.74 | 106.63 ± 0.68 | − (4.67 ± 0.23) | − (4.79 ± 0.20) |
3.3. Water sorption
Comparisons of the maximum levels of water sorption (mass fraction, %) following 41 d exposure to 75 % relative humidity for copolymers, unmilled and milled Zr-ACP composites are given in Fig. 4. Copolymers adsorbed a maximum of a mass fraction of 1.28 to 1.71 % water. Unmilled ACP composites adsorbed a mass fraction of 2.24 to 2.52 % and the milled ACP composites adsorbed a mass fraction of 1.65 to 2.12 % water. The water sorption of copolymers and milled ACP composites decreased with the increasing EBPADMA/TEGDMA ratio in the resin in the following order: ETHMI > ETHMII > ETHMIII.
Fig. 4.
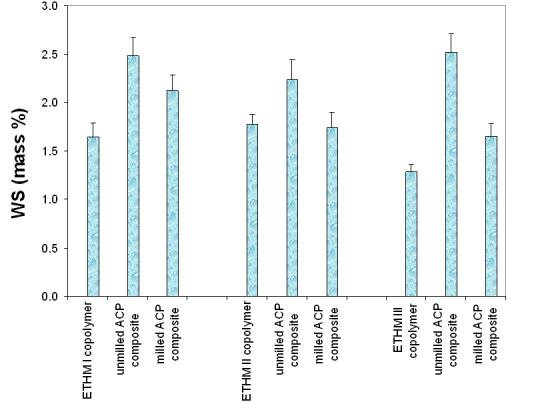
Maximum water sorption (mean ± SD (indicated by bars)) values of ETHMI, ETHMII and ETHMIII copolymers and their corresponding unmilled and milled ACP composites after 41 d of exposure to 75 % relative humidity at room temperature. The SD is taken as a measure of the standard uncertainty; n ≥ 5.
3.4. Biaxial flexure strength
The results of the biaxial flexure strength testing of dry and wet copolymers and composites are summarized in Fig. 5. Resin composition had no effect on the strength of either dry or wet copolymer specimens. The apparent reduction in the strength of wet vs. dry copolymer samples ((6 to 18) %) was not statistically significant. The biaxial flexure strength of dry specimens decreased in the following order: copolymers and milled ACP composites ((79 ± 5) MPa) > unmilled ACP composites ((48 ± 8) MPa). The biaxial flexure strength of wet specimens decreased in the following order: copolymers ((71 ± 6) MPa) > milled ACP composites ((54 ± 12) MPa) > unmilled ACP composites ((30 ± 3) MPa). Significantly, milled ACP composites maintained higher strength (56 % and 79 %, respectively) in both dry and wet state compared to unmilled ACP composites.
Fig. 5.
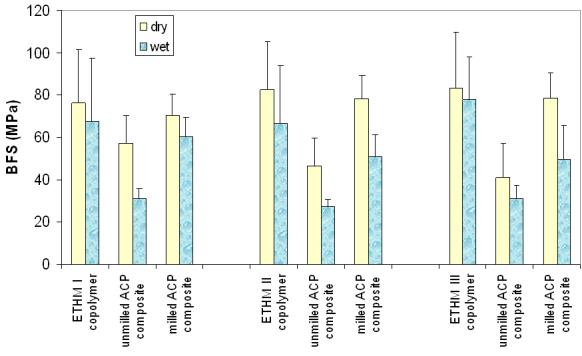
Biaxial flexure strength (mean ± SD (indicated by bars)) of dry and wet ETHMI, ETHMII and ETHMIII copolymers and their umilled or milled Zr-ACP composites. The number of runs in each experimental group n ≥ 5. Standard deviation (SD) is taken as a measure of the standard uncertainty; n ≥ 5.
4. Discussion
The goal of this study was to establish if improved ion release from ACP-filled ETHM resin composites is achievable by increasing the EBPADMA/TEGDMA levels while maintaining a relatively constant level of surface active comonomers (HEMA and MEP) in the matrix. The desired effect on the ion release was attained without adversely affecting the biaxial flexure strength or degree of vinyl conversion of composites. Moreover, by increasing the EBPADMA content in the ETHMIII resin, water sorption was reduced for both this copolymer and its milled ACP composite.
4.1. Degree of vinyl conversion
EBPADMA, a relatively hydrophobic analog of 2,2-bis[p-(2'-hydroxy-3'-methacryloxypropoxy)phenyl]propane (Bis-GMA; a base monomer utilized in a majority of commercial dental materials) has been shown to provide resin systems that reach high vinyl conversion upon photocuring and, therefore, have a minimal potential for leaching-out the unreacted monomeric species [4]. ACP composites based on such formulations are likely to be more biocompatible than resin systems of lower degree of vinyl conversion values that may contain leachable organic species. A sought-after effect of EBPADMA on the degree of vinyl conversion is attributed primarily to the greater flexibility and hydrophobicity coupled with the lower viscosity and vinyl group concentration/mole of this monomer compared to Bis-GMA. Surprisingly, no correlation was established between the degree of vinyl conversion and the increasing levels of EBPADMA in the ETHM copolymer (unfilled resin) series. A maximum reduction in degree of vinyl conversion of 13.6 % established for unmilled ACP composites compares well with the reduction in degree of vinyl conversion observed in Bis-GMA- and previous EBPADMA-based binary and ternary resin composites utilizing the same type of ACP filler (14.3 % [4]). Milled ACP composites, however, showed a lesser reduction in attained conversion (7.3 % relative to copolymers) compared to the coarser unmilled ACP-filled composites. The effect can again be attributed to a more intimate contact between the milled ACP and the matrix that, in turn, improves translucency and photo-polymerization efficacy.
4.2. Ion release from composites
The kinetics of calcium and phosphate release from ACP-filled composites is generally determined by nature of the polymer matrix network structure, polymer's permeability to water, internal pH and the rate of internal ACP to apatite conversion. Ion release data and the calculated remineralizing potential (Fig. 3, Table 4) of the experimental ACP/ETHM composites correlated well with the EBPADMA/TEGDMA molar ratio in the resin. All other factors being equal, it is expected that ETHM resins with the higher EBPADMA/TEGDMA molar ratio would have lower cross-linking density and therefore, result in a more open network structure. This trend is more apparent in milled-ACP than the unmilled ACP composites. In the latter case, the effect may be overshadowed by random intracomposite distribution (heterodispersion) of the filler. The plots of maximum ion concentration levels against the EBPADMA/TEGDMA ratio in the resin are presented in Fig. 6. The functional dependence could be best described by the equation:
| (2) |
with the coefficients 0.16 ≥ a ≥ 0.49, 0.75 ≥ b ≥ 0.71; 1.000 ≥ R2 values ≥ 0.945 and 0.10 ≥ a ≥ 0.07, 0.24 ≥ b ≥ 0.20; 0.987 ≥ R2 values ≥ 0.954 for calcium and phosphate, respectively. This observed effect can be attributed to the lesser cross-linking density of the matrix as the EBPADMA (with a greater molecular mass/methacrylate group than TEGDMA) level in the resin increased.
Fig. 6.
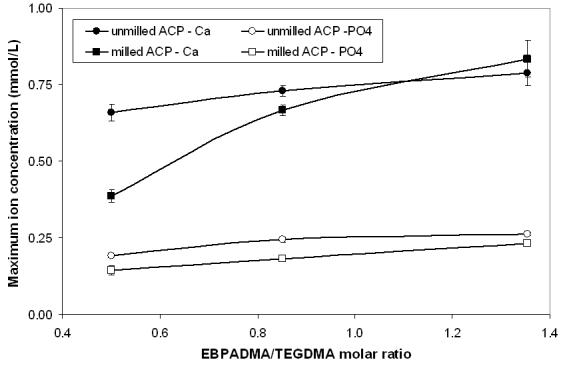
Functional dependence between the maximum concentration of the release calcium and phosphate ions (mean ± SD (indicated by bars)) and the molar ratio of EBPADMA/TEGDMA in the resin.
At a relatively low concentration of MEP, i.e., 2.6 % by mass in the resin, no consumption of the released calcium by the MEP's carboxylic groups occurred. Calcium-MEP binding could not be detected when disks made of ETHMI, ETHMII or ETHMIII copolymers were exposed to buffered saline solutions initially containing 1.5 mmol/L calcium.
4.3. Water sorption
Water sorption is considered one of the key properties of dental polymers and composites since it controls not only their mechanical properties but also affects the glass transition temperature [21] via plasticization, salvation, and disruption of the polymer matrix [22]. A relationship between the maximum water sorption and the molar ratio EBPADMA/TEGDMA in the polymer matrix (Fig. 7) could be described by the following equations for unfilled resins, unmilled ACP composites and milled ACP composites, respectively:
| (3), |
| (4), |
| (5). |
The observed decrease in water sorption with the increasing EBPADMA/TEGDMA ratio is probably related to the increasing overall hydrophobicity of the resin matrix as the level of relatively hydrophobic EBPADMA monomer increases. The water sorption of the ACP composites is also affected by ACP's affinity for water, increasing between (42 to 75) % and (20 to 29) %, for unmilled ACP and milled ACP composites, respectively, compared to the unfilled resins. The lower water sorption of milled ACP composites in comparison with the unmilled ones is most likely related to a better dispersion of milled ACP filler throughout the polymeric matrices and the lesser number of water absorption-prone subsurface voids/defects (typically observed with the of coarse ACP filler [5]) existing in these composites.
Fig. 7.
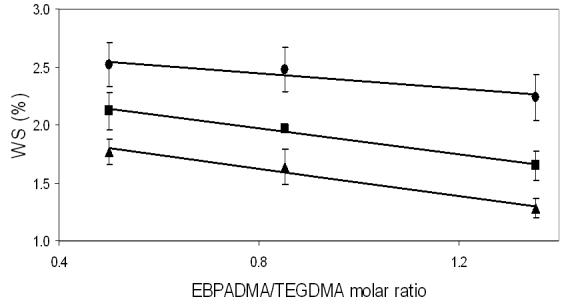
Functional dependence between the maximum WS (mean ± SD (indicated by bars)) and the molar ratio of EBPADMA/TEGDMA in the resin for ETHM copolymers (▲), unmilled ACP/ETHM composites ([unk]) and milled ACP/ETHM composites (■).
4.4. Biaxial flexure strength
The biaxial flexure strength of both dry and wet copolymers and composites (Fig. 5) was unaffected by the resin composition. The type of the filler, however, had a major effect on the mechanical strength of the composites. Composites formulated with milled ACP as the filler phase exhibited greater mechanical strength compared to similar composites containing unmilled ACP. The introduction of unmilled ACP fillers into dental polymer matrices typically results in the dramatic reduction in the biaxial flexure strength of composites compared to the corresponding unfilled polymers [4]. Significantly, this marked decrease in strength was not observed with the dry milled ACP/ETHM specimens. The greater strength of dry milled ACP composites is probably due to the presence of less or smaller sized defects in the microstructure of these composites compared to similar unmilled ACP composites. The smaller particle size and the more narrow size distribution of the milled versus the unmilled ACP and, perhaps, a smoother surface topology accounts for better dispersion (with fewer defects) of this type of filler into polymer matrix. Even after exposure to water, these composites were, on average, only 24 % weaker than their corresponding copolymers, compared to a 58 % reduction in the strength of unmilled ACP composites. This lesser reduction in the biaxial flexure strength of milled ACP composites is attributed to the higher quality of the filler/matrix interface that is less vulnerable to spatial changes that may occur in the filler phase during the calcium and phosphate release. Unmilled ACP/ETHM composites, on the other hand, because of the uneven dispersion of larger, highly agglomerated ACP have less integrated and more defective filler/resin interfaces resulting in pronounced weakening of these specimens upon soaking. Surface analytical methods, such as micro-FTIR spectroscopy and small-angle neutron scattering, are currently being used to probe the interface created by the interaction of ACP with the resin matrix.
5. Conclusions
Enhanced remineralizing potential for ACP polymeric composites is achievable by elevating the EBPADMA/TEGDMA ratio and by reducing potentially adverse calcium binding with the reactive carboxylic groups by limiting the amount of methacryloxyethyl phthalate. Water sorption of composites may be reduced by fine-tuning of the resin and by utilizing milled ACP as a replacement for the coarser, unmilled ACP filler. There also seems to be a trend of improved vinyl conversion with milled ACP composites compared to those formulated with unmilled ACP. Significantly, milled ACP composites maintained higher biaxial flexure strength upon aqueous exposure. Both polymer matrix composition and particle size and distribution of the filler phase appear to play an important role in shaping the physicochemical properties of these bioactive composites.
Acknowledgements
This research was supported by the National Institute of Dental and Craniofacial Research (grant R01 DE13169-06) and is part of the dental research program conducted by the National Institute of Standards and Technology in cooperation with the American Dental Association Foundation. Generous contribution of the monomers from Esstech, Essington, PA, USA is gratefully acknowledged.
Footnotes
Disclaimer
Certain commercial materials and equipment are identified in this work for adequate definition of the experimental procedures. In no instance does such identification imply recommendation or endorsement by the American Dental Association Foundation or the National Institute of Standards and Technology, or that the material and the equipment identified is necessarily the best available for the purpose.
References
- 1.Antonucci JM, Skrtic D, Hailer AW, Eanes ED. Polymeric drugs & drug delivery systems. Technomics Publ. Co., Inc.; Lancaster: 2000. Bioactive polymeric composites based on hybrid amorphous calcium phosphate; pp. 301–310. [Google Scholar]
- 2.Skrtic D, Antonucci JM, Eanes ED, Eichmiller FC, Schumacher GE. Physicochemical evaluation of bioactive polymeric composites based on hybrid amorphous calcium phosphates. J Biomed Mat Res (Appl Biomater) 2000;53:381–391. doi: 10.1002/1097-4636(2000)53:4<381::aid-jbm12>3.0.co;2-h. [DOI] [PubMed] [Google Scholar]
- 3.Skrtic D, Antonucci JM, Eanes ED. Effect of the monomer and filler system on the remineralizing potential of bioactive dental composites based on amorphous calcium phosphate. Polym Adv Technol. 2001;12:369–379. [Google Scholar]
- 4.Skrtic D, Antonucci JM, Eanes ED. Amorphous calcium phosphate-based bioactive polymeric composites for mineralized tissue regeneration. J Res Natl Inst Stands Technol. 2003;108:167–182. doi: 10.6028/jres.108.017. [DOI] [PMC free article] [PubMed] [Google Scholar]
- 5.Skrtic D, Antonucci JM, Eanes ED, Eidelman N. Dental composites based on hybrid and surface-modified amorphous calcium phosphates. Biomaterials. 2004;25:1141–1150. doi: 10.1016/j.biomaterials.2003.08.001. [DOI] [PubMed] [Google Scholar]
- 6.Betts F, Posner AS. A structural model for amorphous calcium phosphate. Trans Am Cryst Assoc. 1974;10:73–84. [Google Scholar]
- 7.McGann TCA, Kearney RD, Buckheim W, Posner AS, Betts F, Blumenthal NC. Amorphous calcium phosphate in casein micelles of bovine milk. Calcif Tissue Int'l. 1983;35:821–823. doi: 10.1007/BF02405131. [DOI] [PubMed] [Google Scholar]
- 8.Boskey AL. Amorphous calcium phosphate. The contention of bone. J Dent Res. 1997;76:1433–1436. doi: 10.1177/00220345970760080501. [DOI] [PubMed] [Google Scholar]
- 9.Eanes ED. Calcium phosphates in biological and industrial systems. Kluwer Academic Publ.; Boston, Dordrecht, London: 1998. Amorphous calcium phosphate: thermodynamic and kinetic considerations; pp. 21–39. [Google Scholar]
- 10.Blumenthal NC. Basic science and pathology. Mechanisms of inhibition of calcification. Clin Orthopaedics & Rel Res. 1989;247:279–289. [PubMed] [Google Scholar]
- 11.Root MJ. Inhibition of the amorphous calcium phosphate phase transition reaction by polyphosphates and metal Ions. Calcif Tissue Int'l. 1990;47:112–116. doi: 10.1007/BF02555994. [DOI] [PubMed] [Google Scholar]
- 12.Abbona F, Baronnet A. A XRD and TEM study on the transformation of amorphous calcium phosphate in the presence of magnesium. J Crystal Growth. 1996;165:98–105. [Google Scholar]
- 13.LeGeros RZ. Formation and transformation of calcium phosphates: Relevance to vascular calcification. Z Kardiol. 2001;90(Suppl 3):III/116–III/124. doi: 10.1007/s003920170032. [DOI] [PubMed] [Google Scholar]
- 14.Nagano M, Nakamura T, Kokubo T, Tanahashi M, Ogawa M. Differences of bone bonding ability and degradation behavior in vivo between amorphous calcium phosphate and highly crystalline hydroxyapatite coating. Biomaterials. 1996;17(18):1771–1777. doi: 10.1016/0142-9612(95)00357-6. [DOI] [PubMed] [Google Scholar]
- 15.Tadic D, Peters F, Epple M. Continuous synthesis of amorphous carbonated apatites. Biomaterials. 2002;23(12):2553–2559. doi: 10.1016/s0142-9612(01)00390-8. [DOI] [PubMed] [Google Scholar]
- 16.Skrtic D, Antonucci JM. Matrix resin effects on selected physicochemical properties of amorphous calcium phosphate composites. J Bioactive & Compatible Polymers. 2005;20:29–49. doi: 10.1177/0883911506064476. [DOI] [PMC free article] [PubMed] [Google Scholar]
- 17.Vogel GL, Chow LC, Brown WE. A microanalytical procedure for the determination of calcium, phosphate and fluoride in enamel biopsy samples. Caries Res. 1983;7:23–31. doi: 10.1159/000260645. [DOI] [PubMed] [Google Scholar]
- 18.Murphy J, Riley JP. Single solution method for the determination of phosphate in natural waters. Anal Chim Acta. 1962;27:31–36. [Google Scholar]
- 19.Ban S, Anusavice KJ. Influence of test method on failure stress of brittle dental materials. J Dent Res. 1990;69(12):1791–1799. doi: 10.1177/00220345900690120201. [DOI] [PubMed] [Google Scholar]
- 20.American Society for Testing and Materials . Standard Test Method for Flexural Strength of ElectricalGrace Ceramics. Philadelphia, PA: 1984. (ASTM F417-78). [Google Scholar]
- 21.Arima T, Hamada T, McCabe JF. The effect of crosslinking agents on some properties of HEMA-based resins. J Dent Res. 1995;74(9):1597–1601. doi: 10.1177/00220345950740091501. [DOI] [PubMed] [Google Scholar]
- 22.Garcia-Fiero JL, Aleman JV. Sorption of water by epoxide prepolymers. Macromolecules. 1982;15:1145–1149. [Google Scholar]