Abstract
Information about the spatial structure of tactile stimuli is conveyed by slowly adapting type 1 (SA1) and rapidly adapting (RA) afferents innervating the skin. Here, we investigate how the spatial properties of the stimulus shape the afferent response. To that end, we present an analytical framework to characterize SA1 and RA responses to a wide variety of spatial patterns indented into the skin. This framework comprises a model of the tissue deformation produced by any three-dimensional indented spatial pattern, along with an expression that converts the deformation at the receptor site into a neural response. We evaluated 15 candidate variables for the relevant receptor deformation and found that physical quantities closely related to local membrane stretch were most predictive of the observed afferent responses. The main outcome of this study is an accurate working model of SA1 and RA afferent responses to indented spatial patterns.
INTRODUCTION
When tactually exploring an object, the deformation produced at the skin’s surface leads to events at the sites of mechanotransduction that culminate in patterned activity in a population of mechanoreceptive afferent fibers. Previous work has shown that this transformation, from a stimulus displacement pattern into a pattern of peripheral neural activity, is highly nonlinear (Johnson 2001; Phillips and Johnson 1981a,b). Neural responses in somatosensory cortex, as well as the resulting tactile percepts, are shaped, in part, by this nonlinear transformation at the periphery. A working model of peripheral afferent responses is therefore an invaluable tool to understand how the information about a tactile stimulus is transformed as it ascends the perceptual pathway.
A well-known aspect of this peripheral response nonlinearity is the edge enhancement observed in responses to gratings (Phillips and Johnson 1981a). One approach to modeling these afferent responses has consisted of using continuum mechanics to characterize the deformation in the tissue and its eventual impact on the mechanoreceptor (Phillips and Johnson 1981b). Another approach has consisted of using finite element modeling of the fingerpad to arrive at more realistic descriptions of the tissue and receptor deformations (Dandekar and Srinivasan 1997; Srinivasan and Dandekar 1996; Wu et al. 2004).
In addition to being a useful tool in understanding upstream processing, another benefit from modeling the stimulus/response transformation is that it may lead to a better under-standing of mechanotransduction itself. Mechanotransduction has been studied in Pacinian corpuscles by recording the receptor and action potentials evoked by direct mechanical stimulation (Diamond et al. 1956; Gray and Malcolm 1950; Gray and Matthews 1951; Loewenstein and Cohen 1959a,b; Loewenstein and Rathkamp 1958; Loewenstein and Skalak 1966). In contrast, little is known about transduction in Merkel receptors and Meissner corpuscles (innervated by slowly adapting type 1 and rapidly adapting afferents, respectively), which, unlike the Pacinian (PC) corpuscles, cannot be readily excised from the surrounding tissue and thus have not been studied in isolation (Ogawa 1996; Takahashi-Iwanaga and Shimoda 2003). In the present study, we developed a model of the stimulus/response transformation and used it to draw inferences regarding mechanotransduction in these fibers (Phillips and Johnson 1981b; Srinivasan and Dandekar 1996).
Specifically, we sought to understand the dependence of the afferent response on the spatial properties of the stimulus. We confined our study to cutaneous slowly adapting type 1 (SA1) and rapidly adapting (RA) fibers because they are sensitive to the spatial properties of the stimulus, unlike PC fibers (Johnson 2001). We developed an analytical framework to characterize the stimulus-response transformation. This framework comprises a model of the tissue deformation produced by any three-dimensional spatial pattern along with an expression that converts the deformation at the receptor site into a neural response. Within this framework, we ascertained which aspects of the local tissue deformation are most predictive of the neural response. Maximum compressive strain (Phillips and Johnson 1981b), strain energy density (Dandekar and Srinivasan 1997; Srinivasan and Dandekar 1996), and stress (Del Prete et al. 2003; Khalsa et al. 1996, 1997) have been previously proposed to drive transduction. One finding of the present study is that these variables are closely related and can only be distinguished using a wide variety of stimuli. Overall, physical quantities closely related to local membrane stretch were found to be most predictive of the afferent responses. The main outcome of this study is a working model of SA1 and RA afferent responses to indented spatial patterns.
METHODS
Stimuli
Stimuli were delivered using a tactile stimulator that consists of 400 independently controlled probes in a 20 × 20 array covering a 1-cm2 area. Each probe is cylindrical with a radius of 0.3 mm, and the center-to-center spacing between probes is 0.53 mm. Probe amplitudes were measured every 2 ms using optical sensors with an accuracy of 2–5 μm.
We recorded peripheral unit responses to the following indented stimuli. 1) Two hundred spheres of varying radius of curvature at varying locations on the array (radii: 1, 2, 4, 8, 16, 32, 64, and 128 mm; center amplitude: 0.3 mm; duration: 100 ms; repetitions: 8). 2) One hundred eighty-four square-wave gratings of different periods at varying spatial offsets within the array (periods: 1, 2, 3, 4, 6, 10, and 20 mm; every nonredundant offset in steps of 0.53 mm across the spatial period; amplitude: 0.3 mm; duration: 40 ms; stimulus repetitions: 60, 40, 30, 20, 10, 6, and 6 corresponding to the 7 spatial periods). 3) Eighty-eight bars, each 1.2 mm wide, at varying orientations and locations on the array (orientations: 0 –180° in steps of 22.5°; amplitude: 0.5 mm; duration: 66 ms; repetitions: 10). 4) Four hundred individual probes at all locations in the array (amplitude: 0.3 mm; duration: 100 ms; repetitions: 5). 5) In 18 of the 24 neurons, 130 annuli, centered on the afferent’s point of maximum sensitivity (or “hotspot”), were indented into the skin with different radii and amplitudes (radius, measured to the annulus center: 2, 3, 4, and 6 mm; annulus thickness, 1 mm; amplitudes: 0.1 to 0.8 mm in steps of 0.1 mm; duration: 100 ms; repetitions: 5). In 90 of these stimuli, a probe was simultaneously indented at the center of the annulus with varying amplitudes (amplitudes: 0 – 0.8 mm; repetitions, 5). 6) In 18 of the 24 neurons, 90 single-probe indentations were presented at varying amplitudes (9 probes centered around the afferent’s hotspot; amplitudes: 0.1– 0.8 mm in steps of 0.1 mm; duration: 100 ms; repetitions: 5).
Overall, 1,092 spatial patterns were indented into the skin. Many of these spatial patterns are representative of the types of stimuli encountered in common tactile experience. On and off ramps at the beginning and end of each stimulus indentation lasted ~20 ms. Relatively short stimulus durations were used so that a large number of stimuli could be delivered during each recording session. Successive stimulus indentations were separated by a time interval equal to the stimulus duration. Thus the duration of each trial was twice the duration of the stimulus indentation.
Neurophysiology
Single-unit recordings were made from the ulnar and median nerves of macaque monkeys (Macacca mulatta) using standard methods (Talbot et al. 1968). Stimuli were delivered to the distal fingerpads of digits 2–5. Monkeys were anesthetized with intravenous pentobarbital sodium. A 1-in incision was made on the upper or lower arm, and blunt dissection was used to isolate the ulnar or median nerve. A skin flap pool was formed at the incision site by suturing the skin margins to a stainless steel ring (35 mm diam). The pool was filled with paraffin oil and a small dissecting mirror was placed under the nerve. The nerve sheath was dissected under a microscope using fine forceps and a pair of iris scissors. A small bundle of axons was cut proximally, separated from the nerve trunk, and placed on the mirror. This bundle of axons was repeatedly split until it was possible to activate a single mechanoreceptive afferent when the skin was stimulated with a handheld probe.
Standard procedures were used to classify mechanoreceptive afferents according to their responses to step indentations (Freeman and Johnson 1982a,b; Talbot et al. 1968). If the afferent produced a sustained response to an indentation, it was classified as SA1; if it responded transiently to the onset and offset of the indentation, it was classified as RA unless it responded to air puffs and had a large receptive field, in which case it was classified as PC. However, Pacinian fiber responses were not recorded as they are insensitive to the fine spatial structure of the stimulus (Johnson 2001). The point of maximum sensitivity of the afferent was located on the skin using a handheld probe and marked with a felt-point pen. The probe array was then centered on the afferent’s hotspot.
Continuum mechanical model
The model is a natural extension of an existing continuum mechanical model applicable to one-dimensional (grating) stimuli (Phillips and Johnson 1981b). The computation of the afferent response is performed in three steps as described in RESULTS.
Computation of equivalent forces (step 1)
The skin is assumed to be infinite in extent from the point of view of the receptor. Individual probes in the stimulus array are taken to be point loads acting on the surface of the skin, the net effect of which is the specified indentation pattern. The displacement D produced in the skin by a point load P acting at the origin is inversely proportional to the distance r from the origin (Timoshenko and Goodier 1970)
| (1) |
where E is the modulus of elasticity, and ν is Poisson’s ratio, a measure of compressibility (see following text). This solution was modified in two ways. First, because it predicts an infinite displacement at the origin (where r = 0), displacements within a radius r0 (= 0.3 mm, half the distance between probe centers) are taken to be constant. Second, the solution predicts a nonzero skin displacement at all distances from the point of application of the force. In reality, afferent responses are unaffected by forces acting at a distance greater than rb ~ 3 mm from the receptor (Phillips and Johnson 1981b). Accordingly, the displacement solution was modified to find the value of rb that best approximated the measured skin displacement due to a line load on the monkey fingerpad (Srinivasan 1989) (Fig. 1A). In fact, model predictions were found to be relatively insensitive to changes in rb.
Fig. 1.
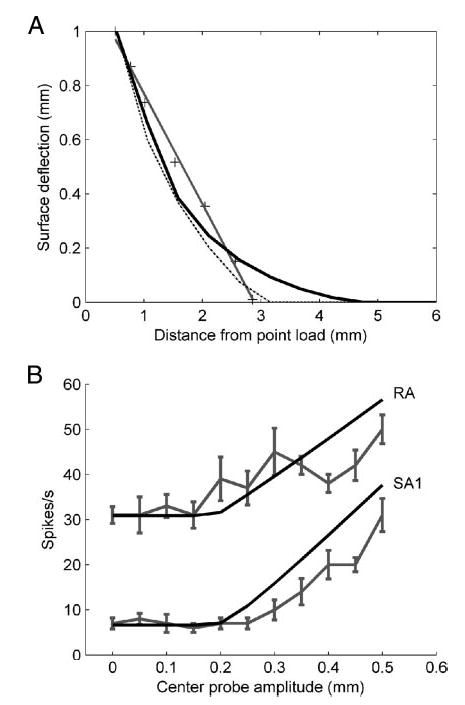
A: skin deflection as a function of distance from a line load. Crosses indicate measured data from the monkey finger (Srinivasan 1989). The black line indicates the surface deflection predicted by the point load model used in this study. Best fit rb was obtained as 4.26 mm using a nonlinear least-squares method (lsqcurvefit, Matlab 7.0, MathWorks MA). For comparison, predictions using previously published line load (Phillips and Johnson 1981b) and waterbed (Srinivasan 1989) models are shown as dotted and dark gray lines, respectively. B: responses of an SA1 unit (p4b_14_00) and an RA unit (p4b_21_00) to an annulus of height 0.5 mm and radius 3 mm, with varying center probe amplitude. The annulus was centered around the hotspot of the afferent’s receptive field. The gray line with error bars indicates the firing rate computed during the trial duration. Error bars represent SE. The black lines indicate the predicted response of the model using maximum tensile strain (for the SA1 unit) and relative change in area (for the RA unit).
A tactile stimulus is initially specified as a pattern of displacements. However, not all regions of the stimulus contact the skin. For example, the ridges of a square-wave grating will always contact the skin, whereas the grooves may or may not depending on their depth and width. Therefore, to redefine a stimulus as a set of equivalent forces, we need to identify the stimulus elements that contact the skin and compute the forces these elements exert on the skin.
Afferents adapt to the baseline indentation amplitude (Vega-Bermudez and Johnson 1999b). Therefore probes that are level with the baseline indentation are excluded from the force computations at the outset. Assuming that the remaining probes indeed contact the skin, the equivalent pattern of forces is computed, following the approach of Phillips and Johnson (1981b). Briefly, the displacement at each probe location is taken to be the sum of the effects of the forces exerted by all the probes. The resulting set of simultaneous equations for all probe locations can be written as the matrix equation S = PC, where S is a vector containing the displacement of the d probes, P is a vector of forces exerted by the probes and C is a d × d square matrix the (i, j)-th entry of which is the displacement produced at location i by a unit force at probe j. The solution to the matrix equation is given by P = SC−1.
Iterative contact-detection algorithm
The initial force computation assumes that every probe above the baseline indentation exerts a force on the skin, contributing to the overall displacement. However, a large-amplitude probe indented into the skin will prevent a small-amplitude probe from contacting the skin if the latter is sufficiently nearby. When the small-amplitude probe is included in the force computation, a negative load is assigned to that location to force the skin to conform to the stimulus, implying erroneously that this probe pulls on the skin. Therefore we concluded that probes to which negative loads were assigned did not contact the skin and thus excluded them from the force computations. However, the removal of one or more probes causes a redistribution of the forces exerted by the remaining probes. Therefore we iteratively computed the equivalent pattern of forces as follows: first, we computed the forces including all probes that were above baseline. Next, the forces were recomputed after excluding probes exerting negative loads. This step was repeated until there were no negative values in the load vector P.
The contact-detection algorithm was indirectly validated by the close match between model predictions and afferent responses to annuli with a center probe of varying amplitude. Specifically, the model was able to predict the smallest amplitude at which the central probe begins to affect the neural response (Fig. 1B). The agreement between model and data is an indirect demonstration that the actual skin surface deflections are closely approximated by the model.
Stress and strain tensor computation (step 2)
The stress tensor at any point under the skin specifies the forces acting on an infinitesimal cube centered at that point. Strain is defined as the change in length as a fraction of the original length along a specified direction. When the material is in static equilibrium, forces acting on opposing faces of the cube cancel out. Thus the stress tensor consists of six components: three normal forces (that produce compressive or tensile deformations) together with three shearing forces (that result in shearing deformations). Similarly, the strain tensor specifies the complete state of deformation of an infinitesimal cube relative to its original dimensions.
We assume the skin to be homogenous, isotropic, infinite, and linearly elastic. Note that the assumption of an infinite medium is justified because only nearby forces affect the receptor (see following text). We use the convention that compressive strains and stresses are positive. The stresses and strains due to a point load are naturally specified in cylindrical coordinates, with the origin at the point of indentation and the axis (z) perpendicular to the surface of the skin. Thus the stress tensor σ at point (r,θ,z) (in cylindrical coordinates) due to a point load P acting at the origin can be specified as (Timoshenko and Goodier 1970)
| (2) |
where, in Cartesian coordinates (x,y,z), and ν is Poisson’s ratio [set to 0.4; see Wu et al. 2004); Poisson’s ratio for an incompressible medium is 0.5]. The z axis is orthogonal to the surface of the skin (with positive values indicating locations beneath the surface), and the y axis is oriented along the axis of the finger.
The stresses produced by multiple point loads cannot be summed directly because each stress tensor belongs to a different cylindrical coordinate frame. Thus we redefined the stresses in Cartesian coordinates using the standard coordinate transformation formula for tensors (Timoshenko and Goodier 1970) before we summed them
| (3) |
Hooke’s law specifies the relationship between stress and strain for a linearly elastic material. This yields the strain tensor ε in Cartesian coordinates
| (4) |
where δij is the Kronecker delta function. Because the predicted response is a rectified linear function of strain, the elastic modulus of the skin does not affect the model predictions and was taken to be unity.
Candidate variables
A mechanoreceptor may, in principle, be sensitive to any combination of stresses or strains described in the preceding text. However, its response cannot depend on the coordinate system orientation either (a) in the plane parallel to the skin surface (i.e., the x-y plane) for vertical or horizontal tensor components or (b) in any direction (i.e., regardless of the orientation of the axes) for all other tensor components. Thus we required candidate variables to be invariant to all rotations (except vertical and horizontal tensor components, which were required to be invariant to rotations in the x-y plane). Whether individual mechanoreceptors are orientation selective is unknown. However, the evidence suggests that they are not and that the observed orientation selectivity in the response is most likely due to afferent branching (see DISCUSSION). The 15 candidate variables considered in this study are summarized in Table 1.
TABLE 1.
Summary of candidate variables
| Candidate Physical Quantity | Effect on the Receptor | SA1 (n = 12) | RA (n = 8) |
|---|---|---|---|
| Vertical strain, ɛ2 | Elongation along the axis perpendicular to the skin surface | 0.86 ± 0.03 | 0.94 ± 0.01 |
| Maximum horizontal strain, ɛh | Maximum elongation parallel to the skin surface | 0.75 ± 0.03 | 0.89 ± 0.01 |
| Maximum compressive strain, ɛc | Maximum compression in any direction | 0.87 ± 0.02 | 0.94 ± 0.01 |
| Maximum tensile strain, ɛt | Maximum elongation in any direction | 0.87 ± 0.02 | 0.94 ± 0.01 |
| Maximum deformative strain, ɛm | Maximum deformation in any direction, compressive or tensile | 0.87 ± 0.02 | 0.94 ± 0.01 |
| Mean strain, Tr(ɛ) | Average deformation | 0.83 ± 0.03 | 0.94 ± 0.01 |
| Strain determinant, det(ɛ) | Volumetric deformation (indirect measure) | 0.76 ± 0.02 | 0.88 ± 0.01 |
| Relative change in area, σS | Relative change in surface area | 0.85 ± 0.03 | 0.95 ± 0.01 |
| Vertical stress, σV | Pressure along the axis perpendicular to the skin surface | 0.85 ± 0.03 | 0.94 ± 0.01 |
| Maximum horizontal stress, σh | Maximum pressure parallel to the skin surface | 0.87 ± 0.02 | 0.95 ± 0.01 |
| Maximum compressive stress, σc | Maximum pressure in any direction | 0.87 ± 0.02 | 0.94 ± 0.01 |
| Maximum tensile stress, σt | Maximum pressure in any direction | 0.72 ± 0.04 | 0.88 ± 0.01 |
| Maximum deformative stress σm | Maximum pressure in any direction, compressive or tensile | 0.87 ± 0.02 | 0.94 ± 0.01 |
| Strain energy density, SED | Net work done on receptor | 0.84 ± 0.02 | 0.92 ± 0.01 |
| Relative change in volume, ΔV | Relative change in receptor volume | 0.83 ± 0.04 | 0.94 ± 0.01 |
Candidate variables hypothesized to drive transduction in slowly adapting type 1 (SA1) and rapidly adapting (RA) afferent fibers, along with the average correlations (±SE) between the predictions yielded by each variable and the observed responses to spheres, gratings, bars and punctate probes; 12 SA1 and 8 RA units were presented with all of these stimuli. Indented annuli were only presented to a subset of neurons and were therefore not included in these computations. Note that, although several variables (e.g., vertical strain) yielded high correlations, they produced erroneous predictions over a subset of stimuli; these deviations are not reflected in the correlation measure (see Fig. 9).
Strain (stress) components that are invariant to all rotations are characterized by the three eigenvalues of the strain (stress) tensor, together with its sum and product (Timoshenko and Goodier 1970). We included 6 of these 10 stress and strain invariants among the putative variables: the maximum eigenvalue of the strain (stress) tensor, called the maximum compressive strain (stress), represents the maximum compressive deformation (pressure) experienced by the receptor in any direction. Similarly the minimum eigenvalue, the maximum tensile strain (stress), represents the maximum tensile deformation (pressure) experienced by the receptor in any direction. The sum of strain eigenvalues is proportional to the mean deformation experienced by a receptor. For a linearly elastic material, the sum of the strain eigenvalues is proportional to the sum of the stress eigenvalues, so the two yield identical predictions. The product of the strain eigenvalues (i.e., the determinant of the strain tensor) was chosen as an indirect measure of volumetric deformation. The intermediate eigenvalues of the stress and strain tensors as well as the stress determinant were discarded from the analysis for lack of a clear physical interpretation.
In addition to these six candidate variables, we chose nine additional variables that correspond to physical quantities that might plausibly drive transduction: The vertical strain (stress) represents the deformation (pressure) in the vertical direction. The maximum horizontal strain (stress), i.e., the maximum absolute eigenvalue of the strain (stress) tensor in the (x-y) plane, represents the deformation (pressure) experienced by the receptor in the plane parallel to the surface of the skin. The maximum deformative strain (stress) represents the maximum magnitude of the distortion (pressure) experienced by the receptor regardless of whether it is tensile or compressive. The 1 strain energy density, given by represents the total energy expended to deform the receptor. Finally, we included the relative change in volume [given by (1 − ε1) (1 − ε2) (1 − ε3) − 1, where ε1, ε2, ε3 are the strain eigenvalues] and the relative change in surface area, δS, when an infinitesimal sphere is deformed into an ellipsoid. Because the exact calculation of the surface area of an ellipsoid involves elliptical integrals, we used Thomsen’s approximation (http://www.numericana.com/answer/ellipsoid.htm)
| (5) |
Parameter fitting
The mean firing rate evoked by a stimulus was used as a measure of the afferent response. The firing rate was computed over the entire trial (rather than over the stimulus duration) to incorporate the OFF response of RA fibers into the response measure. Note that the duration over which action potentials are counted only affects afferent responses linearly and thus only affects the linear parameters (threshold and sensitivity) in the model. Furthermore, the spatial modulation of SA1 responses to gratings has been found to be independent of the interval over which spikes are counted (Phillips and Johnson 1981a).
For a given candidate variable, the model parameters include the (x,y,z) location of the point receptor, together with its sensitivity and threshold. For each stimulus in a given set (e.g., square-wave gratings), we computed the equivalent force profiles and used them, along with the evoked responses, as input to a standard nonlinear fitting algorithm (lsqcurvefit, Matlab 7.0, MathWorks, MA) to find the parameter values that minimize the sum of squared differences between predicted and observed responses. The initial parameter values were the location of the afferent’s hotspot (estimated using the punctate probe response map), together with randomized values for receptor depth, sensitivity, and threshold. Fitted parameter values were insensitive to the choice of the stimulus-response set. To compute model predictions for one set of stimuli using the parameters obtained from another, the (x,y,z) location of the receptor was fixed. The threshold and sensitivity parameters were, however, modified because firing rates scaled linearly with stimulus duration, which itself varied across stimulus sets. In addition, different stimulus sets may have caused varying degrees of adaptation in the afferents (Bensmaia et al. 2005b). Note that changes in threshold and sensitivity do not affect the form of the modulation in the neural response; in other words, the spatial profile of the response to indented spatial patterns is unaffected by linear scaling.
RESULTS
We recorded the responses of 14 SA1 and 10 RA afferents to a wide variety of spatial patterns delivered to the distal fingerpads of three macaque monkeys. Patterns were generated using a newly developed stimulator consisting of 400 individually controlled probes arrayed over a 1-cm2 area. The stimuli—point probes, bars, square-wave gratings, spheres, and annuli—were indented into the skin, each for ~100 ms. We used the firing rate evoked during each stimulus presentation, averaged across repetitions, as a measure of the afferent response.
Model predictions were computed in three steps as illustrated in Fig. 2A. Calculations of stress and strain in continuum mechanics require a stimulus to be specified in terms of forces that produce a material displacement (Timoshenko and Goodier 1970). Because tactile stimuli are initially specified as two-dimensional arrays of displacements, we first convert each pattern of displacements into an equivalent pattern of forces, assuming that each probe contributes linearly to the nearby skin displacement (see METHODS). Then a candidate variable of interest ε is computed for a given receptor location (x,y,z). Thus mechanotransduction is assumed to effectively take place at a single point in the skin (however, see DISCUSSION on multiple receptors). Finally, ε is linearly scaled and rectified to obtain the predicted afferent response r. The receptor location, threshold, and sensitivity are adjusted to obtain the least squared difference between the predicted and observed responses.
Fig. 2.
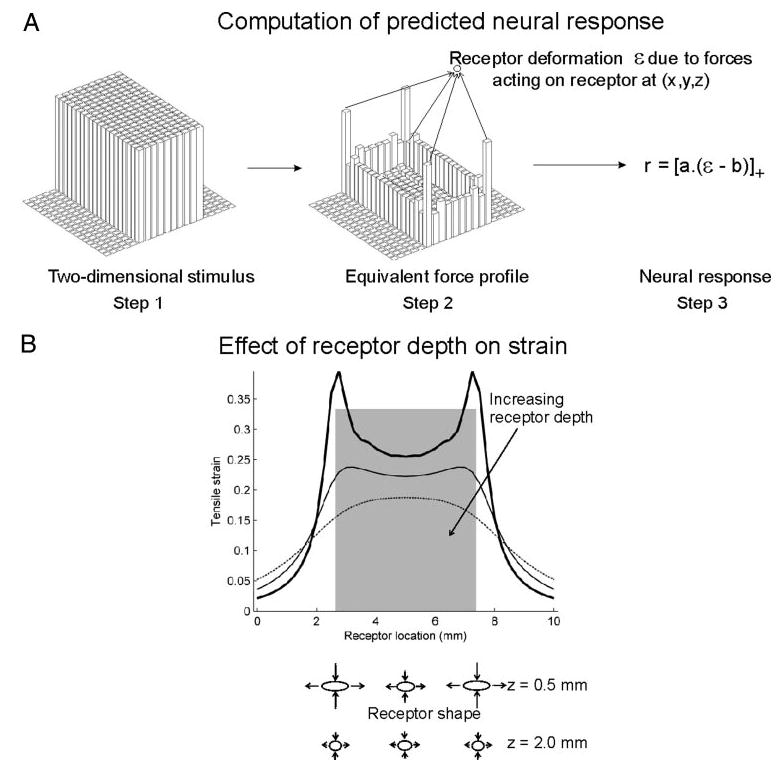
A: schematic description of the computation of the neural response using the continuum mechanical model. First, a 2-dimensional stimulus (here, an indented bar) is redefined in terms of the forces required to produce this pattern of indentations (step 1). Next, this equivalent force profile is used to compute the stress/strain variable ε at a point receptor located at (x,y,z) within the skin (step 2; positive z values indicate depths below the resting skin surface). Finally, the stress/strain variable ε is scaled linearly and rectified to obtain the predicted neural response (step 3). The scalars a and b represent the afferent’s sensitivity and threshold, respectively. B: maximum tensile strain experienced along the cross-section of an indented bar (shaded region) by an array of receptors at 3 depths: 0.5 mm (thick line), 1 mm (thin line) and 2 mm (dotted line). If a spherical receptor is deformed into an ellipsoid, the length along the major (minor) axis is linearly related to the maximum tensile (compressive) strain; this is schematically shown under the abscissa for depths z = 0.5 and z = 2 mm. Edge enhancement (e.g., at z = 0.5 mm) occurs in the responses of SA1 but not RA afferents (see also Fig. 10).
An important feature of the conversion from displacements to forces is that probes along the edges of a stimulus must exert more force because they displace more skin than probes in the center (Fig. 2). Furthermore, stress and strain components are strongly affected by receptor depth. Figure 2B shows the tensile strain computed for a hypothetical array of receptors located in the skin under an indented bar. If the receptors are shallow (z = 0.5 mm), the strain profile resembles the force profile and exhibits a natural edge enhancement. If the receptors are deeper (z = 2 mm), the edge effect is diffused, enhancement disappears, and the strain is maximal at the center of the bar instead of at the edges (compare z = 0.5, 2 mm). The spatial modulation of strain and stress thus decreases with increasing receptor depth.
We present our results in two parts. We first demonstrate the close correspondence between SA1 responses and predictions from maximum tensile strain (the relative elongation of the receptor) and between RA responses and predictions from the relative change in area of the receptor. We then present an analysis of 15 physical variables we hypothesized to drive mechanotransduction, eliminate 9, and conclude that, among the remaining 6, measures closely associated with receptor membrane stretch best match SA1 and RA responses.
Model predictions of SA1 afferent responses
Figure 3 illustrates the close agreement between the responses of an SA1 neuron to indented spheres and model predictions using maximum tensile strain fitted to these data. The model captures the nonmonotonic relationship between the neural response and curvature: the response initially increases for radii ≤4 mm and then decreases. According to the model, the maximum tensile strain initially increases as more probes contact the skin. However, as the curvature radius increases further, the force is redistributed across an increasing number of probes, which results in an overall reduction in local strain. The afferent response does not decrease monotonically with distance because the afferent’s receptive field was radially asymmetric (note that distance was measured from the center of the sphere to the afferent’s hotspot).
Fig. 3.
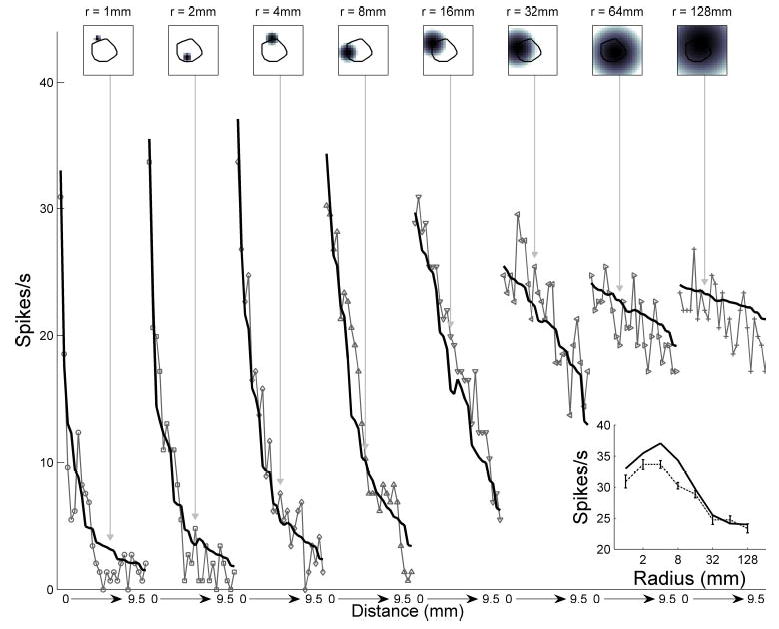
Response of an SA1 unit (p4b_03_00) to indented spheres (light gray), together with fitted model predictions using maximum tensile strain (black). Top: spheres of increasing radius of curvature were indented with their centers at increasing distances from the afferent’s hotspot. Stimuli corresponding to selected responses are shown on top, together with a superimposed outline of the neuron’s receptive field obtained using punctate probes (black line). The grayscale value of each pixel in the stimulus represents the amplitude of the corresponding probe in the 20 × 20 stimulator array with dimensions 1 × 1 cm (see METHODS). Bottom: connected lines indicate the neuron’s responses to a sphere of a given radius successively indented at different spatial locations in the array. The fitted depth was z = 0.89 mm. Inset: observed and predicted peak responses as a function of curvature. Error bars indicate SE. Correlation between model and data was 0.97.
If the model accurately describes the transduction process, the receptor location obtained when the model is fit using afferent responses to one set of stimuli should generalize to all other stimuli. Figure 4 illustrates model predictions of the same SA1 neuron’s responses to square-wave gratings using the receptor location obtained from its responses to spheres. The model was able to capture the essential features of the data (correlation = 0.92), including the characteristic SA1 edge enhancement (Phillips and Johnson 1981a) (see Fig. 4, bottom). Figure 5 illustrates the close match between the observed and predicted responses of the same SA1 unit to punctate probes and oriented bars. A bar produces a strong response when it spans the long axis of the receptive field and/or when its edge is near the hotspot. According to the model, these factors account for the apparent orientation selectivity observed in Fig. 5. The top panels in Fig. 5 illustrate the predicted and observed punctate probe receptive fields. In general, the model’s failure to account for the ellipticity of the receptive field accounted for a significant portion of its lack of fit (see DISCUSSION).
Fig. 4.
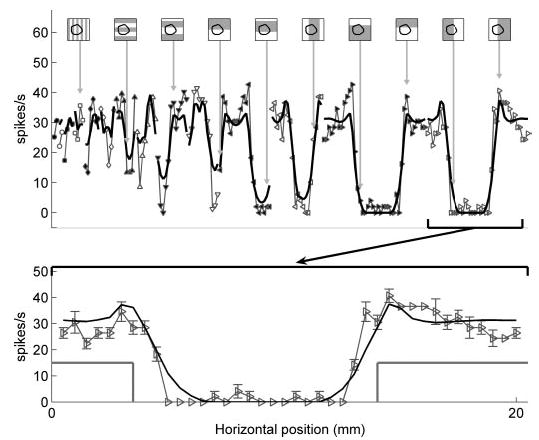
Response of the SA1 unit (p4b_03_00) to square-wave gratings (light gray), together with model predictions (black) using the receptor location obtained from indented spheres (Fig. 3). Top: stimuli were square-wave gratings of increasing spatial periods (marked analogously to Fig. 3). The superimposed black contour is the contour of the fiber’s receptive field. Connected lines indicate the neuron’s responses to identical gratings that were successively indented at vertically or horizontally shifted spatial locations. Correlation between predicted and observed responses was 0.92. Bottom: detailed view of responses to gratings with spatial period 20 mm (corresponding to the gratings on the far right of the top plot). The gray line indicates the cross-section of the grating. The response of the neuron to this grating indented at several horizontal locations is shown (gray), together with model predictions (black). Error bars indicate SE.
Fig. 5.
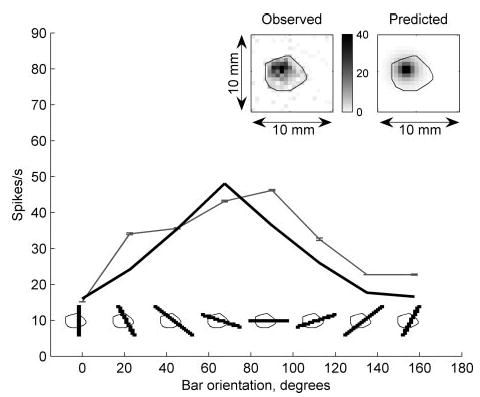
Response of the same SA1 unit (p4b_03_00) to indented bars and punctate probes. The afferent response as a function of bar orientation is shown in gray (bars shown below). The model prediction is shown in black. The model receptor location was obtained using responses to indented spheres. The correlation coefficient between observed and predicted responses over all 88 oriented bars was 0.97. The black contour superimposed on each bar outlines the extent of the receptive field as mapped by punctate probe indentations (0.3-mm amplitude). Inset, left: 2-dimensional plot of observed response to punctate probe indentations. The grayscale value indicates the afferent firing rate when the probe in the corresponding pixel was indented 0.3 mm into the skin. Inset, right: predicted response of the model using maximum tensile strain. In both punctate probe response maps, the black outline denotes the boundary of the observed receptive field. Pixel-by-pixel correlation between the maps was 0.88.
Model predictions of RA responses
Figure 6 illustrates the close agreement between the responses of an RA afferent fiber to indented spheres and model predictions using relative change in area. The model captures the monotonic relationship between the neural response and curvature: as the curvature increases, a larger portion of the receptive field is stimulated, and the RA response increases. Note that the model makes contrasting predictions about the relationship between neural response and curvature for SA1 and RA fibers (Figs. 3 and 6); the parameter that determines the shape of this function is the receptor depth z (see DISCUSSION).
Fig. 6.
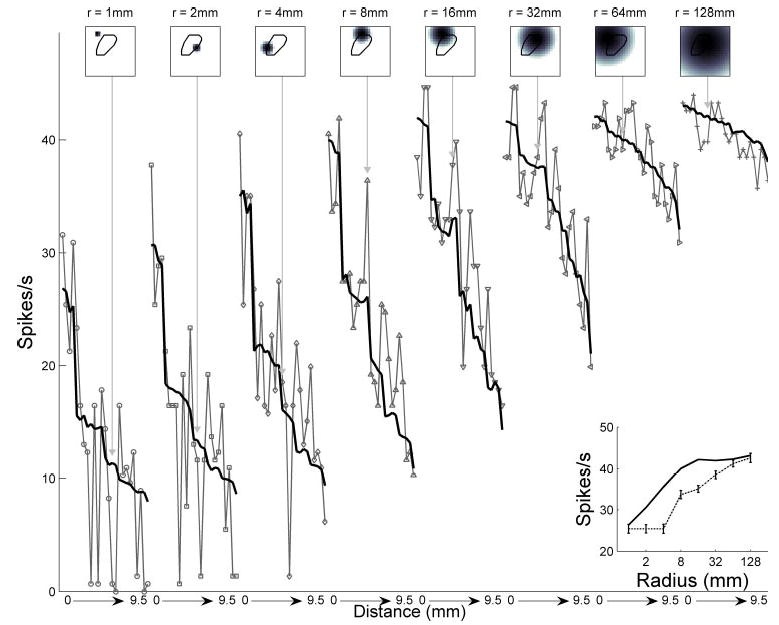
Responses of an RA unit (p4b_06_03) to indented spheres, together with model predictions obtained from relative change in area. Conventions as in Fig. 3. Correlation between model and data was 0.93.
Figure 7 illustrates model predictions of the same RA neuron’s responses to square-wave gratings using the receptor location obtained from its responses to spheres (correlation = 0.9). In contrast to the edge enhancement observed in the SA1 response, RA responses exhibited little edge enhancement, a feature also reflected in model predictions (Fig. 7, bottom; see DISCUSSION). Figure 8 illustrates the close match between the observed and predicted responses of this RA unit to punctate probes and oriented bars. The top panels in Fig. 8 illustrate the predicted and observed punctate probe receptive fields.
Fig. 7.
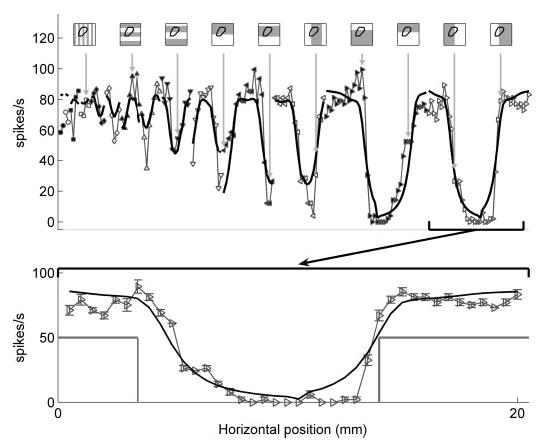
Responses of the RA unit (p4b_06_03) to square-wave gratings together with model predictions from relative change in area. Predictions were obtained using parameters obtained from responses to spheres. Conventions as in Fig. 4. Correlation = 0.90.
Fig. 8.
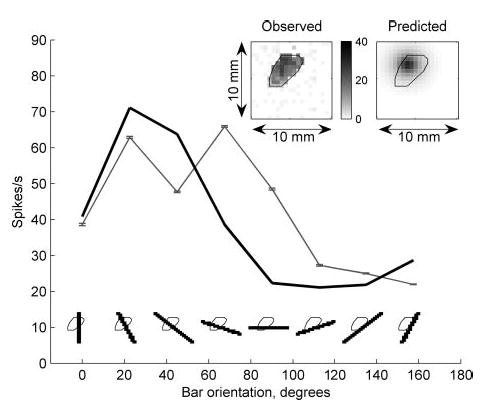
Responses of the RA unit (p4b_06_03) to bars and punctate probes together with model predictions from relative change in area. Predictions were obtained using the responses to indented spheres. Conventions as in Fig. 5. Correlation = 0.91 and 0.80 for bars and punctate probes, respectively.
Summary of model performance across neurons
Overall, model predictions derived from maximum tensile strain matched SA1 responses to a high degree of accuracy, whereas RA responses were best predicted using the relative change in receptor surface area (minimum, mean, and maximum correlations between model predictions and observed responses to spheres, gratings, bars and punctate probes were 0.76, 0.86, and 0.96 for SA1 afferents using maximum tensile strain and 0.90, 0.94 and 0.96 for RA fibers using relative change in area). Fitted receptor depths for RA afferents were deeper compared with their SA1 counterparts (minimum, mean and maximum depths were 0.41, 0.77 and 1.76 mm for SA1 and 0.47, 1.62 and 4.44 mm for RA fibers). Results were relatively insensitive to the choice of stimulus-response set used to obtain the receptor location.
Because neural responses are often characterized using linear receptive fields (DiCarlo et al. 1998), we also examined the extent to which a linear model could predict afferent responses. Predictions derived from a displacement-based linear model (comprising 400 parameters, 1 for each probe) were always worse than those from the continuum mechanical model, especially for gratings (mean correlations, linear versus continuum mechanical model, spheres: SA1, 0.68 vs. 0.80; RA, 0.80 vs. 0.86; gratings: SA1, 0.45 vs. 0.77; RA, 0.55 vs. 0.78). A linear model is expected to perform poorly in predicting grating stimuli because it does not take into account the redistribution of forces when several elements contact the skin.
Analysis of candidate variables
Because there is no consensus as to the physical variable that drives SA1 and RA mechanotransduction, we generated a list of 15 candidate variables (Table 1) that we hypothesized might be implicated in transduction. All previously proposed candidates were included in this list (Dandekar and Srinivasan 1997; Del Prete et al. 2003; Ge and Khalsa 2002; Khalsa et al. 1996, 1997; Phillips and Johnson 1981b; Srinivasan and Dandekar 1996) as well as other potentially relevant quantities; together, these quantities fell into two categories. The first category consisted of basic quantities in continuum mechanics that specify meaningful aspects of the state of the receptor (e.g., maximum compressive stress is the maximum pressure experienced by the receptor in any direction). The second group comprised quantities that are relevant to the specific problem of receptor deformation (e.g., relative change in receptor surface area).
For each of the 15 candidate variables, we obtained the best-fitting receptor location for each afferent using its responses to indented spheres. We then evaluated the performance of each candidate variable based on whether predictions derived from it were consistent with the data. Table 1 summarizes the model performance over all stimuli using each candidate variable.
As can be inferred from Table 1, most candidate variables co-vary with the coarse spatial structure of the stimulus as do afferent responses. For example, stresses and strains tend to be larger (and responses stronger) when the receptor is under a grating ridge than when it is under a groove. Thus many candidate variables yielded similar (and comparably accurate) model predictions. For the SA1 unit described earlier, the correlations between observed responses to spheres and predictions derived from the 15 candidate variables were 0.97 (vertical stress), 0.97 (vertical strain), 0.97 (maximum tensile strain), 0.97 (area change), 0.96 (mean strain), 0.96 (maximum horizontal stress), 0.96 (maximum. deformative stress), 0.96 (maximum deformative strain), 0.96 (maximum compressive stress), 0.96 (maximum compressive strain), 0.95 (receptor volume change), 0.92 (strain energy density), 0.89 (maximum horizontal strain), 0.86 (maximum. tensile stress), and 0.86 (strain determinant). We were able to eliminate maximum tensile stress and the strain determinant from further consideration because of their poor performance in predicting the responses to spheres and gratings for all neurons.
Even though model predictions derived from the remaining 13 candidate variables matched the coarse structure of the neural responses to spheres and gratings, they differed in their fine structure. Therefore we devised stimuli for which at least a subset of these variables would yield measurably divergent predictions.
Spatial response map using punctate probes
Maximum horizontal stress predicts a dip in the neural response when a punctate probe is positioned directly above the receptor (i.e., at the hotspot) because the stress at the receptor is predominantly vertical (Fig. 9A). In contrast, the maximum horizontal strain is large when the probe is above the receptor (the receptor is compressed in the vertical direction but elongated along the horizontal) as well as when the probe is nearby but not directly above it (the receptor is compressed by the compressive horizontal force exerted by the probe). Thus maximum horizontal strain dips at a distance from the hotspot at which the vertical and horizontal forces cancel out the receptor deformation they each produce. These minima in the responses predicted by maximum horizontal stress and maximum horizontal strain are inconsistent with the data.
Fig. 9.
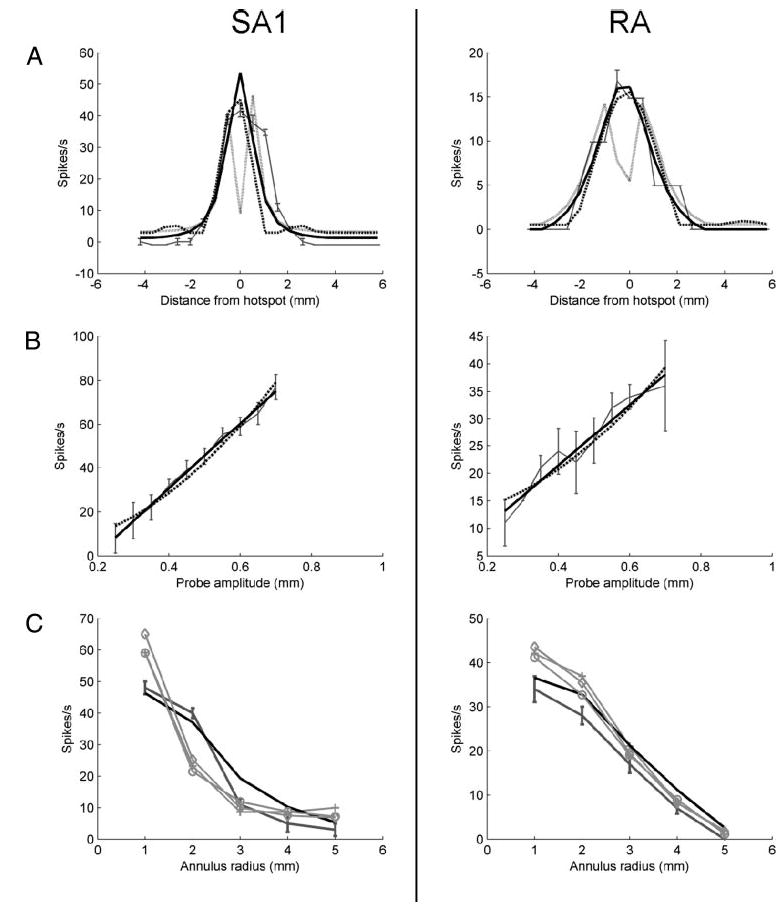
A, left: cross-section of the observed spatial response map of SA1 unit p4b_11_00 using punctate probe indentations (dark gray). Response map predictions using receptor location fitted from the spherical data are shown for maximum horizontal strain (light gray, solid), maximum horizontal stress (dashed), and maximum tensile strain (thick black line, solid). Right: corresponding plot for RA unit p4b_13_00. The thick black line indicates predictions obtained using relative change in area. B, left: response of SA1 unit p4b_25_01 as a function of the amplitude of a punctate probe indented at the center of the receptive field. Observed response is shown in dark gray; error bars denote SE. Predicted responses using maximum tensile strain and relative change in volume are shown as solid and dotted lines, respectively. Right: corresponding plot for RA unit p4b_19_01. Solid and dotted lines indicate relative change in area and relative change in volume, respectively. Both strain energy density and relative change in volume were quadratic functions of probe amplitude. C, left: responses of SA1 unit p4b_11_00 to indented annuli of increasing radius. Afferent response is shown in dark gray; error bars denote SE. Predicted responses: thick black, maximum tensile strain; gray crosses, vertical strain; gray circles, mean strain; gray diamonds, vertical stress. Right: responses of RA unit p4b_19_01 to indented annuli (dark gray with error bars), with predicted responses using relative change in area (black), vertical strain (crosses), mean strain (circles), vertical stress (diamonds).
Response as a function of probe amplitude
All but two candidate variables, namely strain energy density and relative change in receptor volume, predict a linear relationship between afferent firing rate and the amplitude of a punctate probe indented into the skin. We characterized the rate-intensity function by indenting probes at various amplitudes and at locations on and around the afferent’s hotspot. These rate-intensity functions were fitted significantly better by a line (y = ax +b) than a parabola (y = ax2 + b) for both SA1 and RA fibers (i.e., the correlations obtained using a linear fit were significantly larger than those using a parabolic fit; paired t-test on Fisher z-transformed correlations: t = 2.91 and 4.51 for SA1 and RA, respectively; P < 0.005). Indeed, SA1 responses are known to be linear over a wide range of indentations, and RA responses are linear over the range of indentation velocities used here (0 – 40 mm/s) (Knibestöl 1973). As strain energy density and relative change in receptor volume predict a quadratic relationship between neural response and stimulus amplitude, they were regarded as less likely to drive transduction. Figure 9B illustrates the measured rate-intensity functions along with model predictions for an SA1 and an RA unit.
Response to annuli of increasing radius
When the radius of an annulus is increased, the vertical stress and strain at its center decrease rapidly. On the other hand, tensile and compressive components of strain are affected by both vertical and horizontal forces and tend to decrease less rapidly (Fig. 9C). Overall, we found that afferent responses to annuli of varying radius were matched poorly by predictions from vertical strain and stress as well as from mean strain.
Thus 10 of 15 candidate variables were regarded as less likely to drive mechanotransduction. The remaining six variables were: maximum compressive strain and stress, maximum deformative strain and stress, maximum tensile strain, and relative change in receptor area. These six variables yielded reliable and very similar predictions of afferent responses to the stimuli. However, we found slight but consistent differences in their performance. These differences, albeit statistically significant, were present only in the third significant digit of the correlations. Relative change in area more closely matched RA afferent responses than the remaining five variables (correlation = 0.94; paired t-test on Fisher-transformed correlations, P < 0.05). For SA1 afferents, maximum tensile strain performed better overall than the other five variables, but this difference was significant only for oriented bars (correlation = 0.9; paired t-test on Fisher-transformed correlations, P < 0.05). Previous studies have also reported comparably close correspondence between predictions derived from pairs of candidate variables (Phillips and Johnson 1981b; Srinivasan and Dandekar 1996). Nonetheless, we favor the hypotheses that maximum tensile strain drives SA1 mechanotransduction and that change in receptor surface area drives RA transduction. Of all the candidate variables, these two quantities are most closely associated with the local stretch experienced by the receptor. Further work will be required to conclusively disambiguate the predictions yielded by the six hypotheses that could not be eliminated outright. Importantly, however, the model, using any of the above six hypotheses, provides an accurate working description of the peripheral representation of tactile spatial patterns.
DISCUSSION
In vision, audition, and touch, an external stimulus is transformed into an intermediate signal, the proximal stimulus, which impinges on a receptor sheet at the sensory periphery. Whereas it is reasonably well characterized in vision and audition, this transformation has received considerably less attention in the tactile modality, in part because it is difficult to observe. In fact, a consensus has not been reached as to the nature of the proximal stimulus in touch, i.e., the physical quantity transduced by mechanoreceptors (Dandekar and Srinivasan 1997; Del Prete et al. 2003; Ge and Khalsa 2002; Khalsa et al. 1996, 1997; Phillips and Johnson 1981b; Srinivasan and Dandekar 1996). In the present study, we develop a general framework characterizing the spatial component of the transformation from distal to proximal stimulus. Within this framework, we generate and evaluate hypotheses regarding the nature of the proximal stimulus. The resulting model is directly applicable to any tactile stimulus whose spatial properties do not vary over time (see following text). In addition to being a theoretical tool, the model can also be used to characterize the peripheral representation of an arbitrary spatial stimulus indented into the skin. This reconstructed representation can then be used to understand subsequent cortical processing or psychophysical judgments without having to collect relevant peripheral data.
The framework presented in this study builds on previous work by Phillips and Johnson (1981b) in several ways. First, our model is applicable to any static tactile stimulus, whereas its predecessor only predicts responses to stimuli the profiles of which varied along one dimension (i.e., gratings). Second, we developed an algorithm that identifies stimulus elements that contact the skin and excludes elements that do not from the computation of equivalent forces. The contact-detection algorithm does not affect force computations for stimuli such as square-wave gratings with all-or-none modulations but plays a critical role for more spatially complex stimuli. Finally, the framework allowed us to systematically evaluate 15 physical variables hypothesized to drive mechanotransduction.
The 15 candidate variables included previously proposed quantities as well as others that we deemed physiologically plausible. By comparing the predictions with the data, we eliminated maximum horizontal strain, maximum horizontal stress, vertical strain, vertical stress, maximum tensile stress, strain energy density, change in receptor volume, and the determinants of stress and strain. The remaining six candidate variables yielded comparable predictions of SA1 and RA responses to a wide range of stimuli; we cannot rule out relative change in receptor area, maximum compressive strain and stress, and maximum deformative strain and stress. Nevertheless, using only five parameters derived from responses to a subset of stimuli (the 200 indented spheres), the resulting model was able to account for each afferent’s responses to all 1,092 stimuli presented in this study with a high degree of accuracy.
One constraint on the stimuli was that the probe array was capable of delivering only forces normal to the surface of the skin. Consequently, all receptor deformations, whether compressive or tensile, were produced by normal (i.e., compressive) forces. Thus tensile and compressive components of stress and strain were highly (though not perfectly) correlated and may be distinguished more efficaciously by independently manipulating the tangential and normal forces acting on the skin. The present framework can be used as an analytical basis for further investigations of the stimulus quantity that drives transduction. To that end, the stress and strain produced by a tangential force must be incorporated into the present model. Such an extension of the model is important in itself, because the skin experiences both tangential and normal forces during scanning, the most common mode of tactile exploration.
In the present study, we tentatively conclude that maximum tensile strain likely drives SA1 mechanotransduction, whereas changes in receptor surface area drive RA transduction. Differences in the SA1 and RA receptor organs and their coupling with surrounding tissues may explain why SA1 and RA fibers are driven by different physical quantities (Johnson 2001). However, both of these quantities are closely related to the stretch experienced by the receptor membrane, which has been shown in biophysical studies to underlie mechanosensitive ion channel activation (Sukharev and Corey 2004). On the other hand, although SA1 afferents respond to skin stretch, they do so only weakly (Hulliger et al. 1979). The relationship between receptor membrane stretch and skin stretch is an empirical question and remains to be adequately characterized.
SA1 and RA fibers exhibit different spatiotemporal response properties and terminate in anatomically distinct structures. SA1 fibers have small receptive fields and produce a sustained response to a step indentation, whereas RA fibers have larger receptive fields and produce a transient response at the onset and offset of an indentation (Johnson 2001; Talbot et al. 1968). SA1 afferents terminate in Merkel cells, whereas RA afferents terminate in Meissner corpuscles (Johnson 2001). While Merkel cells enfold the nerve ending, Meissner corpuscles consist of encapsulated, vertically stacked discoid nerve endings (Johnson 2001; Takahashi-Iwanaga and Shimoda 2003). The mechanical filtering effected by these structures is thought to contribute to the temporal response properties of the two afferent types (Grigg 1986; Johnson 2001). Differences in the temporal response properties of SA1 and RA fibers do not imply that transduction in their respective receptors is driven by different physical quantities. Indeed, we hypothesize that the two types of receptor transduce different temporal features of the same physical quantity, i.e., stretch of the receptor membrane. RA afferents may respond to the rate at which the membrane is stretched, whereas SA1 fibers directly respond to membrane stretch. Because velocity is proportional to position for indented stimuli, sensitivity to membrane stretch or to its derivative yield identical predictions. Testing this hypothesis will require analyzing responses to stimuli the position and velocity of which can be independently manipulated.
The best-fitting depths obtained for SA1 fibers were shallower than for their RA counterparts, consistent with the higher spatial selectivity of SA1 relative to RA fibers. As mentioned earlier, the spatial modulation of strain and stress decreases with increasing receptor depth (Fig. 2). Figure 9A illustrates the difference in spatial filtering of SA1 and RA responses: SA1 responses exhibit much greater edge enhancement than RA responses (Phillips and Johnson 1981b). The fitted receptor depths, however, are incompatible with the relative anatomical locations of Merkel cells and Meissner corpuscles: Merkel cells in the monkey are located at the bottom of the dermal papillae, roughly 0.6 mm below the surface, whereas Meissner corpuscles can be found at the tips of the papillary ridges near the surface of the skin, (i.e., ~ 0.4 mm deep). On the other hand, RA afferents branch more widely than SA1 afferents (Pare et al. 2002), which increases the degree of spatial filtering of their responses. Furthermore, the measured receptive field size tends to be larger and grow more rapidly with indentation amplitude for RA than for SA1 fibers. Because RA fibers branch widely, punctate probe indentations tend to recruit a larger number of receptors compared with SA1 fibers, especially with larger indentations (Vega-Bermudez and Johnson 1999a). The model achieves these effects by driving the RA receptors deeper relative to their SA1 counterparts. This effect can be counteracted by assuming that each afferent receives input from more than one receptor.
Another manifestation of afferent branching is the ellipticity in the receptive fields mapped using punctate probes (Vega-Bermudez and Johnson 1999a). Nearly half of the neurons of both types exhibited elliptical receptive fields. We found this to be the largest systematic deviation between the model and the data: a single point receptor predicts a circular map because of its inherent symmetry. We extended the model to include two point receptors at the same depth, assuming the response to be a weighted sum of the strain experienced by the two. A model that incorporates multiple receptors will yield more physiologically plausible depths, particularly for RA fibers in which widespread branching occurs (Pare et al. 2002). Furthermore, the evidence suggests that signal integration across receptors is not linear but rather winner-take-all (Phillips and Johnson 1981b). Indeed, when we modified the dual receptor model so that the afferent response was determined by the maximum activation across the two receptors, the fit improved beyond that of the linear summation model. The dual-receptor model, illustrated in Fig. 10B for one unit of each type, yielded considerably better fits and shallower depths, particularly for RA fibers (mean fitted depths: single receptor, SA1, 0.70 mm; RA, 1.23 mm; dual receptor, SA1, 0.44 mm; RA, 0.73 mm).
Fig. 10.
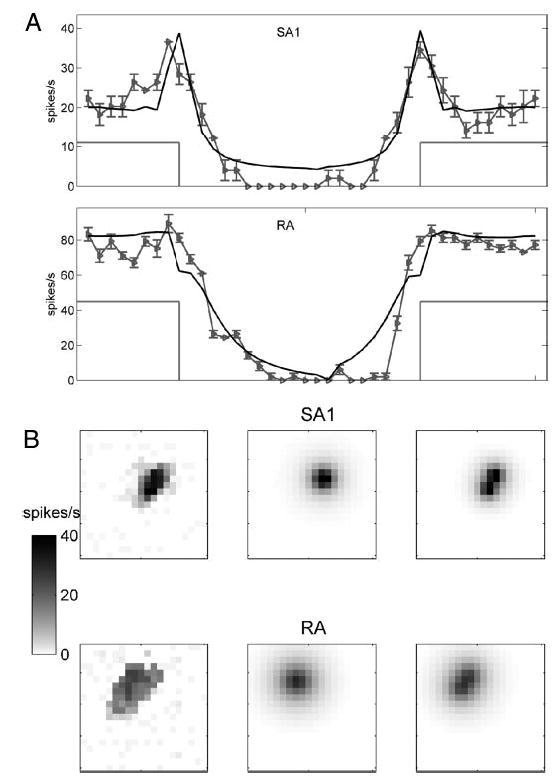
A: differences in edge sensitivity in SA1 and RA afferents. Top: responses of SA1 unit p4b_11_00 (gray) to a square-wave grating of period 20 mm stepped across the receptive field. Error bars denote SE. Model predictions using maximum tensile strain are shown in black. Bottom: responses of RA unit p4b_06_03 (gray) together with corresponding model predictions using relative change in receptor surface area (black). The light gray lines indicate the position of the grating at the afferent hotspots. B: illustration of the nonlinear dual receptor model for SA1 unit p4b_25_01 (top) and RA unit p4b_06_03 (bottom). The response was taken to be proportional to the maximum of the strains experienced by the 2 receptors. Left: Observed punctate probe response map. The grayscale values on the left indicate the response magnitude in spikes/s. Middle: predicted response map using single receptor model. Fitted depths: SA1 unit, 0.76 mm; RA unit, 1.49 mm. Right: predicted response map using the “max” dual receptor model. Fitted depths: SA1 unit, 0.60 mm; RA unit, 1.14 mm.
Within the proposed framework, the skin is assumed to be homogeneous, isotropic, linearly elastic, and infinite in extent from the point of view of the receptor. In fact, at least three of these assumptions are violated; the skin is finite, multi-layered and anisotropic (Lanir 1987; Quilliam 1978). This heterogeneity and the presence of surrounding structures such as nail and bone have been suggested to play a role in shaping afferent responses (Dandekar and Srinivasan 1995; Dandekar et al. 2003; Srinivasan and Dandekar 1992; Wu et al. 2004). However, the remarkable ability of the model to predict neural responses to a wide variety of stimuli suggests that the underlying idealized assumptions constitute a reasonable first approximation (Phillips and Johnson 1981b). We also made several assumptions, motivated by extant neurophysiological findings, about the transduction process. First, the response was assumed to be proportional to the underlying physical variable, a reasonable assumption given that afferent responses are proportional to stimulus amplitude (Mountcastle et al. 1966). Second, stimuli were specified as deviations from the baseline indentation because afferent responses have been shown to be invariant with respect to baseline amplitude (Vega-Bermudez and Johnson 1999b).
The model described in the present study predicts afferent responses to static spatial patterns. The question remains whether the same model can make useful predictions about afferent responses to dynamic patterns. In a recent study (Bensmaia et al. 2005a), we measured the spatial modulation in afferent responses to static and vibrating gratings and found that, although the magnitude of the response varied with vibratory frequency, its spatial profile did not. The independence of spatial modulation from vibratory frequency suggests that the encoding of the spatial and temporal properties of the stimulus can be studied independently. The model may thus be able to account for how the spatial properties of a stimulus shape the afferent response, even though it lacks a dynamic component. We can assess the extent to which the mean rate model described in this study predicts the afferent response to a dynamic stimulus by computing model predictions of the responses to a dynamic stimulus approximated as a series of static stimuli. Figure 11 illustrates the response of an SA1 and an RA unit to a scanned bar and to a spatiotemporal random dot sequence, together with model predictions. The coarse structure of the response is captured well by the model: the afferent tends to produce an action potential whenever the predicted firing rate is high.
Fig. 11.
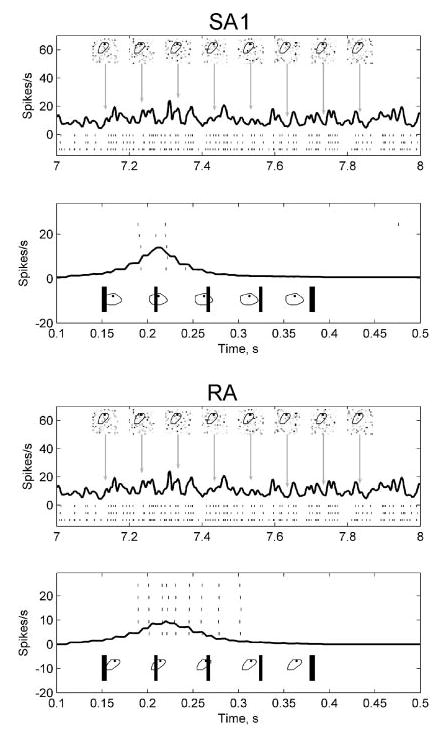
Prediction of responses to dynamic stimuli in an SA1 unit (p4b_03_00) and in an RA unit (p4b_06_03). In each plot, the top panel illustrates afferent fiber responses to random probe indentations. Tick marks indicate spike times evoked by the stimulus over 3 repetitions. Model predictions using maximum tensile strain are shown in black. The black outline in each stimulus frame indicates the neuron’s receptive field boundary, and the black dot is the afferent hotspot. The bottom panel in each plot illustrates the observed (ticks) and predicted (black) responses for a bar scanned from left to right across the fingerpad at a velocity of 40 mm/s. Sample stimulus frames are shown in both top and bottom. In the random probe indentation stimulus, each probe in the array indented the receptive field independently according to a Poisson process with rate of 5 indentations/s. Each probe indentation lasted ~30 ms.
The model in its present form cannot predict the highly repeatable timing of evoked action potentials (Freeman and Johnson 1982a,b; Johansson and Birznieks 2004; Talbot et al. 1968; Whitsel et al. 2000). To capture these properties of afferent responses, biophysical properties of the receptor/afferent complex, such as the mechanisms of action potential generation, absolute and relative refractoriness, must be incorporated into the model. Furthermore evidence suggests that the physical quantity transduced by the receptor undergoes temporal filtering: for instance, both afferents are sensitive to stimulus frequency and perhaps velocity (Freeman and Johnson 1982a; Johansson et al. 1982) and RA fibers exhibit a characteristic off-response when an indented stimulus is withdrawn. The dynamic response properties of mechanoreceptive afferents have traditionally been modeled independently of their spatial properties (Bensmaia 2002; Freeman and Johnson 1982a; Slavik and Bell 1995). Although much progress has been made in understanding afferent responses to sinusoidal vibrations, no general framework exists to understand their responses to complex dynamic stimuli. Once such a framework is developed, the spatial and temporal models may be combined to achieve a more complete quantitative understanding of the peripheral neural representation.
Acknowledgments
We thank P. Denchev for assistance with data collection and for helpful suggestions. J. Killebrew and F. Dammann provided invaluable technical support. We also thank R. Raghupathy and A. Andreou for discussions during the development of the model.
Present address of A. P. Sripati: Center for Neural Basis of Cognition, Carnegie Mellon University, Pittsburgh, PA 15232.
Footnotes
GRANTS
This work was supported by National Institute of Neurological Disorders and Stroke Grants NS-38034 and NS-18787.
References
- Bensmaia SJ. A transduction model of the Meissner corpuscle. Math Biosci. 2002;176:203–217. doi: 10.1016/s0025-5564(02)00089-5. [DOI] [PubMed] [Google Scholar]
- Bensmaia SJ, Craig JC, Yoshioka T, Johnson KO. SA1 and RA afferent responses to static and vibrating gratings. J Neurophysiol. 2006;95:1771–1782. doi: 10.1152/jn.00877.2005. [DOI] [PMC free article] [PubMed] [Google Scholar]
- Bensmaia SJ, Leung YY, Hsiao SS, Johnson KO. Vibratory adaptation of cutaneous mechanoreceptive afferents. J Neurophysiol. 2005;94:3023–3036. doi: 10.1152/jn.00002.2005. [DOI] [PMC free article] [PubMed] [Google Scholar]
- Dandekar K, Raju BI, Srinivasan MA. 3-D finite-element models of human and monkey fingertips to investigate the mechanics of tactile sense. J Biomech Eng. 2003;125:682– 691. doi: 10.1115/1.1613673. [DOI] [PubMed] [Google Scholar]
- Dandekar K, Srinivasan MA. A 3 dimensional finite element model of the monkey fingertip for predicting responses of slowly adapting mechanoreceptors. ASME Bioengin Conf BED. 1995;29:257–258. [Google Scholar]
- Dandekar K, Srinivasan MA. Role of Mechanics in Tactile Sensing of Shape. Cambridge, MA: MIT Press; 1997. [Google Scholar]
- Del Prete Z, Baker SP, Grigg P. Stretch responses of cutaneous RA afferent neurons in mouse hairy skin. J Neurophysiol. 2003;89:1649 –1659. doi: 10.1152/jn.00909.2002. [DOI] [PubMed] [Google Scholar]
- Diamond J, Gray JAB, Sato M. The site of initiation of impulses in Pacinian corpuscles. J Physiol. 1956;133:54 – 67. doi: 10.1113/jphysiol.1956.sp005566. [DOI] [PMC free article] [PubMed] [Google Scholar]
- DiCarlo JJ, Johnson KO, Hsiao SS. Structure of receptive fields in area 3b of primary somatosensory cortex in the alert monkey. J Neurosci. 1998;18:2626 –2645. doi: 10.1523/JNEUROSCI.18-07-02626.1998. [DOI] [PMC free article] [PubMed] [Google Scholar]
- Freeman AW, Johnson KO. A model accounting for effects of vibratory amplitude on responses of cutaneous mechanoreceptors in macaque monkey. J Physiol. 1982a;323:43– 64. doi: 10.1113/jphysiol.1982.sp014060. [DOI] [PMC free article] [PubMed] [Google Scholar]
- Freeman AW, Johnson KO. Cutaneous mechanoreceptors in macaque monkey: temporal discharge patterns evoked by vibration, and a receptor model. J Physiol. 1982b;323:21– 41. doi: 10.1113/jphysiol.1982.sp014059. [DOI] [PMC free article] [PubMed] [Google Scholar]
- Ge W, Khalsa PS. Encoding of compressive stress during indentation by slowly adapting type I mechanoreceptors in rat hairy skin. J Neurophysiol. 2002;87:1686 –1693. doi: 10.1152/jn.00414.2001. [DOI] [PubMed] [Google Scholar]
- Gray JAB, Malcolm JL. The initiation of nerve impulses by mesenteric Pacinian corpuscles. Proc R Soc Lond B Biol Sci. 1950;137:96 –114. doi: 10.1098/rspb.1950.0026. [DOI] [PubMed] [Google Scholar]
- Gray JAB, Matthews PBC. A comparison of the adaptation of the Pacinian corpuscle with accommodation of its own axon. J Physiol. 1951;114:454 – 464. doi: 10.1113/jphysiol.1951.sp004636. [DOI] [PMC free article] [PubMed] [Google Scholar]
- Grigg P. Biophysical studies of mechanoreceptors. J Appl Physiol. 1986;60:1107–1115. doi: 10.1152/jappl.1986.60.4.1107. [DOI] [PubMed] [Google Scholar]
- Hulliger M, Nordh E, Thelin AE, Vallbo ÅB. The responses of afferent fibers from the glabrous skin of the hand during voluntary finger movements in man. J Physiol. 1979;291:233–249. doi: 10.1113/jphysiol.1979.sp012809. [DOI] [PMC free article] [PubMed] [Google Scholar]
- Johansson RS, Birznieks I. First spikes in ensembles of human tactile afferents code complex spatial fingertip events. Nat Neurosci. 2004;7:170 –177. doi: 10.1038/nn1177. [DOI] [PubMed] [Google Scholar]
- Johansson RS, Landstrom U, Lundstrom R. Responses of mechanoreceptive afferent units in the glabrous skin of the human hand to sinusoidal skin displacements. Brain Res. 1982;244:17–25. doi: 10.1016/0006-8993(82)90899-x. [DOI] [PubMed] [Google Scholar]
- Johnson KO. The roles and functions of cutaneous mechanoreceptors. Curr Opin Neurobiol. 2001;11:455– 461. doi: 10.1016/s0959-4388(00)00234-8. [DOI] [PubMed] [Google Scholar]
- Khalsa PS, Hoffman AH, Grigg P. Mechanical states encoded by stretch-sensitive neurons in feline joint capsule. J Neurophysiol. 1996;76:175–187. doi: 10.1152/jn.1996.76.1.175. [DOI] [PubMed] [Google Scholar]
- Khalsa PS, LaMotte RH, Grigg P. Tensile and compressive responses of nociceptors in rat hairy skin. J Neurophysiol. 1997;78:492–505. doi: 10.1152/jn.1997.78.1.492. [DOI] [PubMed] [Google Scholar]
- Knibestöl M. Stimulus-response functions of rapidly adapting mechanoreceptors in the human glabrous skin area. J Physiol. 1973;232:427– 452. doi: 10.1113/jphysiol.1973.sp010279. [DOI] [PMC free article] [PubMed] [Google Scholar]
- Lanir Y. Skin mechanics. In: Skalak R, Chien S, editors. Handbook of Engineering. New York: McGraw Hill; 1987. [Google Scholar]
- Loewenstein WR, Cohen S., I After-effects of repetitive activity in a nerve ending. J Gen Physiol. 1959a;43:335–345. doi: 10.1085/jgp.43.2.335. [DOI] [PMC free article] [PubMed] [Google Scholar]
- Loewenstein WR, Cohen S., II Post-tetanic potentiation and depression of generator potential in a single non-myelinated nerve ending. J Gen Physiol. 1959b;43:347–376. doi: 10.1085/jgp.43.2.347. [DOI] [PMC free article] [PubMed] [Google Scholar]
- Loewenstein WR, Rathkamp R. The sites for mechano-electric conversion in a Pacinian corpuscle. J Gen Physiol. 1958;411:1245–1265. doi: 10.1085/jgp.41.6.1245. [DOI] [PMC free article] [PubMed] [Google Scholar]
- Loewenstein WR, Skalak R. Mechanical transmission in a Pacinian corpuscle. An analysis and a theory. J Physiol. 1966;182:346 –378. doi: 10.1113/jphysiol.1966.sp007827. [DOI] [PMC free article] [PubMed] [Google Scholar]
- Mountcastle VB, Talbot WH, Kornhuber HH. The neural transformation of mechanical stimuli delivered to the monkey’s hand. In: de Reuck AV, Knight J, editors. Touch, Heat, Pain and Itch. London: Churchill; 1966. pp. 325–351. [Google Scholar]
- Ogawa H. The Merkel cell as a possible mechanoreceptor cell. Prog Neurobiol. 1996;49:317–334. doi: 10.1016/0301-0082(96)00018-4. [DOI] [PubMed] [Google Scholar]
- Pare M, Smith AM, Rice FL. Distribution and terminal arborizations of cutaneous mechanoreceptors in the glabrous finger pads of the monkey. J Comp Neurol. 2002;445:347–359. doi: 10.1002/cne.10196. [DOI] [PubMed] [Google Scholar]
- Phillips JR, Johnson KO. Tactile spatial resolution. II. Neural representation of bars, edges, and gratings in monkey primary afferents. J Neurophysiol. 1981a;46:1192–1203. doi: 10.1152/jn.1981.46.6.1192. [DOI] [PubMed] [Google Scholar]
- Phillips JR, Johnson KO. Tactile spatial resolution. III. A continuum mechanics model of skin predicting mechanoreceptor responses to bars, edges, and gratings. J Neurophysiol. 1981b;46:1204 –1225. doi: 10.1152/jn.1981.46.6.1204. [DOI] [PubMed] [Google Scholar]
- Quilliam TA. The structure of finger print skin. In: Gordon G, editor. Active Touch. Oxford: Pergamon; 1978. pp. 1–18. [Google Scholar]
- Slavik P, Bell J. A mechanoreceptor model for rapidly and slowly adapting afferents subjected to periodic vibratory stimuli. Math Biosci. 1995;130:1–23. doi: 10.1016/0025-5564(94)00083-c. [DOI] [PubMed] [Google Scholar]
- Srinivasan MA. Surface deflection of primate fingertip under line load. J Biomech. 1989;22:343–349. doi: 10.1016/0021-9290(89)90048-1. [DOI] [PubMed] [Google Scholar]
- Srinivasan MA, Dandekar K. Role of fingertip geometry in the transmission of tactile mechanical signals. Adv Bioeng. 1992;22:569 –572. [Google Scholar]
- Srinivasan MA, Dandekar K. An investigation of the mechanics of tactile sense using two-dimensional models of the primate fingertip. J Biomech Eng. 1996;118:48 –55. doi: 10.1115/1.2795945. [DOI] [PubMed] [Google Scholar]
- Sukharev S, Corey DP. Mechanosensitive channels: multiplicity of families and gating paradigms. Sci STKE. 2004 doi: 10.1126/stke.2192004re4. \?\2004: re4. [DOI] [PubMed] [Google Scholar]
- Takahashi-Iwanaga H, Shimoda H. The three-dimensional microanatomy of Meissner corpuscles in monkey palmar skin. J Neurocytol. 2003;32:363–371. doi: 10.1023/B:NEUR.0000011330.57530.2f. [DOI] [PubMed] [Google Scholar]
- Talbot WH, Darian-Smith I, Kornhuber HH, Mountcastle VB. The sense of flutter-vibration: comparison of the human capacity with response patterns of mechanoreceptive afferents from the monkey hand. J Neurophysiol. 1968;31:301–334. doi: 10.1152/jn.1968.31.2.301. [DOI] [PubMed] [Google Scholar]
- Timoshenko S, Goodier JN. Theory of Elasticity. Tokyo: McGraw-Hill Kogakusha; 1970. [Google Scholar]
- Vega-Bermudez F, Johnson KO. SA1 and RA receptive fields, response variability, and population responses mapped with a probe array. J Neurophysiol. 1999a;81:2701–2710. doi: 10.1152/jn.1999.81.6.2701. [DOI] [PubMed] [Google Scholar]
- Vega-Bermudez F, Johnson KO. Surround suppression in the responses of primate SA1 and RA mechanoreceptive afferents mapped with a probe array. J Neurophysiol. 1999b;81:2711–2719. doi: 10.1152/jn.1999.81.6.2711. [DOI] [PubMed] [Google Scholar]
- Whitsel BL, Kelly EF, Delemos KA, Xu M, Quibrera PM. Stability of rapidly adapting afferent entrainment vs responsivity. Somatosens Mot Res. 2000;17:13–31. doi: 10.1080/08990220070265. [DOI] [PubMed] [Google Scholar]
- Wu JZ, Dong RG, Rakheja S, Schopper AW, Smutz WP. A structural fingertip model for simulating of the biomechanics of tactile sensation. Med Eng Phys. 2004;26:165–175. doi: 10.1016/j.medengphy.2003.09.004. [DOI] [PubMed] [Google Scholar]


