

Summary
When stimulated strongly, a hair cell's mechanically sensitive hair bundle may consume ATP too rapidly for replenishment by diffusion. To provide a broad view of the bundle's protein complement, including those participating in energy metabolism, we used shotgun mass spectrometry methods to identify proteins of purified chicken vestibular bundles. In addition to cytoskeletal proteins, proteins involved in Ca2+ regulation, and stress-response proteins, many of the most abundant bundle proteins that were identified by mass spectrometry were involved in ATP synthesis. After β -actin, the cytosolic brain isoform of creatine kinase was the second-most abundant bundle protein; at ~0.5 mM, creatine kinase is capable of maintaining high ATP levels despite 1 mM/s ATP consumption by the plasma-membrane Ca2+-ATPase. Consistent with this critical role in hair-bundle function, the creatine kinase circuit is essential for high-sensitivity hearing, as demonstrated by hearing loss in creatine kinase knockout mice.
Introduction
Hair cell mechanotransduction is direct; displacement of the mechanically sensitive hair bundle leads to immediate gating of cation-selective transduction channels. Although metabolic energy apparently is not required for mechanotransduction itself, ATP is essential for myosins that carry out adaptation of the transduction current (Gillespie and Cyr, 2004) and bundle assembly (Lin et al., 2005), treadmilling actin (Schneider et al., 2002), and phosphoinositide turnover (Hirono et al., 2004). Quantitatively, the most significant drain on ATP levels in the hair bundle is probably Ca2+ pumping by the plasma-membrane Ca2+-ATPase isoform 2 (PMCA2). Even with the low concentrations of Ca2+ that bathe the hair bundle, Ca2+ carries a substantial fraction of the transduction current (Lumpkin et al., 1997; Ricci and Fettiplace, 1998); moreover, bundle PMCA2 removes the majority of the entering Ca2+ (Lumpkin and Hudspeth, 1998), which can occur at a rate of >1 mM/s (Ricci and Fettiplace, 1998; Yamoah et al., 1998; seeSupplemental Text).
Hair bundles consist of dozens of stereocilia, typically 2–15 μm in length, each of which is packed with actin filaments. Stereocilia have no mitochondria and thus might rely on diffusion of ATP from mitochondria located at their bases. However, diffusion cannot deliver sufficient ATP to stereocilia tips to maintain Ca2+ pumping (see Discussion), suggesting that stereocilia use alternative methods for delivering ATP to PMCA2 and other ATPases.
Understanding how hair bundles maintain energy homeostasis has been hampered by our limited knowledge of proteins present in the bundle. Although several methods for bundle isolation have been developed (Neugebauer and Thurm, 1984; Tilney et al., 1989; Shepherd et al., 1989; Gillespie and Hudspeth, 1991), the scarcity of hair cells has prevented thorough cataloging of bundle proteins. Another approach, identification of "deafness genes," has successfully discovered proteins which are essential for and specific to the inner ear (Petit, 2006), yet this approach fails to identify proteins important for bundle function that play indispensable roles elsewhere.
Recent technical advances have made mass spectrometry into a practical tool for identification and quantification of hair-bundle proteins. Here we report the characterization of the proteins from hair bundles of the chicken utricle, a vestibular organ; we note that a large number of proteins consistently detected in the preparation are involved in energy metabolism. Not only are glycolytic enzymes abundant, but the cytosolic brain isoform of creatine kinase is present at high enough levels to be primarily responsible for ATP delivery to PMCA2 and other bundle ATPases. Consistent with that conclusion, mice lacking brain creatine kinase have vestibular dysfunction and reduced hearing sensitivity.
Results
Chicken hair bundle purification
We used a modification of the twist-off method (Gillespie and Hudspeth, 1991) to purify hair bundles from embryonic day 20 (E20) chicken utricles (Fig. 1A); at this age, utricles have >20,000 hair cells (Goodyear et al., 1999) and the vestibular system is functional (Jones and Jones, 1996). Purity of the bundle preparation was assessed by immunolabeling isolated bundles with tubulin antibodies (to detect cell bodies), tropomyosin antibodies (to detect cuticular plates), MitoTracker (to detect mitochondria), and DAPI (to detect nuclei). Kinocilia were isolated along with most hair bundles and were stained well with anti-tubulin; by contrast, little additional tubulin staining was seen (Fig 1B; see also Fig. 3A). Cuticular plates were rare; tropomyosin labeling was associated with about 1 in every 50 bundles (Fig. 1C). No MitoTracker or DAPI staining was detected, suggesting the absence of mitochondrial or nuclear contamination (data not shown). Although these experiments indicated that there was minimal contamination of the bundle preparation, we cannot exclude that some individual preparations may have had contaminating cell bodies, and hence a few nuclei or mitochondria. Because the somatic volume exceeds the bundle volume by more than 20-fold, a small number of co-purified cell bodies might skew the set of "bundle" proteins. Nevertheless, we are confident that our bundle isolations are sufficiently clean to achieve a high enrichment of bundle proteins. Indeed, the amount of PMCA2 immunoblot signal normalized to total protein increased 80-fold in bundles compared to whole utricles (data not shown), suggesting that substantial enrichment was achieved with the bundle isolation.
Figure 1. Chicken utricle hair-bundle isolation.
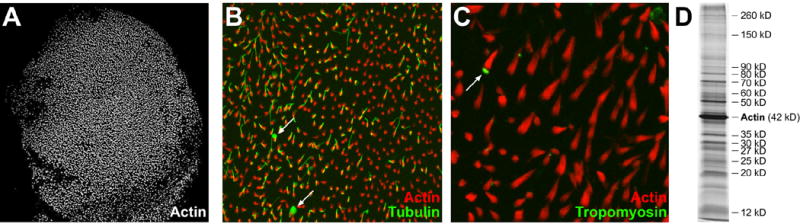
A: Purified hair bundles, embedded in agarose, stained with phalloidin to highlight actin. Panel is 1121 x 1121 μm.
B: Purified hair bundles stained with phalloidin (red) and anti-tubulin (green). Note presence of kinocilia in most bundles but only minimal soma tubulin contamination (arrow, example of soma tubulin). Panel is 192 x 192 μm.
C: Purified hair bundles stained with phalloidin (red) and anti-tropomyosin (green). Note the scarcity of cuticular plates (arrow, example of cuticular plate). Panel is 96 x 96 μm.
D: One-dimensional SDS-PAGE separation of purified hair bundle proteins; gel was silver-stained. Migration positions corresponding to actin and major bundle bands are indicated.
Figure 3. Detection and quantitation of hair-bundle creatine kinase B and GAPDH.

A: B-CK immunoreactivity in inner ear and brain. Loading: hair bundles from 15 chicken utricles; 0.1 EE of sensory epithelium (Epithelium); 0.1 EE of utricular residue after scraping off sensory epithelium, containing stroma and nerve (Residual); ~3 μg brain protein (Brain); and 30 ng purified B-CK. Probed with anti-B-CK (top); stripped and reprobed with anti-tubulin (bottom).
B: B-CK quantitation by immunoblotting. Two samples of bundles from 5 chicken utricles each (5e) and various amounts of purified actin or B-CK were detected with actin and B-CK antibodies. Blots were scanned and analyzed to calculate B-CK and actin in the bundles from a chicken utricle. Standard curves (below) were fit with second-order (actin) or third-order (B-CK) polynomials; signals corresponding to actin and B-CK bundle samples, coded in blue or green, are indicated with arrows.
C: B-CK:actin ratio in hair bundles from gel scanning. Hair bundles were separated by SDS-PAGE; gel was stained with Coomassie blue. Left, region corresponding to B-CK and actin is shown; the band labeled as B-CK co-migrates with authentic chicken B-CK. Right, plot of Coomassie signal with distance along molecular mass axis of gel (black). Data were fit with a sum of two Gaussian curves (red); the area corresponding to B-CK was 12% of that corresponding to actin.
D: GAPDH quantitation by immunoblotting. Purified chicken GAPDH, 4% of a whole chicken utricle, or bundles from 13 chicken utricles each were detected with anti-GAPDH. The utricle and bundle lanes have approximately the same amount of total protein loaded (210 ng); the stronger intensity of the bundle band indicated that GAPDH is substantially enriched in bundles over whole epithelium.
As in frog hair bundles (Gillespie and Hudspeth, 1991), a protein that co-migrated with actin (42 kD) was the predominant protein in purified bundles (Fig. 1D), accounting for 25–50% of the protein in the bundles. Another 15 or so proteins appeared reproducibly as major bands in the preparation (Fig. 1D).
Mass spectrometry identifies abundant hair-bundle proteins
Although hair-bundle proteins are scarce, mass spectrometry has sufficient sensitivity to detect many proteins of the bundle preparation. We used bundles from ~100 chicken utricles (1–2 μg of total bundle protein) for each of five complementary shotgun mass spectrometry experiments (Suppl. Table 1). In one approach, GeLC (Rezaul et al., 2005), we separated purified bundle proteins using one-dimensional SDS-PAGE, cut gel slices with a robot, and separately digested the 35–45 slices with trypsin. Each sample was subsequently analyzed with reverse-phase liquid chromatography-tandem mass spectrometry (LC-MS/MS). In other experiments, we directly digested agarose-embedded hair bundles with trypsin, then analyzed bundle peptides either directly with LC-MS/MS or with the MuDPIT method (Washburn et al., 2001), which introduces a cation-exchange step prior to LC-MS/MS.
Using the X! Tandem search algorithm accessed via the Global Protein Machine interface (Craig et al., 2004), we searched mass spectrometry data against the Ensembl database of predicted chicken proteins, derived from the chicken genome sequencing project (Hillier et al., 2004). Because assignment algorithms do not absolutely identify proteins, confidence in protein identification depends on the search stringency. We used two measures that indicate the confidence of each identification. The log of the expectation value, log(e), indicates the probability that the identification occurred by chance (Fenyo and Beavis, 2003); the spectral count is the number of MS/MS spectra that were matched to the protein, and is approximately proportional to the abundance of the protein in the sample (Liu et al., 2004; Old et al., 2005). A total of 59 proteins were identified from the chicken hair-bundle preparation using the following stringent selection criteria: log(e) score of <-20.0 in at least one experiment, spectral count of 3 or more in at least one experiment, and identification in a minimum of three of five mass spectrometry runs (Table 1). Although many other proteins were provisionally identified in our experiments (Suppl. Table 1; Supplemental Data), the stringency of our selection conditions gives us confidence that the proteins in Table 1 were correctly identified.
Table 1. Chicken utricle hair bundle proteins.
Proteins were listed if they were (a) identified in at least three of five experiments (see Suppl. Table 1), (b) had a log(e) of -20 or better in at least one experiment, and (c) had a total spectral count of 3 or more in at least one experiment. Key: Rank IF, rank order based on intensity factor (IF); Rank SCF, rank order based on spectral counting (spectral count factor; SCF); Identifier, Chicken Ensembl database reference identifiers; #, number of mass spectrometry experiments protein was identified in; Best log(e), lowest log(e) score for protein; Best count, largest spectral count for protein; MW (kDa), molecular mass in kDa; IF, intensity factor score; SCF, spectral count factor score; Name, descriptive name, with chicken gene name indicated in some cases.
| Rank, IF | Rank, SCF | Identifier | # | Best log(e) | Best count | MW (kDa) | IF | SCF | Name |
|---|---|---|---|---|---|---|---|---|---|
| 1 | 1 | ENSGALP00000002101 | 5 | −573.9 | 259 | 41.8 | 0.3373 | 0.2789 | Beta-actin (ACT5_CHICK) |
| 2 | 2 | ENSGALP00000018742 | 5 | −296.2 | 107 | 42.9 | 0.0651 | 0.0543 | Creatine kinase B (KCRB_CHICK) |
| 3 | 3 | ENSGALP00000023278 | 5 | −291.7 | 44 | 35.7 | 0.0406 | 0.0345 | Glyceraldehyde-3-phosphate dehydrogenase (G3P_CHICK) |
| 4 | 4 | ENSGALP00000005475 | 4 | −101.3 | 29 | 12.1 | 0.0297 | 0.0324 | Parvalbumin 3 (PRVU_CHICK) |
| 5 | 10 | ENSGALP00000016260 | 3 | −37.5 | 7 | 16.8 | 0.0152 | 0.0142 | Calmodulin (CaM) |
| 6 | 7 | ENSGALP00000010510 | 5 | −239.6 | 45 | 70.8 | 0.0145 | 0.0157 | Heat shock cognate 70 |
| 7 | 5 | ENSGALP00000013964 | 5 | −190.0 | 38 | 43.5 | 0.0139 | 0.0166 | Tubulin beta-2C (TUBB2C) |
| 8 | 8 | ENSGALP00000021618 | 5 | −66.1 | 25 | 36.3 | 0.0132 | 0.0157 | L-lactate dehydrogenase B (LDHB_CHICK) |
| 9 | 18 | ENSGALP00000017577 | 4 | −30.1 | 11 | 19.1 | 0.0129 | 0.0098 | Anterior gradient homolog (AG-3 protein) |
| 10 | 9 | ENSGALP00000026911 | 5 | −140.4 | 19 | 28.2 | 0.0125 | 0.0142 | Chloride intracellular channel protein 5 (CLIC5) |
| 11 | 14 | ENSGALP00000019165 | 4 | −37.6 | 6 | 12.2 | 0.0118 | 0.0118 | Histone H4 |
| 12 | 6 | ENSGALP00000023396 | 4 | −77.7 | 15 | 22.7 | 0.0114 | 0.0166 | Triosephosphate isomerase (TPIS_CHICK) |
| 13 | 11 | ENSGALP00000027650 | 5 | −162.5 | 36 | 68.4 | 0.0113 | 0.0133 | Radixin (RADI_CHICK) |
| 14 | 20 | ENSGALP00000019162 | 3 | −33.2 | 6 | 15.6 | 0.0102 | 0.0095 | Histone H2A |
| 15 | 13 | ENSGALP00000019365 | 5 | −111.0 | 15 | 37.5 | 0.0094 | 0.0120 | Annexin A5 |
| 16 | 15 | ENSGALP00000016978 | 4 | −202.6 | 31 | 50.8 | 0.0090 | 0.0109 | Tubulin alpha-1 (TBA1_CHICK) |
| 17 | 22 | ENSGALP00000011961 | 3 | −49.9 | 14 | 20.9 | 0.0090 | 0.0090 | Phosphatidylethanolamine-binding protein (PEBP) |
| 18 | 17 | ENSGALP00000003737 | 5 | −197.7 | 30 | 50.2 | 0.0086 | 0.0101 | Alpha-enolase (ENO1) |
| 19 | 19 | ENSGALP00000004164 | 5 | −166.4 | 27 | 70.9 | 0.0085 | 0.0097 | Fimbrin (FIMB_CHICK) |
| 20 | 16 | ENSGALP00000003012 | 4 | −101.5 | 18 | 35.6 | 0.0079 | 0.0102 | Malate dehydrogenase mitochondrial (MDH) |
| 21 | 21 | ENSGALP00000008988 | 5 | −121.2 | 19 | 39.0 | 0.0075 | 0.0093 | NHERF1 |
| 22 | 12 | ENSGALP00000012878 | 4 | −149.7 | 22 | 44.6 | 0.0072 | 0.0127 | Phosphoglycerate kinase (PGK_CHICK) |
| 23 | 24 | ENSGALP00000004703 | 4 | −20.3 | 7 | 19.3 | 0.0063 | 0.0068 | Ubiquitin (UBIQ_CHICK) |
| 24 | 26 | ENSGALP00000003665 | 3 | −20.4 | 4 | 12.7 | 0.0059 | 0.0059 | Calretinin (CALB2) |
| 25 | 25 | ENSGALP00000014374 | 5 | −62.6 | 10 | 36.5 | 0.0056 | 0.0064 | Malate dehydrogenase cytoplasmic |
| 26 | 29 | ENSGALP00000008647 | 3 | −21.5 | 10 | 20.7 | 0.0056 | 0.0056 | ADP-ribosylation factor 1 (ARF1) |
| 27 | 23 | ENSGALP00000004182 | 4 | −35.9 | 10 | 29.2 | 0.0054 | 0.0086 | 14-3-3 protein epsilon (14-3-3E) |
| 28 | 31 | ENSGALP00000001474 | 4 | −106.4 | 22 | 72.0 | 0.0054 | 0.0054 | GRP 78/BiP (GRP78_CHICK) |
| 29 | 28 | ENSGALP00000016523 | 4 | −83.4 | 33 | 83.4 | 0.0049 | 0.0057 | Heat shock protein HSP 90-beta (HS90B_CHICK) |
| 30 | 35 | ENSGALP00000016629 | 3 | −40.5 | 8 | 22.3 | 0.0047 | 0.0047 | Peroxiredoxin 1 |
| 31 | 27 | ENSGALP00000034108 | 4 | −117.7 | 18 | 58.0 | 0.0045 | 0.0058 | Pyruvate kinase muscle isozyme (KPYK_CHICK) |
| 32 | 30 | ENSGALP00000002695 | 5 | −111.9 | 13 | 60.6 | 0.0042 | 0.0054 | ATP synthase H+ transporting mitochondrial F1 alpha |
| 33 | 40 | ENSGALP00000018498 | 3 | −65.8 | 25 | 64.6 | 0.0039 | 0.0039 | Heat shock protein HSP 90-alpha (Q5ZIC0_CHICK) |
| 34 | 37 | ENSGALP00000017765 | 5 | −141.8 | 22 | 86.4 | 0.0038 | 0.0043 | EPLIN (epithelial protein lost in neoplasm) |
| 35 | 34 | ENSGALP00000017773 | 5 | −309.2 | 51 | 257.2 | 0.0036 | 0.0049 | Protein tyrosine phosphatase RQ (PTPRQ) |
| 36 | 42 | ENSGALP00000032508 | 3 | −33.4 | 7 | 27.7 | 0.0035 | 0.0035 | Glutathione transferase omega |
| 37 | 32 | ENSGALP00000025499 | 4 | −28.1 | 3 | 15.7 | 0.0034 | 0.0050 | Superoxide dismutase |
| 38 | 36 | ENSGALP00000018265 | 4 | −64.2 | 7 | 24.4 | 0.0034 | 0.0045 | 47 kDa heat shock protein (HSP47_CHICK) |
| 39 | 33 | ENSGALP00000010167 | 4 | −53.0 | 9 | 42.1 | 0.0033 | 0.0050 | L-lactate dehydrogenase A (LDHA_CHIC) |
| 40 | 39 | ENSGALP00000025573 | 4 | −258.7 | 34 | 147.5 | 0.0032 | 0.0042 | Myosin VI |
| 41 | 38 | ENSGALP00000013574 | 4 | −93.3 | 13 | 50.4 | 0.0032 | 0.0043 | Protein disulfide-isomerase A3 |
| 42 | 44 | ENSGALP00000020744 | 4 | −113.5 | 15 | 92.3 | 0.0024 | 0.0029 | GRP94 (endoplasmin) (ENPL_CHICK) |
| 43 | 43 | ENSGALP00000020268 | 5 | −61.3 | 13 | 73.3 | 0.0024 | 0.0031 | Protein disulfide isomerase family A member 4 |
| 44 | 45 | ENSGALP00000007934 | 3 | −98.5 | 12 | 62.1 | 0.0022 | 0.0022 | Glucose phosphate isomerase |
| 45 | 48 | ENSGALP00000007997 | 3 | −26.2 | 5 | 31.2 | 0.0020 | 0.0020 | Voltage-dependent anion-selective channel protein 2 (VDAC-2) |
| 46 | 41 | ENSGALP00000026461 | 3 | −22.0 | 4 | 28.7 | 0.0020 | 0.0037 | 14-3-3 protein theta (14-3-3T) |
| 47 | 47 | ENSGALP00000000304 | 4 | −95.3 | 13 | 73.4 | 0.0018 | 0.0022 | Dihydropyrimidinase-related protein 2 (DRP-2) |
| 48 | 46 | ENSGALP00000013267 | 4 | −63.1 | 9 | 49.5 | 0.0016 | 0.0022 | GDP dissociation inhibitor 2 |
| 49 | 51 | ENSGALP00000014371 | 3 | −44.6 | 8 | 95.1 | 0.0015 | 0.0015 | Novel Ensembl prediction |
| 50 | 52 | ENSGALP00000007703 | 3 | −145.0 | 16 | 137.1 | 0.0012 | 0.0014 | Plasma membrane Ca2+ ATPase 2 (ATP2B2) |
| 51 | 49 | ENSGALP00000011689 | 3 | −36.0 | 5 | 44.1 | 0.0012 | 0.0019 | Protein disulfide isomerase |
| 52 | 50 | ENSGALP00000009371 | 3 | −41.6 | 5 | 50.5 | 0.0011 | 0.0016 | Elongation factor 1-alpha 2 (EF-1-alpha-2) |
| 53 | 53 | ENSGALP00000003850 | 3 | −23.1 | 3 | 57.8 | 0.0010 | 0.0010 | T-complex protein 1 zeta-2 subunit |
| 54 | 54 | ENSGALP00000025506 | 3 | −21.6 | 3 | 64.5 | 0.0009 | 0.0009 | Malic enzyme 1 NADP(+)-dependent cytosolic |
| 55 | 55 | ENSGALP00000017926 | 3 | −26.7 | 6 | 62.4 | 0.0009 | 0.0009 | Phosphoglucomutase 1 |
| 56 | 56 | ENSGALP00000018987 | 3 | −25.4 | 4 | 61.0 | 0.0009 | 0.0009 | T-complex protein 1 alpha subunit (TCP-1-alpha) |
| 57 | 57 | ENSGALP00000011233 | 3 | −36.7 | 5 | 86.8 | 0.0008 | 0.0008 | 6-phosphofructokinase type C |
| 58 | 58 | ENSGALP00000002625 | 3 | −37.5 | 3 | 56.8 | 0.0006 | 0.0006 | Vacuolar H-ATPase B subunit osteoclast isozyme |
| 59 | 59 | ENSGALP00000008236 | 3 | −102.2 | 13 | 192.2 | 0.0004 | 0.0006 | Clathrin heavy chain |
We used two methods for obtaining an estimate of the amount of each protein in the preparation. In the first, we summed the raw ion-current intensities of all matched peaks in MS/MS spectra for a given protein, summed the intensities for each data set, then determined the relative intensity contribution of each protein, which we assumed to be proportional to protein mass (Powell et al., 2004; Prochasson et al., 2005). To compare approximate molar abundance, we normalized the data by dividing by molecular masses; we termed the resulting index an intensity factor (IF; Table 1). Because ion-current intensities vary depending both on mass spectrometer settings and on properties of each peptide, including recovery, capacity for ionization, and fragmentation properties (Ong and Mann, 2005), this quantitation method will be more accurate for proteins identified with large numbers of independent peptides, true for the majority of the proteins in Table 1.
The ion-current intensity quantitation values were corroborated by quantitation using spectral counting, where the abundance of a protein in the original sample is considered to be proportional to the number of MS/MS spectra collected. Again, the ratio of spectral counts for a given protein relative to total spectral counts was adjusted for each protein molecular mass, yielding a spectral count factor (SCF; Table 2). Although quantitation with the two methods agreed well (Table 1; rank order correlation coefficient of 0.98), both measures should be considered to be only approximations of protein abundance.
Classification of abundant hair-bundle proteins
Our mass spectrometry results allowed us to identify what are likely the most abundant hair-bundle proteins. As expected, cytoskeletal proteins dominated; the protein with the largest intensity and spectral-count factors was β-actin (Table 1). In addition, other cytoskeletal proteins known to be present in bundles (fimbrin, radixin, tubulin) were also prominent. On the basis of its apparent abundance and colocalization with radixin, we have argued that CLIC5 (chloride intracellular "channel" 5) is also a cytoskeletal protein (Gagnon et al., 2006). NHERF1 (Na+-H+ exchanger regulatory factor 1), a widely expressed scaffolding protein that also interacts with radixin (Shenolikar et al., 2004), was also present. Another cytoskeletal protein consistently detected was EPLIN (epithelial lost in neoplasm), which has been shown to crosslink actin filaments and prevent filament branching (Maul et al., 2003). Finally, we detected two T-complex polypeptides, which are specialized chaperones for tubulin (Lopez-Fanarraga et al., 2001) and actin (Liang and MacRae, 1997).
Proteins involved in sequestration and removal of Ca2+ were also readily identified, including the mobile Ca2+ buffers parvalbumin 3 (Heller et al., 2002), calmodulin (Walker et al., 1993), and calretinin (Edmonds et al., 2000), as well as PMCA2 (Dumont et al., 2001). At least one other transmembrane protein, PTPRQ (Goodyear et al., 2003), was detected, as were two peripheral membrane proteins, annexin A5 and phosphatidylethanolamine-binding protein. Two mitochondrial membrane proteins, ATP synthase α subunit and voltage-dependent anion-selective channel protein 2, were detected, suggesting a small amount of mitochondrial contamination of the bundle preparation. Several proteins involved in stress responses were noted, including heat shock cognate 70 (Hsc70), which has been detected in hair cells previously (Neely et al., 1991).
Several less-abundant proteins expressed from "deafness genes" (e.g., myosin-7a, cadherin 23, espin, harmonin, and very large G-protein coupled receptor 1) were detected in one or more mass spectrometry runs, but did not meet the stringent criteria used for Table 1 (data not shown). More sensitive or exhaustive mass spectrometry experiments should permit more consistent detection of these scarce proteins.
Finally, a striking result was the abundance of proteins involved in energy metabolism, including the cytosolic brain isoform of creatine kinase (creatine kinase B or B-CK; Fig. 2A); the glycolytic enzymes glyceraldehyde-3-phosphate dehydrogenase (GAPDH), triosephosphate isomerase (TIM), enolase, and pyruvate kinase; and lactate dehydrogenase. By molar abundance, energy metabolism proteins account for ~14% of the bundle, second only to cytoskeletal proteins (Fig. 2B). Most proteins involved in glycolysis, particularly those necessary for ATP production, were reproducibly detected (Supplemental Data).
Figure 2. Hair-bundle mass spectrometry and validation.
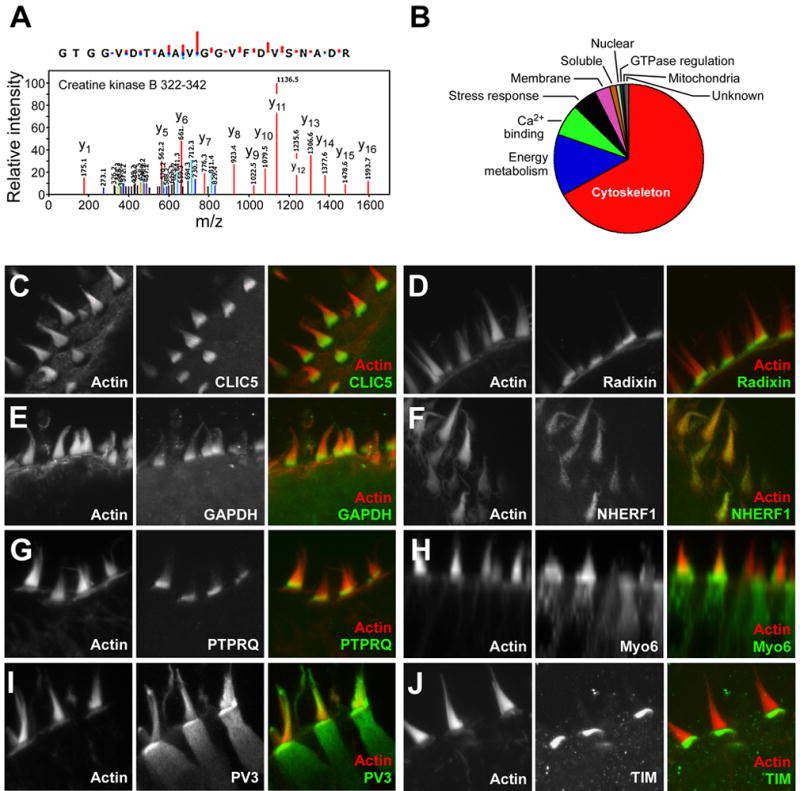
A: Identification of creatine kinase B tryptic peptide (residues 322–342). Graphical display of monoisotopic ion peak lists generated by Mascot Distiller from tandem mass spectrometry data. Value indicated next to peak is mass-to-charge (m/z) value. Positions of y-ions (red) are indicated. Coloring coding also indicates b-ions (blue) deamidated y-ions (orange), deamidated b-ions (green), deoxidated b-ions (light blue), and unmatched ions (black). This peptide was identified as many as 7 times in a single MuDPIT experiment.
B: Distribution of bundle proteins by approximate molar amount (from intensity factor).
C-J: Validation of identifications by immunocytochemistry. For each antibody, actin counterstain is on the left, antibody labeling in the middle, and the merge (red, actin; green, antibody) is on the right. All panels are 32 x 32 μm.
Validation of mass spectrometry identification
Because some proteins identified in the hair-bundle preparation might be from contaminating fractions, we used immunocytochemistry to validate many of the more significant identifications. Several proteins were clearly enriched in hair bundles, including CLIC5, radixin, GAPDH, NHERF, and PTPRQ (Fig. 2C-G). CLIC5, radixin, GAPDH, and PTPRQ each localized to the base of the hair bundle, although it is not clear that their patterns overlap precisely. By contrast, NHERF1 was distributed throughout the stereocilia. Others, like myosin VI and parvalbumin 3 (Fig. 2H-I), were present both in bundles and somas; both were distributed in bundles relatively uniformly, although parvalbumin 3 apparently also concentrated in cuticular plates. Localization of these antigens in P4-P8 rat utricles was similar to that in chicken (data not shown). In a few cases, we identified proteins present in the bundle preparation that were clearly concentrated in other cellular locations, including TIM, which was located in the cuticular plate (Fig. 2J), and ATP synthase, which was concentrated in the apical end of the hair-cell soma (data not shown).
Protein quantitation in hair bundles
Because both ion-current intensity and spectral counting quantitation methods indicated that B-CK was the second-most abundant hair-bundle protein after actin, we corroborated this result using quantitative immunoblotting. B-CK was readily detected in immunoblots of chicken utricle (Fig. 3A) and bullfrog sacculus (data not shown) hair-bundle proteins. Using purified chicken brain B-CK (Hornemann et al., 2000) as a standard, we found that bundles of one E20 chicken utricle contained 2.0 ± 0.4 ng of B-CK (n=4; Fig. 3B). Separate quantitation of actin indicated it was present at 16 ± 3 ng per utricle (n=4). Because we did not adjust these values for recovery of bundles with the twist-off method (20–50%), the actual amounts of actin and B-CK per ear equivalent are approximately two-fold greater. Using a fluorescence assay for total protein, we found that bundles of one chicken utricle, not adjusted for recovery, contained 16 ± 4 ng total protein; a whole utricle contained 5.3 ± 0.4 μg. Although these results suggested that actin made up 100% of the bundle protein, inefficiencies in protein extraction for the total-protein assay probably led to the apparent discrepancy.
These quantitative immunoblotting results indicated that actin is about 8-fold more abundant in hair bundles than B-CK. In an alternative method of determining this ratio, we scanned a Coomassie-stained gel of hair-bundle proteins in the region corresponding to B-CK and actin (Fig. 3C). Assuming that both proteins bind similar amounts of dye, integration indicated that the peak corresponding to actin was 8.2-fold more intense that corresponding to B-CK. These values are close to the 5-fold difference determined by mass spectrometry, suggesting that ion-current intensity and spectral counting measures are reasonably accurate for abundant bundle proteins. To estimate the concentration of B-CK in bundles, we considered that actin is approximately 4 mM in frog saccule bundles (Jacobs and Hudspeth, 1990; Gillespie and Hudspeth, 1991); if actin is at a similar concentration in chicken bundles, then the B-CK concentration is ~0.5 mM.
Quantitative immunoblotting indicated that the bundles of each ear (not adjusted for recovery) contained 1.6 ± 0.4 ng GAPDH (n=3; Fig. 3d). This value indicates that GAPDH is present at ~1/8th the molar concentration of actin, almost identical to the estimate from mass spectrometry; this ratio corresponds to a GAPDH concentration of 0.4 mM in bundles. At 102 ± 22 ng per μg of total protein, GAPDH is 5-fold more abundant in bundles than in whole utricle (18 ± 2 ng GAPDH/μg).
Localization of creatine kinase B in the inner ear
In the chicken utricle, B-CK immunolabeling was concentrated in hair cells, in both stereocilia and kinocilia (Fig. 4A-C). Immunolabeling of stereocilia and hair-cell somas, but not kinocilia, was blocked by coincubation of the primary antibody with purified B-CK, demonstrating that stereocilia labeling is specific but at least some of the kinocilium labeling is nonspecific (Fig. 4D-E). Unexpectedly, B-CK was present at much lower levels in chicken basilar papilla (data not shown). B-CK was also expressed at high levels in bullfrog saccular hair cells, although levels varied from cell to cell (Fig. 4F-I). Robust detection in vestibular organs required an antigen unmasking step (Shi et al., 2001); we suspect that the need for unmasking could arise from localization of B-CK in the actin-filament cores of stereocilia.
Figure 4. Localization of creatine kinase B in hair bundles.
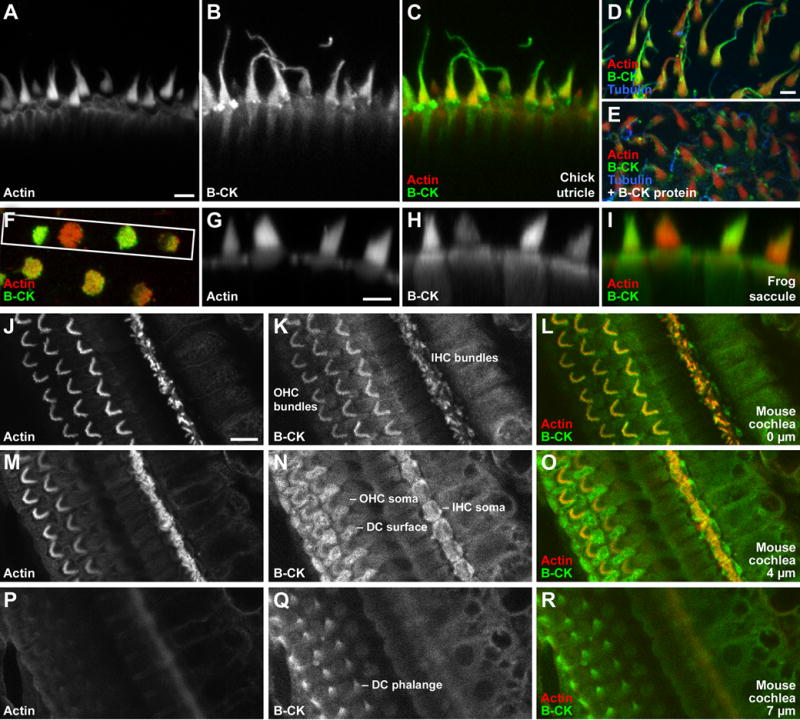
A-R Immunolabeling with rabbit anti-chicken B-CK antibody (Kaldis et al., 1996).
A-C: Creatine kinase B localization in chicken utricle hair bundles. Antigen unmasking used. Projection of 7 confocal sections, each 1 μm apart.
D-E: Antibody specificity control with chick utricle. Antigen unmasking used. Excess purified B-CK protein blocks anti-B-CK labeling in stereocilia; block in kinocilium is incomplete, however.
F-I: Creatine kinase B localization in frog saccule hair cells. F, single x-y plane from a z-stack of saccular epithelium. Region used for x-z reslice is indicated by white box. G-I, reslice from z-series of F, showing cross-sections through hair cells.
J-R: Creatine kinase B localization in mouse cochlea. Antigen unmasking used. IHC, inner hair cell; OHC, outer hair cell; DC, Deiters' cell. Optical sections at three indicated depths reveal labeling in hair bundles, somas of inner hair cells, and Deiters' cells.
Scale bars: Bar in A (5 μm) also applies to B-C; bar in D (5 μm) also applies to E; bar in G (5 μm) also applies to H-I; bar in J (10 μm) also applies to K-R.
B-CK was also present in hair bundles of mouse inner and outer hair cells (Fig. 4J-L;Supplemental Material). In addition, as previously reported (Spicer and Schulte, 1992), we detected strong B-CK immunoreactivity in Deiters' cells, particularly in their phalanges and apical surfaces (Fig. 4M-R; Supplemental Data).
Functional role of creatine kinase B in hair bundles
If creatine kinase maintains ATP levels in hair bundles, inhibition of the enzyme should permit bundle ATPases to reduce the concentration of ATP. We measured ATP levels in isolated bullfrog saccular hair cells, incubated in saline containing 100 μM CaCl2. Under control conditions, we detected ~1 fmol ATP per cell. Inhibition of creatine kinase with 10 μM dinitrofluorobenzene (DNFB; Infante and Davies, 1965) decreased ATP levels by about 30% (Fig. 5B). Inhibition of hair-cell PMCA with 20 μM carboxyeosin (Gatto and Milanick, 1993) increased ATP levels several-fold, suggesting that Ca2+ pumping was a major energy load on isolated hair cells (Fig. 5B).
Figure 5. Creatine kinase inhibition increases ATP hydrolysis and slows adaptation in hair bundles.

A: Creatine kinase and PMCA are major sources of ATP synthesis and hydrolysis, respectively, in hair bundles. ATP consumption can be monitored indirectly with Mg Green; because the affinity of Mg2+ for ADP is much less than for ATP, hydrolysis of ATP will increase free Mg2+ levels. Rephosphorylation of ADP by creatine kinase will keep free Mg2+ levels low; inhibition of creatine kinase (by DFNB) should elevate Mg2+, increasing Mg Green fluorescence.
B: ATP levels in isolated bullfrog hair cells after treatment with DNFB or carboxyeosin. ATP in ~7 cells was measured with luciferin/luciferase assay. These experiments are representative of three independent experiments.
C: Average rate of increase (initial slope) of Mg Green fluorescence from first six points (12 min) of each cell, individually fit with single-exponential functions (n=19). The difference between bundles and somas is significant (**, p<0.02).
D: Transduction currents before (left) and after (middle) 30 min treatment with 100 μM DNFB; right traces show transduction currents after 500 μM Ap5A was added to the apical solution as well
E: Transduction currents before (left) and after (right) 30 min treatment with 5 mM 2DOG; 5 mM pyruvate was included in apical and basal solutions.
F: Transduction currents before (left) and after (right) 30 min treatment with 100 μM DNFB and 5 mM 2DOG; 5 mM pyruvate was included in apical and basal solutions.
G: Fast adaptation rate constants before (control; n=32) and 30 min post-perfusion with control salines (n=10); 100 μM apical and basal DNFB (n=10); 100 μM DNFB apical and basal followed by 500 μM apical Ap5A (n=3); 5 mM 2-deoxygluycose and 5 mM pyruvate in glucose-free salines (n=5); 100 μM DNFB, 5 mM 2-deoxygluycose, and 5 mM pyruvate in glucose-free salines (n=7). Significance (two-tailed Student's t-test) indicated by: *, p<0.05; **, p<0.02. Significance for the Control-DNFB comparison was p=0.056.
H: Slow adaptation rate constants; same epithelia as (G). Significance for the Control-DNFB comparison was p=0.091.
To determine whether the effect of DNFB was specific to hair-bundle creatine kinase, we used the dye Magnesium Green (Mg Green) to indirectly measure ATP levels (Leyssens et al., 1996). Because Mg2+ binds ~10-fold tighter to ATP than to ADP, hydrolysis of ATP releases Mg2+, which can be detected as increased dye fluorescence (Fig. 5A). In isolated bullfrog hair cells loaded with the acetoxymethylester form of Mg Green, inhibition of creatine kinase by DNFB caused a significant rise in fluorescence in hair bundles, with an initial rate of fluorescence increase (1.3% min−1) that was more than six-fold greater than the increase in somas (Fig. 5C; Supplemental Data).
We used the bullfrog-sacculus transepithelial microphonic preparation (Corey and Hudspeth, 1983) to measure the rate of adaptation of the mechanotransduction current, which should indirectly report ATP levels. As adaptation depends on myosins (Stauffer et al., 2005), depletion of ATP should slow adaptation once ATP levels fall in the range of myosin's Km for ATP, ~0.2 mM (Gillespie and Cyr, 2004; Supplemental Data). Although Ca2+ pumping also depends on the concentration of ATP, with a Km of <1 μM (Carafoli, 1992), PMCA2 will be more resistant to ATP depletion. Our stimuli were relatively large (0.4–1.7 μm) and slow (10–90% risetime of 4 ms); although we detected fast and slow components of adaptation (8 ± 1 ms and 49 ± 3 ms, respectively), both probably arose from myosin slipping down actin filaments under tension (Supplemental Data).
After a 30 min DNFB perfusion, rate constants for fast and slow components of adaptation were reduced by ~40% compared to a control perfusion (Fig. 5D, G-H), although the effects were not statistically significant (p=0.054 and 0.091, respectively). Additional application of the adenylate kinase inhibitor Ap5A decreased fast and slow components yet further (Fig. 5D, G-H), however, suggesting that this enzyme helps to maintain ATP levels by scavenging ADP (Gillespie and Hudspeth, 1993). The glycolysis inhibitor 2-deoxyglucose (2DOG), when applied along with pyruvate (to supply energy for oxidative phosphorylation), did not slow adaptation; however, the combination of DNFB and 2DOG reduced adaptation rates substantially and significantly (Fig. 5E-H). The rest Po rose substantially when DNFB was paired with either Ap5A or 2DOG, consistent with elevated ADP levels (Gillespie and Hudspeth, 1993).
The creatine kinase circuit is required for normal hearing and balance
PMCA2 is essential for hearing (Kozel et al., 1998; Street et al., 1998), and efficient PMCA2 activity may be necessary for cochlear amplification (LeMasurier and Gillespie, 2005). If outer hair cell B-CK is needed to supply PMCA2 with sufficient ATP, then B-CK’s absence should adversely affect the ability of the cochlea to detect faint sounds. We measured the auditory brainstem response (ABR), a measure of the sensitivity of the auditory system, in mice deficient in B-CK (B-CK−/−) (Jost et al., 2002). In addition, because overexpression from the ubiquitous mitochondrial creatine kinase isoform (UMi-CK) apparently can compensate for B-CK in knockout mice, we used double-knockout mice lacking B-CK and UMi-CK (CK=/=) (Streijger et al., 2005). At the light microscopic level, no differences in cochlear morphology were noticed between wild-type mice and CK=/= double-knockout mice at ages of 6, 15 and 30 days (data not shown). Demonstrating the specificity of the mouse cochlea immunolocalization (Fig. 4J-R), labeling by the B-CK antibody was essentially eliminated in B-CK−/−and CK=/= mice (Suppl. Fig. 1; Supplemental Data).
Although ABRs to broad band click stimuli, which largely contain low-frequency components, were not significantly different between the three groups, the sensitivity of the auditory system to the 8 kHz and 16 kHz tone bursts was reduced substantially in CK=/= mice compared to wild-type mice and B-CK−/− mice (Fig. 6A-B). Thresholds were elevated by 20–30 dB, which indicates that the sound pressure required to reach a detectable signal in the brainstem was 10- to 30-fold greater. B-CK−/− mice showed thresholds elevated similarly to those of CK=/= mice for the 32 kHz tone-burst stimulus; both were significantly different from wild-type mice (p <0.01).
Figure 6. Auditory brainstem responses and vestibular behavior in creatine kinase knockout mice.
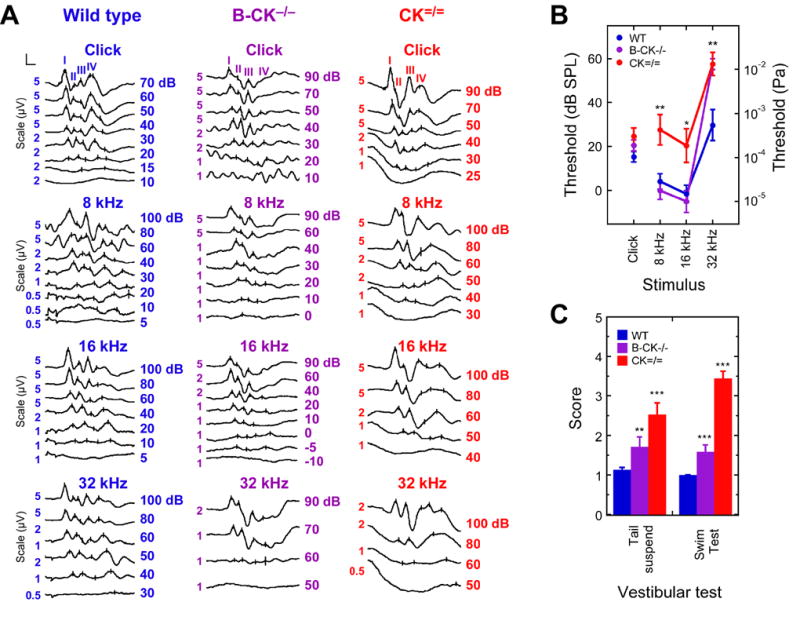
A: Typical ABRs evoked with a click stimulus (top) and with tone bursts of 8, 16 and 32 kHz (bottom) for WT, B-CK−/−, and CK=/= mice. ABRs are shown at different descending stimulus intensity levels in dB SPL. Reproducible ABRs at lower stimulation intensities in response to 32 kHz tone-bursts stimuli were not elicited from B-CK−/− and CK=/= mice; CK=/= mice also showed higher thresholds in response to 8 kHz and 16 kHz tone-burst stimuli. The vertical axis scale was adjusted for readibility at higher stimulation levels; scale bar in upper left signifies 1.5 ms and the appropriate vertical scale (indicated to left of each trace).
B: Mean auditory brainstem thresholds. CK=/= mice showed significantly elevated hearing thresholds compared to B-CK−/− and WT mice for 8 and 16 kHz (ANOVA, **p <0.01 and *p <0.05, respectively). For the 32 kHz tone burst, both B-CK−/− and CK=/= mice showed significantly elevated auditory thresholds compared to WT (ANOVA, **p < 0.01). Significance in (B) and (C) is indicated by: *, p<0.05; **, p <0.01; and ***, p<0.001.
C: Vestibular dysfunction in creatine kinase deficient mice. Applying the tail suspension and swim tests, each with scores ranging from 1 (normal vestibular function) to 5 (severe vestibular dysfunction), indicated normal vestibular function for WT mice (n=30). B-CK−/− single knockout mice (n=17) showed a mild vestibular dysfunction; dysfunction in CK=/= double knockout mice (n=17) was more severe.
Although neither B-CK−/− nor CK=/= mice showed overt circling behavior (Jost et al., 2002; Streijger et al., 2005), an indication of severe vestibular dysfunction, we observed more subtle signs of a malfunctioning vestibular system in both groups by using tail-suspension and swim tests. When compared to WT animals, which were all characterized by normal vestibular function, B-CK−/− mice showed a mild defect, whereas CK=/= double knockout mice had a more substantial vestibular dysfunction (Fig. 6C).
Discussion
Hair bundles are optimized for maintenance of ATP levels via phosphocreatine buffering. The high concentration of B-CK in bundles suggests that if phosphocreatine levels are sufficiently high, bundles can maintain millimolar ATP levels even as PMCA2 or other ATPases consume prodigious amounts of ATP. Thus processes that rely on ATP, such as fast and slow adaptation (Stauffer et al., 2005), can continue to operate efficiently; although mechanotransduction does not rely directly on ATP levels, optimal sensitivity does.
Hair-bundle proteins
We identified 59 proteins that, by stringent criteria, are present in our hair-bundle preparation. Many of these proteins are not specifically concentrated in bundles; hair bundles are not closed compartments, so they will contain proteins that can diffuse from the soma. Proteins that are not exclusively located in bundles can nevertheless be essential for bundle function; for example, creatine kinase B is also located in cell bodies (Fig. 4). Other proteins are enriched in bundles; for example, we did not detect fimbrin, radixin, CLIC5, or annexin A5 in mass spectrometry experiments using whole chicken epithelium, despite their abundance in mass spectrometry experiments using isolated bundles (data not shown).
The list of proteins identified in the hair-bundle preparation includes a few that are present at high levels in fractions that contaminate the purified bundles, such as the mitochondrial ATP synthase and histones H2a and H4, present in nuclei. Other proteins, such as the heat-shock proteins Hsc70 and GRP78, are at high concentrations in cell somas, although a modest amount of each may be soluble in bundles. Nevertheless, our ongoing validation experiments indicate that most proteins in the Table 1 are authentic bundle proteins.
Have we missed any abundant hair-bundle proteins because of an incomplete database? The majority of the genes in the chicken Ensembl database are predicted by automated gene-build analysis (Curwen et al., 2004), which relies on cross-referencing with the deeply annotated human and mouse databases. When we searched our ion-peak lists against human and mouse databases, very few additional proteins are identified, none of which meet the criteria used for Table 1 (data not shown). We thus believe that we have identified the majority of the abundant hair-bundle proteins, although we do not suggest that our list is complete; membrane proteins in particular are likely to be underrepresented.
Glycolysis in hair bundles
Components of the glycolytic pathway from glyceraldehyde-3-phosphate dehydrogenase onward were all present in hair bundles. (The one exception, phosphoglycerate mutase, was present in 2/5 mass spectrometry experiments and thus did not qualify for inclusion in Table 1.) Triosephosphate isomerase was also present in the bundle preparation but probably derived from contaminating cuticular plates; its localization there would ensure that any diffusing dihydroxyacetone phosphate would be converted to glyceraldehyde-3-phosphate prior to entering stereocilia. Moreover, lactate dehydrogenase was present at high levels; because this enzyme converts NADH to NAD+, it would regenerate NAD+ consumed by glyceraldehyde-3-phosphate dehydrogenase. Lactate presumably then diffuses to hair-cell (or supporting-cell) mitochondria for use in oxidative phosphorylation.
That glycolytic enzymes are present in stereocilia is not surprising; many of these enzymes bind specifically to actin (Arnold et al., 1971; Bronstein and Knull, 1981; Mejean et al., 1989). Because the concentration of stereocilia actin is so high compared to the cell soma, these glycolytic enzymes should be concentrated in bundles. Interestingly, GAPDH can associate with membranes (Hsu and Molday, 1990) as well as with actin (Bronstein and Knull, 1981), suggesting that GAPDH might be a membrane-to-cytoskeleton crosslinker in stereocilia.
If the relevant mass-spectrometry identifications are valid, our results suggest that hair-bundle glycolysis proceeds via glyceraldehyde-3-phosphate reduction and subsequent steps, rather than relying on glucose transport from the endolymph into bundles. This arrangement allows the bundle to generate a net of four ATP molecules per glucose, rather than only two if hexokinase and phosphofructokinase steps are required. Those two ATPs are still consumed by the cell, but distant from the bundle. In rod outer segments and red blood cells, glycolysis can generate ATP at 0.1 mM/s (Hsu and Molday, 1994). The stereocilia Ca2+ entry rate, and hence ATP consumption rate, can be estimated from the transduction channel open probability (Po), single channel conductance, membrane potential, and fraction of the current carried by Ca2+ (Fig. 7 legend). If Po is 0.1 and 100% of entering Ca2+ is extruded by PMCA2, stereocilia will consume ATP at 0.12 mM/s ATP. Because GAPDH, rate limiting for the second half of glycolysis, has a bundle concentration similar to that in rod outer segments (Hsu and Molday, 1990), glycolysis could be sufficient for ATP generation by quiescent bundles. Also indicating the significance of glycolysis for bundles, adaptation is slowed much more substantially when creatine kinase inhibition is coupled with inhibition of glycolysis (Fig. 5).
Figure 7. Modeling spatial buffering of ATP by creatine kinase and phosphocreatine.
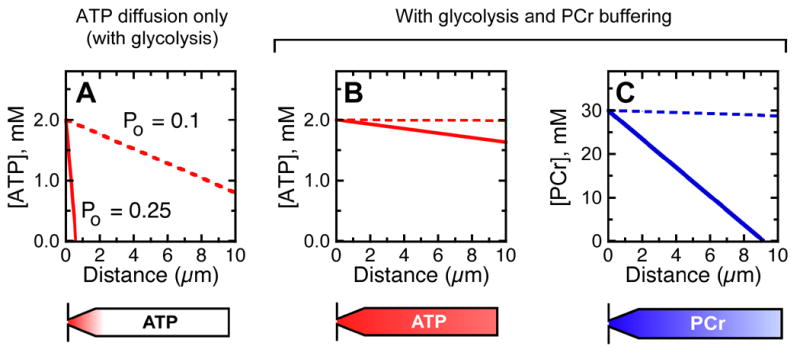
A: [ATP] spatial profile in absence of PCr buffering. One-dimensional source-sink model used as described in text. Parameters used: [ATP] at base fixed at 2 mM, -60 mV membrane potential, single-channel conductance of 100 pS; 3% of current carried by Ca2+, channel Po of 0.1 (dashed lines) or 0.25 (solid lines), 100% of Ca2+ pumped out by bundle PMCA (117 μM/s), glycolysis rate of 110 μM/s, diffusion coefficient for ATP in cytoplasm of 3.5 × 10⁻¹⁰ m2 s−1 (Bowen and Martin, 1964; Yoshizaki et al., 1987), and stereocilia radius of 200 nm. Diagram of stereocilium below indicates depletion of ATP (red); narrowing of stereocilium at base was not considered in modeling.
B: Effect on [ATP] of adding PCr buffering. Parameters: same as A with [PCr] at base fixed at 30 mM, ATP/ADP ratio of 25, K' (equilibrium constant for creatine kinase reaction) of 100, and diffusion constant for PCr of 4.9 × 10⁻¹⁰ m2 s−1. ATP levels remain nearly constant, even with elevated Po.
C: [PCr] gradient. JPCr/JATP ratio was 91. When Po is elevated, PCr levels fall towards stereocilium tip but remain in the millimolar range.
Hair bundles cannot rely on ATP diffusion
Although glycolysis might provide sufficient ATP for stereocilia with channels at their rest Po, stereocilia with transduction channels at an increased Po may need >1 mM/s ATP. Can diffusion supply enough ATP to make up the difference? Modeling the stereocilium as a one-dimensional diffusion space, the concentration of ATP should fall linearly between its source and its sink, the site of consumption. To simplify the calculations, we assume that [ATP] at the base of a stereocilium is fixed at 2 mM by the mitochondria clustered nearby, and that all ATP is consumed by PMCA2 at stereocilia tips, near the site of Ca2+ entry. Fick's law gives:
| (1) |
where Q is the ATP diffusion rate, D is the diffusion coefficient of ATP in cytoplasm, and a is the cross-sectional area of the stereocilium. Because the central assumption in this model is that ATP diffusion is sufficient for extrusion, Q = R, where R is the ATP consumption rate. We approximate the effect of glycolysis by subtracting the estimated glycolysis rate (g) from R. The concentration at distance x from the source is thus:
| (2) |
Although this equation suggests that glycolysis could provide enough ATP at a resting Po of 0.1, elevating Po to 0.25 causes the ATP concentration to drop below zero in less than 1 μm (Fig. 7A). This unreasonable result shows that the central assumption of the model cannot be correct.
Creatine kinase controls ATP levels in hair bundles
Because isolated frog hair cells are 1–2 pl in volume (Edmonds et al., 2000) and contain 1–2 fmol of ATP, their resting ATP concentration was ~1 mM. This concentration may have been artificially low as these cells may be loaded with Na+ (Shi et al., 2005), increasing ATP consumption by the Na+/K+-ATPase. Inhibition of creatine kinase by DNFB decreased ATP levels, which suggests that substantial amounts of ATP must be delivered in hair cells by phosphocreatine and creatine kinase. Because inhibition of PMCA increased ATP levels, a calcium pump must continuously consume large amounts of ATP. We therefore conclude that the creatine kinase is essential for maintaining ATP levels in hair cells, and that PMCA is a major drain on ATP. Moreover, the spatially restricted Mg Green fluorescence increase seen in hair bundles in response to DNFB suggests that ATP consumption by bundle PMCA2 drives bundle creatine kinase activity.
Slowing of adaptation by DNFB, particularly when coupled with adenylate kinase or glycolysis inhibition, supports a critical role for creatine kinase in hair bundles. Although the effect of DNFB alone on adaptation was not profound, the concentration of ATP might have been reduced by ten-fold or more without dramatically slowing myosins, depending on myosin's Km for ATP and the resting ATP level (Supplemental Data). Moreover, the degree to which DNFB reduces ATP will depend on the amount of creatine kinase present in bundles. For example, 100 μM DNFB reduces creatine kinase activity in muscle by ~75% without reducing the ATP consumption rate substantially (Dzeja et al., 1996); likewise, an excess of creatine kinase in hair bundles would blunt the effects of DNFB. The effects of DNFB were enhanced by adenylate kinase inhibition, suggesting that this enzyme normally removes ADP that otherwise inhibits adaptation (Gillespie and Hudspeth, 1993); likewise, glycolysis inhibition synergizes with DNFB, consistent with a role for glycolysis in basal ATP maintenance.
As it ranked second in the hair-bundle preparation by spectral counting and ion-current intensities, we confirmed with quantitative immunoblotting that B-CK was highly abundant in chicken utricle hair bundles. At 0.5 mM and with a maximal activity of 250 s−1 (Hornemann et al., 2000), B-CK could regenerate ATP at >200 mM s−1 if ADP and phosphocreatine levels were well above their Km values (0.2 and 2 mM, respectively; Hornemann et al., 2000). Although the actual rate will be lower as ADP levels should be maintained well below 0.2 mM, hair bundles have a sufficiently high concentration of B-CK to allow the reaction to be near equilibrium, even during high ATP consumption or DNFB inhibition.
The high concentration of B-CK allows for spatial buffering of ATP by facilitated diffusion. As ATP is consumed in stereocilia, creatine kinase uses phosphocreatine to immediately restore ATP levels; the required flux of ATP into stereocilia thus can be replaced nearly entirely by phosphocreatine flux. Assuming that the creatine kinase reaction is at equilibrium, Meyer et al. (1984) showed that the ratio of phosphocreatine flux (JPCr) to ATP flux (JATP) into a compartment is:
| (3) |
where DCr(t) is the diffusion coefficient for creatine and phosphocreatine (assumed to be identical), DAd(t) is the diffusion coefficient for ADP and ATP, CCr(t) is total creatine+phosphocreatine concentration, CAd(t) is the ADP+ATP concentration, R is the ATP-to-ADP concentration ratio, and K' is the apparent equilibrium constant. If the concentration of ATP in the cell body is 2 mM, phosphocreatine is 30 mM, R = 25, and K' = 100 (Meyer et al., 1984), the flux ratio would be ~90; over 98% of the high-energy phosphate bonds would thus enter stereocilia as phosphocreatine, not ATP (Fig. 7B-C). Although phosphocreatine will also be depleted from stereocilia, if the soma concentration is sufficiently high, phosphocreatine will remain high enough to maintain fast creatine kinase activity.
Phosphocreatine will be regenerated either by creatine kinase associated with glycolytic enzymes (Kraft et al., 2000) or through mitochondrial creatine kinase utilization of ATP formed by oxidative phosphorylation (Kay et al., 2000). Phosphocreatine would be synthesized in the apical region of the hair cell, rich in mitochondria, and diffuse to stereocilia; creatine would diffuse back. Strong evidence for similar compartmentalized phosphocreatine-creatine circuits comes from sperm cells (Tombes and Shapiro, 1985) and retinal photoreceptors (Hemmer et al., 1993), although the rate of ATP consumption in stereocilia appears to be substantially larger.
Although our modeling is simplistic, we believe that it captures the essential role for creatine kinase in hair bundles, i.e., to temporally and spatially buffer ATP. Although a more realistic reaction-diffusion model, including Ca2+ buffering, Ca2+ extrusion along the stereocilia, kinetic constants for the Ca2+ pump and creatine kinase, and the effects of the stereocilia taper, would improve quantitative predictions, it would be very unlikely to substantially alter our principal qualitative conclusions.
Creatine kinase B in hearing and balance
Creatine kinase is necessary for normal hearing and balance. CK=/= mice have vestibular dysfunction and significantly elevated ABR thresholds in the middle and upper regions of the auditory range of mice (8–32 kHz). Mice lacking only B-CK show a deterioration of the auditory threshold only at 32 kHz, suggesting that compensation by UMi-CK can protect hearing throughout most of the auditory range. Consistent with creatine kinase’s importance in the cochlea, phosphocreatine concentrations rise fourfold from apex to base in the guinea pig organ of Corti (Krzanowski and Matschinsky, 1971). The elevation of ABR threshold at high frequencies is similar to results seen with mice with only one functional copy of PMCA2 (McCullough and Tempel, 2004). Several cell types in the ear besides hair cells might rely on creatine kinase; in particular, B-CK levels are high in phalanges of Deiters' cells. Because these mitochondria-free phalanges are tens of micrometers in length, even a small amount of ATP must be generated locally (Supplemental Data); the concentration of B-CK may not be proportional to its importance for cochlear function. The ABR results are thus consistent with an essential role for B-CK in hair cells and, in particular, hair bundles.
In conjunction with the results for CK=/= mice, the high concentration of PMCA2 in hair bundles (Dumont et al., 2001), the necessity of PMCA2 for hearing (Kozel et al., 1998; Street et al., 1998), and the calculated need for facilitated diffusion of ATP (Fig. 7), we propose that hair-bundle B-CK is responsible for maintaining bundle ATP levels despite high PMCA2 activity. In muscle, the efficiency of the sarcoplasmic reticulum Ca2+ pump depends critically on the local ATP/ADP ratio, which is maintained at a high level by pump-coupled creatine kinase (Rossi et al., 1990); accordingly, mice with a double knock-out of muscle-type and sarcomeric mitochondrial creatine kinase genes show substantially altered calcium homeostasis and compromised muscle relaxation (Steeghs et al., 1997). We thus propose that hair cells elevate B-CK to manage the energetically demanding task of Ca2+ homeostasis.
Experimental Procedures
Hair-bundle isolation
Bundle isolation from E20 utricles of White Leghorn chicken (Gallus domesticus) embryos was carried out as described previously (Gillespie and Hudspeth, 1991) with modifications for chicken (Supplemental Data). While the White Leghorn strain is different from the Red Jungle Fowl strain (Gallus gallus) used for genome sequencing, DNA from the two strains differs in sequence by only ~1% (http://www.ensembl.org/Gallus_gallus/index.html). Because mass spectrometry peptide identification tolerates small numbers of amino-acid differences (specified when setting the search parameters), this level of sequence difference should have had little effect on protein identification. Moreover, amino-acid sequences differences between proteins of the two strains will likely be much less than the 1% difference seen at the DNA level. Measurement of total protein and quantitative immunoblotting was performed as described in Supplemental Data.
Mass spectrometry via LC-MS/MS and MuDPIT
Agarose plugs containing hair bundles were dried in a vacuum centrifuge. The agarose was rehydrated with 10 mM DTT, minced, and incubated at 35°C for 30 min. Iodoacetamide was added to 15 mM and the samples incubated in the dark for 30 min. The samples were dried, then trypsin (20 ng/ml; Sequencing Grade Modified Trypsin, Promega) was added to reswell the agarose; the sample was sonicated during rehydration. The sample was then adjusted to 10% acetonitrile and digested overnight at 37°C. Peptides were extracted via two additions of 80 μl of 1% formic acid, each followed by sonication. Acidified peptides were desalted on a StageTip (Proxeon), dried, and resuspended in 1% formic acid containing 2.5 mM ammonium acetate.
Tryptic peptides from digests were analyzed by nano-LC-MS/MS. Chromatography was achieved using an Eksigent nanoLC to generate a gradient using the following chromatographic conditions; mobile phase A; water, acetonitrile, formic acid, trifluoroacetic acid (95, 4.89, 0.1, 0.01, v/v/v/v) mobile phase B; acetonitrile, isopropanol, water, formic acid, trifluoroacetic acid (80, 10, 9.89, 0.1, 0.01, v/v/v/v/v). Mobile phase B was ramped from 2% to 45% over 40 minutes, increased to 80% in 5 minutes and held for five minutes before being returned to starting conditions. Flow was regulated at 200 nl/min and directed through a 75 μm x 15 cm column packed in-house with Astrosil (5 μm particle size, 100 Å pore size, C18 reverse phase chemistry; Stellar Phases) coupled to a 5 μm tapered emitter (New Objectives). Prior to analytical chromatography, 5 μl of tryptic digest was injected onto a 150 μm x 2 cm sample trap packed with Poros R10; the trap was washed with mobile phase A to remove salts and contaminants, then was switched in-line with the analytical column. Tandem mass spectrometry data was collected using a QSTAR XL hybrid time-of-flight mass spectrometer (Applied Biosystems) under the following conditions; spray voltage 1800–1900V; TOF-MS scan m/z 400–1600, 0.5 sec; TOF-MS/MS scan m/z 50–2000, 2.0 sec, 9 sec exclusion; data dependent product ion acquisition of the three most abundant +2 and +3 ions from the TOF-MS scan.
For MudPIT, the instrumentation described above was used with the following changes. A 5 cm, lab-packed SCX column was prepared for ion-exchange chromatography (Polysulfoethyl A, 5 μm particle size, 300 Å) as instructed by the manufacturer. Analytical columns of 75 and 50 μm diameter were used at flow rates of 200 or 100 nl/min, respectively. Tryptic peptides from a hair bundle digest were injected onto the SCX column and the breakthrough was analyzed as the first fraction. Additional pools of peptides were displaced from the ion exchange column via ammonium acetate injections (5, 10, 15, 20, 25, 30, 35, 40, 45, 50, 75, 100, 150, and 300 mM); each eluate was separately run on nano-LC-MS/MS as described above.
Mass spectrometry via GeLC
Hair-bundle proteins were resolved by 1D SDS-PAGE; individual lanes of Sypro Orange stained-gels were cut into ~45 individual slices using a 2DiDx sample preparation robot (Leap Technologies). Individual gel slices were placed in a ZipPlate (Millipore), which was used as a filter to facilitate tryptic digestion. Gel slices were destained in two changes of 100 mM ammonium bicarbonate in 30% methanol, dried with neat acetonitrile, reduced with 10 mM DTT, and alkylated with 50 mM iodoacetamide. After washing and drying, approximately 100 ng of sequencing grade trypsin in 20 mM ammonium bicarbonate was added to each sample along with sufficient buffer to completely immerse the gel slices in buffer. Digestion proceeded overnight at 37°C. After acidifying samples with 10 μl of 1% formic acid, the peptide extract was collected by centrifugation; the gel slices were further extracted with two additions each of 50% and 70% acetonitrile. Peptide extracts were brought to near dryness before being resuspended in 10 μl of 0.1% formic acid in preparation for nano-LC-MS/MS.
Protein identification
Monoisotopic masses for database searching were generated using Distiller (Matrix Science) and submitted to X! Tandem for protein identification. Masses were searched against the Ensembl database (Ensembl Gallus gallus WASHUC 1, v 37.1) with the following parameters: fixed modification, cysteine carbamidomethylation; variable modification, methionine oxidation; one missed cleavage allowed; digest agent, trypsin; refinement modifications, methionine oxidation and N/Q deamidation, as well as one point mutation allowed; no removal of redundant spectra; precursor and fragment ion mass tolerances of 100 ppm and 0.2 Da respectively.
We generated Table 2 as follows. Protein isoforms identified with the same set of peptides were inspected manually to determine the most abundant isoform; this step applied to actin, creatine kinase, tubulin, and enolase. Because of contamination by human skin keratin, we manually deleted all intermediate filament identifications. Likewise, hemoglobin identifications were removed, as they resulted from red blood cell contamination (data not shown). We wrote a Mathematica 5.0 program to automatically select proteins that fit the criteria we used for Table 1.
Immunocytochemistry
Auditory and vestibular organs from chicken embryos (E20) were dissected in chicken saline and processed for immunocytochemistry (Supplemental Data). The antibodies for GAPDH, CLIC5, NHERF and B-CK required an unmasking procedure to expose the antigenic sites. Organs were fixed as usual in formaldehyde, then boiled in a citrate-based antigen unmasking solution (Vector Laboratories, Burlingame CA) for 5–10 min in a microwave. Organs were then washed in PBS and blocked in blocking solution as usual. The unmasking procedure inhibits phalloidin binding, presumably by disrupting F-actin structure; in experiments requiring antigen unmasking, actin counterstaining was achieved using a monoclonal anti-β-actin antibody (AC-15, Sigma; 1:400). AC-15 only detected stereocilia actin after unmasking.
ATP determination
Bullfrog hair cells were isolated in low-calcium saline (110 mM NaCl, 2 mM KCl, 2 mM MgCl2, 0.1 mM CaCl2, 3 mM D-glucose, 10 mM HEPES, pH 7.25) as described previously (Hirono et al., 2004). Total ATP was quantified using the Enliten luciferin/luciferase kit (Promega) using methods described in Supplemental Data.
Magnesium Green fluorescence
Bullfrog hair cells were isolated as described above; 3 μM Magnesium Green AM dye (Invitrogen Molecular Probes) was included in the dissociation solution. After hair cells had settled, the solution was replaced by standard saline (low-calcium saline with 4 mM CaCl2) containing 6.66 μM Magnesium Green AM. After 20 min of dye loading time, cells were washed with standard saline and allowed to de-esterify for an additional 20 min. Cells were viewed with a Plan Apochromat 60x (1.40 NA) oil lens on a Nikon TE 300 inverted microscope with a Bio-Rad MRC 1024 confocal imaging system. For inhibition of creatine kinase, a 10 mM stock solution of DNFB was diluted to a final concentration of 10 μM in the experimental chamber. Before adding DNFB, the basal Magnesium Green fluorescence was monitored for at least 6 min in order to ensure a relatively stable baseline. Image analysis was performed using ImageJ software; data were fitted to single-exponential functions. The error bars represent standard errors.
Analysis of creatine kinase knockout mice
To obtain heterozygous B-CK+/− UMi-CK+/− mice, B-CK−/− single knockout mice (Jost et al., 2002) and UMi-CK−/− single knockout mice (both 25% 129/Ola and 75% C57BL/6) were interbred. Breeding between heterozygous pairs generated heterozygous siblings, homozygous siblings with wild-type CK alleles (B-CK+/+ UMi-CK+/+), and homozygous double-knockout siblings (B-CK−/−UMi-CK−/−). Homozygous siblings were interbred to generate two separate lines with the same genetic background: (1) wild-type mice, and (2) mice lacking both CK isoforms (CK=/= double knockout mice; Streijger et al., 2005). Histological analysis, ABR measurements, and vestibular tests were carried out as described in Supplemental Data.
Mechanotransduction and adaptation
Mechanotransduction currents were measured from bullfrog sacculi with a two-compartment transepithelial voltage-clamp apparatus (Corey and Hudspeth, 1983), as described in Supplemental Data.
Supplementary Material
Acknowledgments
All genotype-specific mice mentioned were generated by the laboratory of Bé Wieringa (NCMLS, Radboud University Nijmegen Medical Centre, The Netherlands). We thank Bill Roberts (University of Oregon) for help with the diffusion calculations. Bé Wieringa and members of the Gillespie laboratory provided valuable comments on the manuscript. Supported by a Postdoctoral Research Fellowship from the German Research Foundation (to J.B.S), NIH grants R21 DC006097, R01 DC002368, and P30 DC005983 (to P.G.G.), and Swiss National Science Foundation grant 3100AO-102075 (to T.W.).
Footnotes
Publisher's Disclaimer: This is a PDF file of an unedited manuscript that has been accepted for publication. As a service to our customers we are providing this early version of the manuscript. The manuscript will undergo copyediting, typesetting, and review of the resulting proof before it is published in its final citable form. Please note that during the production process errors may be discovered which could affect the content, and all legal disclaimers that apply to the journal pertain.
References
- Arnold H, Henning R, Pette D. Quantitative comparison of the binding of various glycolytic enzymes to F-actin and the interaction of aldolase with G-actin. Eur J Biochem. 1971;22:121–126. doi: 10.1111/j.1432-1033.1971.tb01522.x. [DOI] [PubMed] [Google Scholar]
- Bowen WJ, Martin HL. The diffusion of adenosine triphsophate through aqueous solutions. Arch Biochem Biophys. 1964;107:30–36. doi: 10.1016/0003-9861(64)90265-6. [DOI] [PubMed] [Google Scholar]
- Bronstein WW, Knull HR. Interaction of muscle glycolytic enzymes with thin filament proteins. Can J Biochem. 1981;59:494–499. doi: 10.1139/o81-069. [DOI] [PubMed] [Google Scholar]
- Carafoli E. The Ca2+ pump of the plasma membrane. J Biol Chem. 1992;267:2115–2118. [PubMed] [Google Scholar]
- Corey DP, Hudspeth AJ. Analysis of the microphonic potential of the bullfrog's sacculus. J Neurosci. 1983;3:942–961. doi: 10.1523/JNEUROSCI.03-05-00942.1983. [DOI] [PMC free article] [PubMed] [Google Scholar]
- Craig R, Cortens JP, Beavis RC. Open source system for analyzing, validating, and storing protein identification data. J Proteome Res. 2004;3:1234–1242. doi: 10.1021/pr049882h. [DOI] [PubMed] [Google Scholar]
- Curwen V, Eyras E, Andrews TD, Clarke L, Mongin E, Searle SM, Clamp M. The Ensembl automatic gene annotation system. Genome Res. 2004;14:942–950. doi: 10.1101/gr.1858004. [DOI] [PMC free article] [PubMed] [Google Scholar]
- Dumont RA, Lins U, Filoteo AG, Penniston JT, Kachar B, Gillespie PG. Plasma membrane Ca2+-ATPase isoform 2a is the PMCA of hair bundles. J Neurosci. 2001;21:5066–5078. doi: 10.1523/JNEUROSCI.21-14-05066.2001. [DOI] [PMC free article] [PubMed] [Google Scholar]
- Dzeja PP, Zeleznikar RJ, Goldberg ND. Suppression of creatine kinase-catalyzed phosphotransfer results in increased phosphoryl transfer by adenylate kinase in intact skeletal muscle. J Biol Chem. 1996;271:12847–12851. doi: 10.1074/jbc.271.22.12847. [DOI] [PubMed] [Google Scholar]
- Edmonds B, Reyes R, Schwaller B, Roberts WM. Calretinin modifies presynaptic calcium signaling in frog saccular hair cells. Nat Neurosci. 2000;3:786–790. doi: 10.1038/77687. [DOI] [PubMed] [Google Scholar]
- Fenyo D, Beavis RC. A method for assessing the statistical significance of mass spectrometry-based protein identifications using general scoring schemes. Anal Chem. 2003;75:768–774. doi: 10.1021/ac0258709. [DOI] [PubMed] [Google Scholar]
- Gagnon LH, Longo-Guess CM, Berryman M, Shin JB, Saylor KW, Yu H, Gillespie PG, Johnson KR. The chloride intracellular channel protein CLIC5 is expressed at high levels in hair cell stereocilia and is essential for normal inner ear function. J Neurosci. 2006;26:10188–10198. doi: 10.1523/JNEUROSCI.2166-06.2006. [DOI] [PMC free article] [PubMed] [Google Scholar]
- Gatto C, Milanick MA. Inhibition of the red blood cell calcium pump by eosin and other fluorescein analogues. Am J Physiol. 1993;264:C1577–86. doi: 10.1152/ajpcell.1993.264.6.C1577. [DOI] [PubMed] [Google Scholar]
- Gillespie PG, Hudspeth AJ. High-purity isolation of bullfrog hair bundles and subcellular and topological localization of constituent proteins. J Cell Biol. 1991;112:625–640. doi: 10.1083/jcb.112.4.625. [DOI] [PMC free article] [PubMed] [Google Scholar]
- Gillespie PG, Hudspeth AJ. Adenine nucleoside diphosphates block adaptation of mechanoelectrical transduction in hair cells. Proc Natl Acad Sci USA. 1993;90:2710–2714. doi: 10.1073/pnas.90.7.2710. [DOI] [PMC free article] [PubMed] [Google Scholar]
- Gillespie PG, Cyr JL. Myosin-1c, the hair cell's adaptation motor. Annu Rev Physiol. 2004;66:521–545. doi: 10.1146/annurev.physiol.66.032102.112842. [DOI] [PubMed] [Google Scholar]
- Goodyear RJ, Gates R, Lukashkin AN, Richardson GP. Hair-cell numbers continue to increase in the utricular macula of the early posthatch chick. J Neurocytol. 1999;28:851–861. doi: 10.1023/a:1007070121751. [DOI] [PubMed] [Google Scholar]
- Goodyear RJ, Legan PK, Wright MB, Marcotti W, Oganesian A, Coats SA, Booth CJ, Kros CJ, Seifert RA, Bowen-Pope DF, Richardson GP. A receptor-like inositol lipid phosphatase is required for the maturation of developing cochlear hair bundles. J Neurosci. 2003;23:9208–9219. doi: 10.1523/JNEUROSCI.23-27-09208.2003. [DOI] [PMC free article] [PubMed] [Google Scholar]
- Heller S, Bell AM, Denis CS, Choe Y, Hudspeth AJ. Parvalbumin 3 is an abundant Ca2+ buffer in hair cells. J Assoc Res Otolaryngol. 2002;3:488–498. doi: 10.1007/s10162-002-2050-x. [DOI] [PMC free article] [PubMed] [Google Scholar]
- Hemmer W, Riesinger I, Wallimann T, Eppenberger HM, Quest AF. Brain-type creatine kinase in photoreceptor cell outer segments: role of a phosphocreatine circuit in outer segment energy metabolism and phototransduction. J Cell Sci. 1993;106:671–683. doi: 10.1242/jcs.106.2.671. [DOI] [PubMed] [Google Scholar]
- Hillier, et al. Sequence and comparative analysis of the chicken genome provide unique perspectives on vertebrate evolution. Nature. 2004;432:695–716. doi: 10.1038/nature03154. [DOI] [PubMed] [Google Scholar]
- Hirono M, Denis CS, Richardson GP, Gillespie PG. Hair cells require phosphatidylinositol 4,5-bisphosphate for mechanical transduction and adaptation. Neuron. 2004;44:309–320. doi: 10.1016/j.neuron.2004.09.020. [DOI] [PubMed] [Google Scholar]
- Hornemann T, Rutishauser D, Wallimann T. Why is creatine kinase a dimer? Evidence for cooperativity between the two subunits. Biochim Biophys Acta. 2000;1480:365–373. doi: 10.1016/s0167-4838(00)00098-4. [DOI] [PubMed] [Google Scholar]
- Hsu SC, Molday RS. Glyceraldehyde-3-phosphate dehydrogenase is a major protein associated with the plasma membrane of retinal photoreceptor outer segments. J Biol Chem. 1990;265:13308–13313. [PubMed] [Google Scholar]
- Hsu SC, Molday RS. Glucose metabolism in photoreceptor outer segments. Its role in phototransduction and in NADPH-requiring reactions. J Biol Chem. 1994;269:17954–17959. [PubMed] [Google Scholar]
- Infante AA, Davies RE. The effect of 2,4-dinitrofluorobenzene on the activity of striated muscle. J Biol Chem. 1965;240:3996–4001. [PubMed] [Google Scholar]
- Jacobs RA, Hudspeth AJ. Ultrastructural correlates of mechanoelectrical transduction in hair cells of the bullfrog's internal ear. Cold Spring Harb Symp Quant Biol. 1990;55:547–561. doi: 10.1101/sqb.1990.055.01.053. [DOI] [PubMed] [Google Scholar]
- Jones SM, Jones TA. Short latency vestibular evoked potentials in the chicken embryo. J Vestib Res. 1996;6:71–83. [PubMed] [Google Scholar]
- Jost CR, Van der Zee CEEM, In 't Zandt HJ, Oerlemans F, Verheij M, Streijger F, Fransen J, Heerschap A, Cools AR, Wieringa B. Creatine kinase B-driven energy transfer in the brain is important for habituation and spatial learning behaviour, mossy fibre field size and determination of seizure susceptibility. Eur J Neurosci. 2002;15:1692–1706. doi: 10.1046/j.1460-9568.2002.02001.x. [DOI] [PubMed] [Google Scholar]
- Kaldis P, Stolz M, Wyss M, Zanolla E, Rothen-Rutishauser B, Vorherr T, Wallimann T. Identification of two distinctly localized mitochondrial creatine kinase isoenzymes in spermatozoa. J Cell Sci. 1996;109:2079–2088. doi: 10.1242/jcs.109.8.2079. [DOI] [PubMed] [Google Scholar]
- Kay L, Nicolay K, Wieringa B, Saks V, Wallimann T. Direct evidence for the control of mitochondrial respiration by mitochondrial creatine kinase in oxidative muscle cells in situ. J Biol Chem. 2000;275:6937–6944. doi: 10.1074/jbc.275.10.6937. [DOI] [PubMed] [Google Scholar]
- Kozel PJ, Friedman RA, Erway LC, Yamoah EN, Liu LH, Riddle T, Duffy JJ, Doetschman T, Miller ML, Cardell EL, Shull GE. Balance and hearing deficits in mice with a null mutation in the gene encoding plasma membrane Ca2+-ATPase isoform 2. J Biol Chem. 1998;273:18693–18696. doi: 10.1074/jbc.273.30.18693. [DOI] [PubMed] [Google Scholar]
- Kraft T, Hornemann T, Stolz M, Nier V, Wallimann T. Coupling of creatine kinase to glycolytic enzymes at the sarcomeric I-band of skeletal muscle: a biochemical study in situ. J Muscle Res Cell Motil. 2000;21:691–703. doi: 10.1023/a:1005623002979. [DOI] [PubMed] [Google Scholar]
- Krzanowski JJJ, Matschinsky FM. A phosphocreatine gradient opposite to that of glycogen in the organ of Corti and the effect of salicylate on adenosine triphosphate and P-creatine in cochlear structures. J Histochem Cytochem. 1971;19:321–323. doi: 10.1177/19.5.321. [DOI] [PubMed] [Google Scholar]
- LeMasurier M, Gillespie PG. Hair-cell mechanotransduction and cochlear amplification. Neuron. 2005;48:403–415. doi: 10.1016/j.neuron.2005.10.017. [DOI] [PubMed] [Google Scholar]
- Leyssens A, Nowicky AV, Patterson L, Crompton M, Duchen MR. The relationship between mitochondrial state, ATP hydrolysis, [Mg2+]i and [Ca2+]ii studied in isolated rat cardiomyocytes. J Physiol. 1996;496:111–128. doi: 10.1113/jphysiol.1996.sp021669. [DOI] [PMC free article] [PubMed] [Google Scholar]
- Liang P, MacRae TH. Molecular chaperones and the cytoskeleton. J Cell Sci. 1997;110:1431–1440. doi: 10.1242/jcs.110.13.1431. [DOI] [PubMed] [Google Scholar]
- Lin HW, Schneider ME, Kachar B. When size matters: the dynamic regulation of stereocilia lengths. Curr Opin Cell Biol. 2005;17:55–61. doi: 10.1016/j.ceb.2004.12.005. [DOI] [PubMed] [Google Scholar]
- Liu H, Sadygov RG, Yates JRr. A model for random sampling and estimation of relative protein abundance in shotgun proteomics. Anal Chem. 2004;76:4193–4201. doi: 10.1021/ac0498563. [DOI] [PubMed] [Google Scholar]
- Lopez-Fanarraga M, Avila J, Guasch A, Coll M, Zabala JC. Review: postchaperonin tubulin folding cofactors and their role in microtubule dynamics. J Struct Biol. 2001;135:219–229. doi: 10.1006/jsbi.2001.4386. [DOI] [PubMed] [Google Scholar]
- Lumpkin EA, Hudspeth AJ. Regulation of free Ca2+ concentration in hair-cell stereocilia. J Neurosci. 1998;18:6300–6318. doi: 10.1523/JNEUROSCI.18-16-06300.1998. [DOI] [PMC free article] [PubMed] [Google Scholar]
- Lumpkin EA, Marquis RE, Hudspeth AJ. The selectivity of the hair cell's mechanoelectrical-transduction channel promotes Ca2+ flux at low Ca2+ concentrations. Proc Natl Acad Sci USA. 1997;94:10997–11002. doi: 10.1073/pnas.94.20.10997. [DOI] [PMC free article] [PubMed] [Google Scholar]
- Maul RS, Song Y, Amann KJ, Gerbin SC, Pollard TD, Chang DD. EPLIN regulates actin dynamics by cross-linking and stabilizing filaments. J Cell Biol. 2003;160:399–407. doi: 10.1083/jcb.200212057. [DOI] [PMC free article] [PubMed] [Google Scholar]
- McCullough BJ, Tempel BL. Haplo-insufficiency revealed in deafwaddler mice when tested for hearing loss and ataxia. Hear Res. 2004;195:90–102. doi: 10.1016/j.heares.2004.05.003. [DOI] [PubMed] [Google Scholar]
- Mejean C, Pons F, Benyamin Y, Roustan C. Antigenic probes locate binding sites for the glycolytic enzymes glyceraldehyde-3-phosphate dehydrogenase, aldolase and phosphofructokinase on the actin monomer in microfilaments. Biochem J. 1989;264:671–677. doi: 10.1042/bj2640671. [DOI] [PMC free article] [PubMed] [Google Scholar]
- Meyer RA, Sweeney HL, Kushmerick MJ. A simple analysis of the "phosphocreatine shuttle". Am J Physiol. 1984;246:C365–77. doi: 10.1152/ajpcell.1984.246.5.C365. [DOI] [PubMed] [Google Scholar]
- Neely JG, Thompson AM, Gower DJ. Detection and localization of heat shock protein 70 in the normal guinea pig cochlea. Hear Res. 1991;52:403–406. doi: 10.1016/0378-5955(91)90028-8. [DOI] [PubMed] [Google Scholar]
- Neugebauer DC, Thurm U. Chemical dissection of stereovilli from fish inner ear reveals differences from intestinal microvilli. J Neurocytol. 1984;13:797–808. doi: 10.1007/BF01148494. [DOI] [PubMed] [Google Scholar]
- Old WM, Meyer-Arendt K, Aveline-Wolf L, Pierce KG, Mendoza A, Sevinsky JR, Resing KA, Ahn NG. Comparison of label-free methods for quantifying human proteins by shotgun proteomics. Mol Cell Proteomics. 2005;4:1487–1502. doi: 10.1074/mcp.M500084-MCP200. [DOI] [PubMed] [Google Scholar]
- Ong SE, Mann M. Mass spectrometry-based proteomics turns quantitative. Nat Chem Biol. 2005;1:252–262. doi: 10.1038/nchembio736. [DOI] [PubMed] [Google Scholar]
- Petit C. From deafness genes to hearing mechanisms: harmony and counterpoint. Trends Mol Med. 2006;12:57–64. doi: 10.1016/j.molmed.2005.12.006. [DOI] [PubMed] [Google Scholar]
- Powell DW, Weaver CM, Jennings JL, McAfee KJ, He Y, Weil PA, Link AJ. Cluster analysis of mass spectrometry data reveals a novel component of SAGA. Mol Cell Biol. 2004;24:7249–7259. doi: 10.1128/MCB.24.16.7249-7259.2004. [DOI] [PMC free article] [PubMed] [Google Scholar]
- Prochasson P, Florens L, Swanson SK, Washburn MP, Workman JL. The HIR corepressor complex binds to nucleosomes generating a distinct protein/DNA complex resistant to remodeling by SWI/SNF. Genes Dev. 2005;19:2534–2539. doi: 10.1101/gad.1341105. [DOI] [PMC free article] [PubMed] [Google Scholar]
- Rezaul K, Wu L, Mayya V, Hwang SI, Han D. A systematic characterization of mitochondrial proteome from human T leukemia cells. Mol Cell Proteomics. 2005;4:169–181. doi: 10.1074/mcp.M400115-MCP200. [DOI] [PMC free article] [PubMed] [Google Scholar]
- Ricci AJ, Fettiplace R. Calcium permeation of the turtle hair cell mechanotransducer channel and its relation to the composition of endolymph. J Physiol (Lond) 1998;506:159–173. doi: 10.1111/j.1469-7793.1998.159bx.x. [DOI] [PMC free article] [PubMed] [Google Scholar]
- Rossi AM, Eppenberger HM, Volpe P, Cotrufo R, Wallimann T. Muscle-type MM creatine kinase is specifically bound to sarcoplasmic reticulum and can support Ca2+ uptake and regulate local ATP/ADP ratios. J Biol Chem. 1990;265:5258–5266. [PubMed] [Google Scholar]
- Schneider ME, Belyantseva IA, Azevedo RB, Kachar B. Rapid renewal of auditory hair bundles. Nature. 2002;418:837–838. doi: 10.1038/418837a. [DOI] [PubMed] [Google Scholar]
- Shenolikar S, Voltz JW, Cunningham R, Weinman EJ. Regulation of ion transport by the NHERF family of PDZ proteins. Physiology (Bethesda) 2004;19:362–369. doi: 10.1152/physiol.00020.2004. [DOI] [PubMed] [Google Scholar]
- Shepherd GMG, Barres BA, Corey DP. "Bundle-blot" purification and initial protein characterization of hair cell stereocilia. Proc Natl Acad Sci USA. 1989;86:4973–4977. doi: 10.1073/pnas.86.13.4973. [DOI] [PMC free article] [PubMed] [Google Scholar]
- Shi SR, Cote RJ, Taylor CR. Antigen retrieval techniques: current perspectives. J Histochem Cytochem. 2001;49:931–937. doi: 10.1177/002215540104900801. [DOI] [PubMed] [Google Scholar]
- Shi X, Gillespie PG, Nuttall AL. Na+ influx triggers bleb formation on inner hair cells. Am J Physiol Cell Physiol. 2005;288:C1332–41. doi: 10.1152/ajpcell.00522.2004. [DOI] [PubMed] [Google Scholar]
- Spicer SS, Schulte BA. Creatine kinase in epithelium of the inner ear. J Histochem Cytochem. 1992;40:185–192. doi: 10.1177/40.2.1313059. [DOI] [PubMed] [Google Scholar]
- Stauffer EA, Scarborough JD, Hirono M, Miller ED, Shah K, Mercer JA, Holt JR, Gillespie PG. Fast adaptation in vestibular hair cells requires myosin-1c activity. Neuron. 2005;47:541–553. doi: 10.1016/j.neuron.2005.07.024. [DOI] [PMC free article] [PubMed] [Google Scholar]
- Steeghs K, Benders A, Oerlemans F, de Haan A, Heerschap A, Ruitenbeek W, Jost C, van Deursen J, Perryman B, Pette D, Bruckwilder M, Koudijs J, Jap P, Veerkamp J, Wieringa B. Altered Ca2+ responses in muscles with combined mitochondrial and cytosolic creatine kinase deficiencies. Cell. 1997;89:93–103. doi: 10.1016/s0092-8674(00)80186-5. [DOI] [PubMed] [Google Scholar]
- Street VA, McKee-Johnson JW, Fonseca RC, Tempel BL, Noben-Trauth K. Mutations in a plasma membrane Ca2+-ATPase gene cause deafness in deafwaddler mice. Nat Genet. 1998;19:390–394. doi: 10.1038/1284. [DOI] [PubMed] [Google Scholar]
- Streijger F, Oerlemans F, Ellenbroek BA, Jost CR, Wieringa B, Van der Zee CEEM. Structural and behavioural consequences of double deficiency for creatine kinases BCK and UbCKmit. Behav Brain Res. 2005;157:219–234. doi: 10.1016/j.bbr.2004.07.002. [DOI] [PubMed] [Google Scholar]
- Tilney MS, Tilney LG, Stephens RE, Merte C, Drenckhahn D, Cotanche DA, Bretscher A. Preliminary biochemical characterization of the stereocilia and cuticular plate of hair cells of the chick cochlea. J Cell Biol. 1989;109:1711–1723. doi: 10.1083/jcb.109.4.1711. [DOI] [PMC free article] [PubMed] [Google Scholar]
- Tombes RM, Shapiro BM. Metabolite channeling: a phosphorylcreatine shuttle to mediate high energy phosphate transport between sperm mitochondrion and tail. Cell. 1985;41:325–334. doi: 10.1016/0092-8674(85)90085-6. [DOI] [PubMed] [Google Scholar]
- Walker RG, Hudspeth AJ, Gillespie PG. Calmodulin and calmodulin-binding proteins in hair bundles. Proc Natl Acad Sci USA. 1993;90:2807–2811. doi: 10.1073/pnas.90.7.2807. [DOI] [PMC free article] [PubMed] [Google Scholar]
- Washburn MP, Wolters D, Yates JRr. Large-scale analysis of the yeast proteome by multidimensional protein identification technology. Nat Biotechnol. 2001;19:242–247. doi: 10.1038/85686. [DOI] [PubMed] [Google Scholar]
- Yoshizaki K, Nishikawa H, Watari H. Diffusivities of creatine phosphate and ATP in an aqueous solution studied by pulsed field gradient 31P NMR. Jpn J Physiol. 1987;37:923–928. doi: 10.2170/jjphysiol.37.923. [DOI] [PubMed] [Google Scholar]
Associated Data
This section collects any data citations, data availability statements, or supplementary materials included in this article.