Abstract
In the last few years a growing interest has been devoted to disease diagnosis based on proteomic profiles of body fluids generated by mass spectrometry. In this work, we will present a new approach for their analysis for biomarker discovery. In particular, we will describe a new strategy for the analysis of SELDI/MALDI-TOF serum data based on the following three steps: i) data-preprocessing, ii) feature (mass/charge ratio, m/z) reduction and selection, iii) association of the selected features to a list of compatible known proteins. The method is applied to an ovarian cancer dataset.
Introduction
The recent developments in sample preparation and mass spectrometry allow to measure simultaneously the expression level of thousands of proteins.1,2 Moreover it has been recently discovered that a part of the protein fragments contained in body fluids, like serum, may provide very useful diagnostic information.3–5 For these reasons, in the last few years an increasing interest has been devoted to the analysis of the serum proteome, mainly for diagnostic purposes. In particular the SELDI/MALDI-TOF techniques represent promising tools for the discovery of biomarkers, i.e. protein signatures associated to a particular disease.6,7
However, the biomarker identification is not straightforward due to the presence of several sources of technical and biological complexity. A well-established procedure for data analysis is not yet available, although many studies for disease diagnosis have been recently published.8 In fact, the data analysis procedures applied in those studies significantly differ from each other.9–12 Moreover, the emphasis of many papers has been typically devoted to achieve a high diagnostic accuracy, a task which may be rather easy thanks to the abundance of available features (i.e. the m/z values) with respect to the number of analysed patients. In contrast, we believe that the most critical aspect that should be carefully investigated is understanding the results from a biological/clinical point of view, i.e. the interpretation of the classification results and the their use to discover of biomarkers which can be used in clinical practice.
In the present work, we first provide a schematic summary about the issues of the SELDI-TOF mass spectrum acquisition from serum. Then we will propose a new approach for the analysis of SELDI-TOF serum data based on the following three steps: i) data-preprocessing, ii) feature (mass/charge ratio, m/z) reduction and selection and iii) association of the selected features to a list of known compatible proteins (feature interpretation) which are possible biomarkers.
Background
In order to better clarify the issues related to analysis of mass spectrometry data, we present here a schematic view of the process that leads to the SELDI-TOF mass spectra from serum, emphasizing the fact that the low molecular weight (LMW) components of serum contain information about the cellular mechanisms under study.3–6
Some of the proteins produced by a cell go out from the cell itself.
A large quantity of these proteins are digested by proteases, generating fragments (polypeptides).
A portion of these polypeptides (fragments or whole proteins) reach the near blood vessels. Due to their small dimensions, the LMW polypeptides have high probability of passively permeating through endothelial cell wall barrier and trickling into the circulation.
Here, the polypeptides that are immediately bound with circulating high-abundance carrier proteins, such as albumin, are protected from kidney clearance. The resulting amplification of the polypeptides enables these low-abundance entities to be seen by MS-based detection and profiling.
-
SELDI analysis of LMW serum is based on two steps:
the polypeptides are captured with the selected SELDI chips;
the polypeptides under a certain mass (which depends on the energy absorbing matrix used) are then ionized (usually with H+).
-
The mass-charge ratio of each ionized polypeptide is calculated by a TOF analyzer:
m1 is the mass of polypeptide, m2 is the mass of the ionizing charge and z is the value of the charge.
To interpret the whole serum spectrum (a mixture of polypeptides) it’s necessary to better understand which are the main components of the spectrum generated by a single polypeptide with mass M:
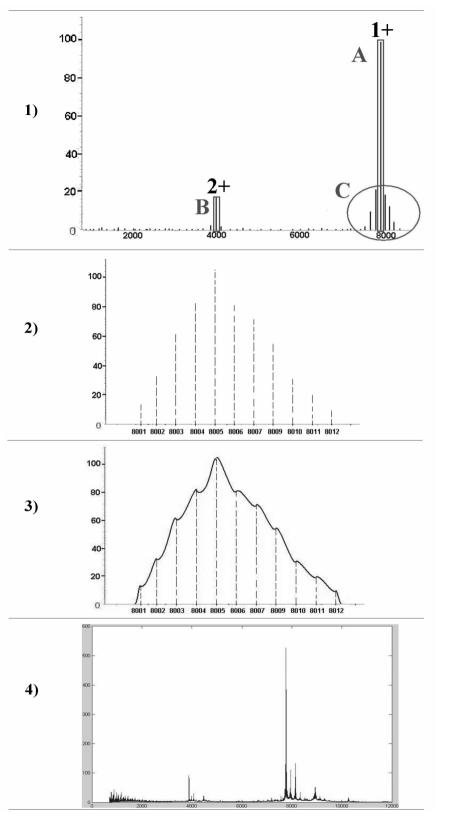
the main peak produced by the polypeptide ionized with one charge, m/z=(M+1)/1 (Figure 1–1A);
a lower peak produced by polypeptide ionized with two charges, m/z = (M+2)/2 (Figure 1–1B);
some peaks, principally close to the main peak, produced by post-translational modifications (PTMs) of the polypeptide (Figure 1–1C).
Every peak presents an isotopic distribution that consists in many isotopic sub-peaks which differs of 1 Dalton, due to the fact that the atoms of a polypeptide can be isotopes of different kinds. The highest sub-peak (the most likely sub-peak) corresponds to the most likely isotope combination, whereas the most left sub-peak is called monoisotopic peak (Figure 1–2).
In a real spectrum every isotopic peak is represented by a bell with width that depends on the routine resolution of the spectrometer. These bells may overlap (Figure 1–3).
The measured SELDI-TOF spectrum consists in the sum of the spectra generated by all the polypeptides contained in serum (Figure 1–4).
Figure 1.
Schematic summary of the measurement process.
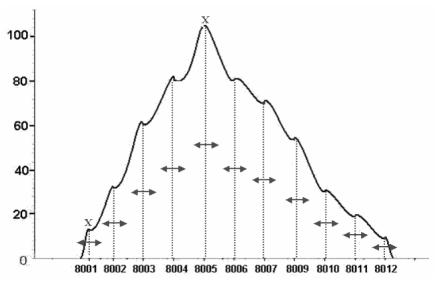
Figure 2.
Binning: the feature associated to an isotopic distribution is calculated grouping the intensities around each isotopic sub-peak.
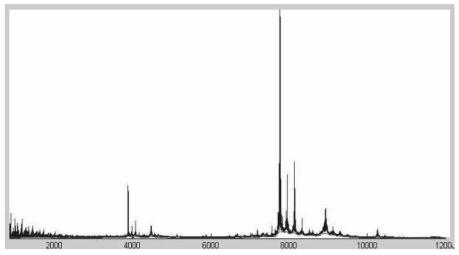
Figure 3.
Baseline valuation.
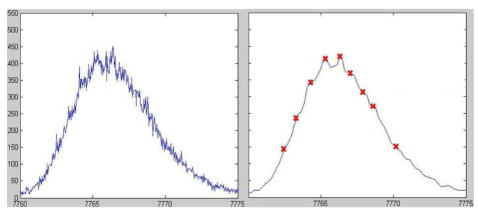
Figure 4.
Smoothing of the isotopic distribution with the highest intensity.
Methods
Let us consider a typical mass spectrometry (MS) dataset. It consists in N spectra, usually collected in two different conditions (e.g. normal and pathological subjects); every spectra contains the absolute intensity of all the different m/z detected.
The proposed procedure for the analysis of the mass spectrometry data consists of three steps.
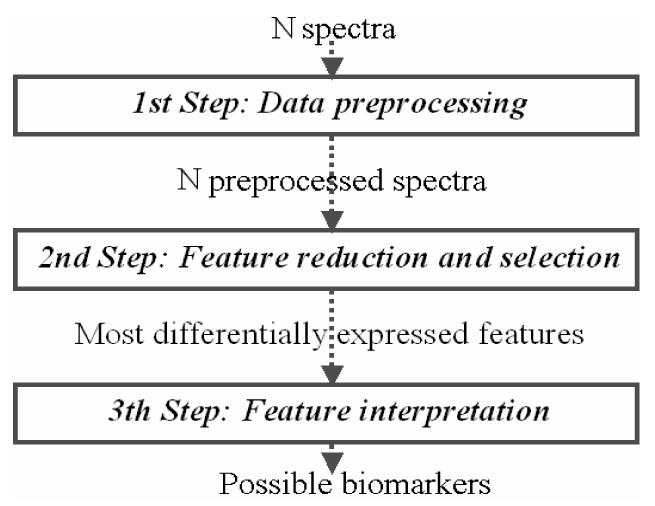
First step: Data preprocessing
Since the measured m/z can be different in each spectrum, we align the mass spectra according to the sorted union of the m/z ratios. Zero value of intensity is assigned to the m/z that are not detected in a profile. We then build a matrix, containing the data, that is used for the analysis.
Many algorithms are available for data preprocessing. For choosing the most appropriate sequence of the preprocessing algorithms, we have developed an iterative search method. The method maximizes the classification accuracy calculated by a simple classifier: after the computation of a score based on the sum of the intensities of the m/z most differentially expressed between the conditions, a one rule classifier is applied.
The search strategy follows a stepwise approach. In fact at every step of the method we select as best algorithm the preprocessing algorithm that allows the classifier to achieve the highest accuracy. The method ends when no further preprocessing is selected as the best algorithm. In order to avoid overfitting, the preprocessing and feature steps should be performed on a training set separated from the test set from the very beginning of the analysis.
Second step: Feature reduction and selection
In order to decrease the data complexity and to increase the information associated to each feature, in the second step the original m/z data (e.g. about 300000 in SELDI/TOF high resolution data) are reduced by grouping together the m/z values corresponding to the same protein.
Our algorithm exploits the available knowledge on the mass spectrometry technique (e.g. routine resolution) and the chemical properties of proteins (e.g., isotopic distribution).
First we assume, for simplicity, that all the measured ions are single charged, and therefore that every m/z represents the mass m. Second, we calculate the positions of all the possible isotopic sub-peaks in the median spectrum, i.e. the spectrum obtained by considering for each m/z the median value of the dataset, as follows:
we consider a moving window centred in each of the m/z’s. The width of the window depends on the routine resolution (R(m/z)) of the spectrometer for the m/z at the i-th centre;
we build a new curve, called envelope curve, by considering for each m/z the maximum value of the intensities in that window;
we consider, as isotopic peaks, the local maxima of the envelope curve;
Given such peaks, it is then crucial to define a suitable binning of the original spectrum. Since each peak found may correspond to a sub-peak of an isotopic distribution of a polypeptide, an optimal binning may be obtained by aggregating the portion of the spectrum corresponding to the same polypeptide.
The iterative algorithm for binning performs the following steps:
select the peak with the highest intensity from the list of the available peaks;
characterize the corresponding isotopic distribution. The location of the peak is considered as the position of the most likely sub-peak. The sub-peaks of the isotopic distribution are determined by using a regression model of the location of the monoisotopic sub-peaka;
sum the intensities corresponding to each isotopic sub-peak, considering the routine resolution. The sum is the value associated to the new feature calculated after binning;
all the peaks already grouped in the same bin are removed from the list of available peaks.
At the end of feature reduction phase, every new feature found is normalized assigning 1 to the maximum value among the N spectra, 0 to the minimum one and scaling the remaining values.
In this way, we obtain a reduced number of features that can be used for further analysis. In particular, it is then possible to apply any of the available algorithms to select the most differentially expressed features between a number of conditions of interest and to build a classifier for diagnostic purposes applying any of the available algorithms.
Third step: Feature interpretation
In the third step, we deal with the problem of the identification of the protein associated to an isotopic distribution. Usually this identification requires a further mass spectrometer experiment (PMF or MS/MS)12. Conversely, in this paper, we propose a bioinformatic approach: every feature computed and selected in the second step is associated to a list of proteins that could generate the isotopic distribution.
To this aim, a local database composed of 281707 different aminoacidic sequences annotated in the Entrez protein database among 700 and 11000 Da has been created. We have calculated the monoisotopic molecular weight of every sequence.
A given feature corresponds to an isotopic distribution about which we known the location of the most likely sub-peak. Observing on the median spectrum the distance between the waves generated by the isotopic peaks, we can infer the number of ionizing charges and so the effective mass of the polypeptide (e.g. 1 Da =>1 charge, 0.5 Da =>2 charges).
By means of the same regression model used in the second step, we can estimate the monoisotopic mass. A list of proteins can be associated to this monoisotopic mass by simply selecting in the local database the entries with molecular weight around the mass of interest ( ±[3Da+R(m/z)] ).
To reduce the length of such list, it is possible to consider only the proteins that contain at least one of the 12274 different peptides discovered in human serum by Plasma Proteome Project13.
To shorten again the list we remove the entries corresponding to “variable regions” which may hardly reach a concentration in serum such that a spectrometric peak is generated.
Results
The proposed procedure has been applied to a public dataset regarding ovarian cancer (http://home.ccr.cancer.gov/ncifdaproteomics/ppatterns.asp). It consists of 216 mass spectra (121 ovarian cancer patients and 95 healthy women) obtained from serum samples by mean of the SELDI-QqTOF MS (routine resolution ~8000) with WCX2 ProteinChip.
First step: Data preprocessing
In the first step, we have first aligned the spectra according to the sorted union of m/z ratios obtaining the matrix of the data (373401x216).
Then, by means of our procedure, we have selected three algorithms for the data preprocessing phase.
Baseline correction: a baseline signal, which has to be subtracted, is generated because sometimes the detector overestimates the number of ions arriving at its surface. We estimate the baseline with an algorithm proposed the first time by Andrade et al. (Figure 3).14
Lowpass filtering: we applied lowess and Sawitzky-Golay filters to remove the high frequency components that do not have biological meaning; only the components corresponding to the true isotopic peaks remain (Figure 4).
Second step: Feature reduction and selection
In the second step the initial 373401 m/z were reduced to 3282 features, that correspond approximately to different isotopic distributions.
We have then selected the most differentially expressed features by applying a threshold on the Information Gain (IG=∑f p(f) ∑c p(C|f) log p(C|f)). The following table contains the five isotopic distributions which perform the better classification between normal subjects and ovarian cancer patients. In particular, the location of the most likely sub-peak, the kind of ion that generated the distribution, the monoisotopic mass and the classification accuracy are shown.
Third step: Feature interpretation
In the third step, the most differentially expressed feature (selected at previous step) was associated to a short list of proteins, among which a possible biomarker for ovarian cancer can be found.
The validity of this approach was preliminary tested with success on the interpretation problem of an isotopic distribution (monoisotopic mass = 7761.3Da) experimentally identified in a previous study as associated to ”platelet factor 4”.15 With our method we were able to find the protein which generate the peak, in the short list selected, only relying on the original mass spectrometry data.
Conclusion
In the present work we have presented a data analysis procedure aimed at understanding and using for diagnostic purposes proteomic profiles of serum obtained by means of SELDI-TOF MS.
The main differences in respect to the previously published studies are:
the sequence of the preprocessing algorithms is selected through an iterative sub-optimal method;
the feature reduction step consists of a binning that is based on the nature of the signal;
an original in-silico bioinformatic method for the interpretation of the peaks is applied.
In future it will be possible to improve such procedure working on different directions, for example:
testing further algorithms for data-preprocessing in the first step;
refining the algorithm for grouping features by using biological (PTMs) or statistical information (correlation coefficient);
enlarging the database of polypeptides created at the third step, improving the knowledge about the carrier-protein and chip-protein bonds to enhance the query phase, and linking the search to other sources of information, such as OMIM.
Finally we think to validate furthermore the proposed method by applying it to other SELDI-TOF high-resolution datasets.
Table I.
Results of the feature selection
| 8602.5 | Ion single charged | 8596.5 | 89.81% |
| 4301.6 | Ion double charged | 8596.5 | 88.43% |
| 4301.2 | Ion double charged | 8596.5 | 87.04% |
| 8624.3 | PTM | 8596.5 | 87.04% |
| 8618.5 | PTM | 8596.5 | 86.11% |
Footnotes
The regression model takes the mass of the most likely isotopic sub-peak and gives the location of the monoisotopic sub-peak and the spread of the isotopic spectrum. The regression model was built using data coming form the tool “Isotopident” available on the Web (http://haven.isb-sib.ch/tools/isotopident/htdocs/).
References
- 1.Merchant M, Weinberger SR. Recent advancements in surface-enhanced laser desorption/ionization-time of flight-mass spectrometry. Electrophoresis. 2000;21(6):1164–77. doi: 10.1002/(SICI)1522-2683(20000401)21:6<1164::AID-ELPS1164>3.0.CO;2-0. [DOI] [PubMed] [Google Scholar]
- 2.Chernushevich IV, Loboda AV, Thomson BA. An introduction to quadrupole time-of-flight mass spectrometry. J Mass Spectrom. 2001;36(8):849–65. doi: 10.1002/jms.207. [DOI] [PubMed] [Google Scholar]
- 3.Liotta LA, Petricoin EF., III Written in blood. Nature. 2003;425:905. doi: 10.1038/425905a. [DOI] [PubMed] [Google Scholar]
- 4.Petricoin EF, III, Liotta LA. Mass spectrometry-based diagnostics: the upcoming revolution in disease detection. Clinical Chemistry. 2003;49(4):533–534. doi: 10.1373/49.4.533. [DOI] [PubMed] [Google Scholar]
- 5.Mehta AI, Ross S, Lowenthal MS, Fusaro V, Fishman DA, Petricoin EF, III, Liotta LA. Biomarker amplification by serum carrier protein binding. Dis Markers. 2004;19(1):1–10. doi: 10.1155/2003/104879. [DOI] [PMC free article] [PubMed] [Google Scholar]
- 6.Petricoin EF, III, Liotta LA. SELDI-TOF-based serum proteomic pattern diagnostics for early detection of cancer. Curr Opin Biotechnol. 2004;15(1):24–30. doi: 10.1016/j.copbio.2004.01.005. [DOI] [PubMed] [Google Scholar]
- 7.Conrads TP, Zhou M, Petricoin EF, III, Liotta L, Veenstra TD. Cancer diagnosis using proteomic patterns. Expert Rev Mol Diagn. 2003;3(4):411–20. doi: 10.1586/14737159.3.4.411. [DOI] [PubMed] [Google Scholar]
- 8.Grizzle WE, Semmes OJ, Bigbee W, Zhu L, Malik G, Oelschlager DK, Manne B, Manne U. The Need for Review and Understanding of SELDI/MALDI Mass. Cancer Informatics. 2005;1(1):86–97. [PMC free article] [PubMed] [Google Scholar]
- 9.Conrads TP, Fusaro VA, Ross S, Johann D, Rajapakse V, Hitt BA, Steinberg SM, Kohn EC, Fishman DA, Whitely G, Barrett JC, Liotta LA, Petricoin EF, III, Veenstra TD. High resolution serum proteomic features for ovarian cancer detection. Endocr Relat Cancer. 2004;11(2):163–78. doi: 10.1677/erc.0.0110163. [DOI] [PubMed] [Google Scholar]
- 10.Ressom HW, Varghese RS, Abdel-Hamid M, Eissa SA, Saha D, Goldman L, Petricoin EF, Conrads TP, Veenstra TD, Loffredo CA, Goldman R. Analysis of mass spectral serum profiles for biomarker selection. Bioinformatics. 2005;121(21):4039–45. doi: 10.1093/bioinformatics/bti670. [DOI] [PubMed] [Google Scholar]
- 11.Yu JS, Ongarello S, Fiedler R, Chen XW, Toffolo G, Cobelli C, Trajanoski Z. Ovarian cancer identification based on dimensionality reduction for high-throughput mass spectrometry data. Bioinformatics. 2005;21(10):2200–9. doi: 10.1093/bioinformatics/bti370. [DOI] [PubMed] [Google Scholar]
- 12.Zhang Z, Bast RC, Jr, Yu Y, Li J, Sokoll LJ, Rai AJ, Rosenzweig JM, Cameron B, Wang YY, Meng XY, Berchuck A, Van Haaften-Day C, Hacker NF, de Bruijn HW, van der Zee AG, Jacobs IJ, Fung ET, Chan DW. Three biomarkers identified from serum proteomic analysis for the detection of early stage ovarian cancer. Cancer Res. 2004;64:5882–5890. doi: 10.1158/0008-5472.CAN-04-0746. [DOI] [PubMed] [Google Scholar]
- 13.Omenn GS, et al. Overview of the HUPO Plasma Proteome Project: results from the pilot phase with 35 collaborating laboratories and multiple analytical groups, generating a core dataset of 3020 proteins and a publicly-available database. Proteomics. 2005;5(13):3226–45. doi: 10.1002/pmic.200500358. [DOI] [PubMed] [Google Scholar]
- 14.Andrade L, Manolakos E. Signal Background Estimation and Baseline Correction Algorithms for Accurate DNA Sequencing. Journal of VLSI, special issue on Bioinformatics. 2003;353:229–243. [Google Scholar]
- 15.Vermeulen R, Lan Q, Zhang L, Gunn L, McCarthy D, Woodbury RL, McGuire M, Podust VN, Li G, Chatterjee N, Mu R, Yin S, Rothman N, Smith MT. Decreased levels of CXC-chemokines in serum of benzene-exposed workers identified by array-based proteomics. Proc Natl Acad Sci U S A. 2005;102(47):17041–6. doi: 10.1073/pnas.0508573102. [DOI] [PMC free article] [PubMed] [Google Scholar]


