Abstract
The clinical effects of hypokalemia including action potential prolongation and arrhythmogenicity suppressible by lidocaine were reproduced in hypokalemic (3.0 mM K+) Langendorff-perfused murine hearts before and after exposure to lidocaine (10 μM). Novel limiting criteria for local and transmural, epicardial, and endocardial re-excitation involving action potential duration (at 90% repolarization, APD90), ventricular effective refractory period (VERP), and transmural conduction time (Δlatency), where appropriate, were applied to normokalemic (5.2 mM K+) and hypokalemic hearts. Hypokalemia increased epicardial APD90 from 46.6 ± 1.2 to 53.1 ± 0.7 ms yet decreased epicardial VERP from 41 ± 4 to 29 ± 1 ms, left endocardial APD90 unchanged (58.2 ± 3.7 to 56.9 ± 4.0 ms) yet decreased endocardial VERP from 48 ± 4 to 29 ± 2 ms, and left Δlatency unchanged (1.6 ± 1.4 to 1.1 ± 1.1 ms; eight normokalemic and five hypokalemic hearts). These findings precisely matched computational predictions based on previous reports of altered ion channel gating and membrane hyperpolarization. Hypokalemia thus shifted all re-excitation criteria in the positive direction. In contrast, hypokalemia spared epicardial APD90 (54.8 ± 2.7 to 60.6 ± 2.7 ms), epicardial VERP (84 ± 5 to 81 ± 7 ms), endocardial APD90 (56.6 ± 4.2 to 63.7 ± 6.4 ms), endocardial VERP (80 ± 2 to 84 ± 4 ms), and Δlatency (12.5 ± 6.2 to 7.6 ± 3.4 ms; five hearts in each case) in lidocaine-treated hearts. Exposure to lidocaine thus consistently shifted all re-excitation criteria in the negative direction, again precisely agreeing with the arrhythmogenic findings. In contrast, established analyses invoking transmural dispersion of repolarization failed to account for any of these findings. We thus establish novel, more general, criteria predictive of arrhythmogenicity that may be particularly useful where APD90 might diverge sharply from VERP.
Keywords: Arrhythmia, Refractory period, Conduction time, Action potential duration, Transmural dispersion of repolarization, Critical intervals
Introduction
Hypokalemia exerts important clinical effects on cardiac function that in some respects resemble those seen in the congenital long-QT syndromes (LQTS). Thus, both conditions result in electrocardiographic QT prolongation [12, 23] and premature ventricular depolarizations (PVDs), which may result in the initiation of an arrhythmic activity [41, 52]. In contrast to the cardiac effects of hypokalemia, arrhythmic activity in LQTS has been extensively studied and has often been attributed to after-depolarizations occurring against a background of re-entrant substrate [2, 36, 44]. Re-entry may take place as a result of inhomogeneities producing regions of conduction block, which lead to wave-break and circus movement [21, 37] or altered repolarization gradients, which lead to wave reflection [1]. In this situation, depolarization propagates from active cells into previously active adjacent regions, establishing re-entrant circuits. These may become established either locally or over larger regions of the myocardium, such as across the thickness of the myocardial wall.
Tendencies to transmural re-entrant excitation in models of LQTS have been previously analyzed in terms of transmural dispersions of repolarization (TDR) obtained from the positive part of the difference between respective endocardial and epicardial stimulation to repolarization times [36, 44, 45]. In human LQTS, increases in the interval between the peak and full recovery of electrocardiographic precordial T waves (Tpeak to Tend), previously shown to reflect TDR [54], are indeed associated with arrhythmic activity [33]. Certainly, recent reports correlate Tpeak to Tend to arrhythmic risk more closely than more widely accepted indicators such as corrected QT interval and QT dispersion [53]. However, such re-excitation may also be limited by recovery from refractoriness; re-entrant excitation would require this to precede the return of the membrane potential to threshold [40]. Certainly, class 1 antiarrhythmic drugs such as lidocaine are known to increase ventricular effective refractory period (VERP) [28]. Yet, such use of spatial differences in action potential repolarization times to quantify arrhythmic substrate neither explicitly considers changes in VERP nor applies such criteria to potential local as opposed to transmural re-excitation.
This paper associates for the first time the proarrhythmic effect of hypokalemia with a significant decrease in VERP, despite contrasting prolongation of action potentials, in agreement with computer-modeling studies of action potential waveforms using established data on the various effects of hypokalemia on ionic conductivity properties of ventricular myocytes. Furthermore, it associates the antiarrhythmic effects of lidocaine with a significant increase in VERP, despite having little effect on action potential duration, in agreement with clinical observations. Analyses using TDR were insufficiently sensitive to account for any of these arrhythmogenic findings. This study accordingly established more general novel criteria that would provide necessary conditions for local and transmural and epicardial and endocardial re-excitation incorporating not only action potential duration but also VERP and conduction times that may be particularly useful when action potential duration differs sharply from VERP. These criteria successfully accounted for all the arrhythmogenic findings.
Materials and methods
Experimental animals
Mice were housed in an animal facility at 21 ± 1°C with 12 h light/dark cycles. Animals were fed sterile chow (RM3 Maintenance Diet, SDS, Witham, Essex, UK) and had free access to water. Wild-type 129 Sv mice aged 3–6 months were used in the experiments. All procedures complied with UK Home Office regulations (Animals [Scientific Procedures] Act 1986).
Solutions
All solutions were based on bicarbonate-buffered Krebs-Henseleit solution (mM: NaCl 119, NaHCO3 25, KCl 4, KH2PO4 1.2, MgCl2 1, CaCl2 1.8, glucose 10 and Na-pyruvate 2; pH adjusted to 7.4) bubbled with 95% O2/5% CO2 (British Oxygen Company, Manchester, UK). Hypokalemic (3.0 mM K+) solutions were prepared by reducing the quantity of KCl added. Lidocaine-containing normokalemic and hypokalemic solutions were prepared by adding lidocaine (Sigma–Aldrich, Poole, UK) to a final concentration of 10 μM.
Preparation
A Langendorff-perfusion protocol previously adapted for murine hearts [4] was used. In brief, mice were killed by cervical dislocation (Schedule 1: UK Animals [Scientific Procedures] Act 1986), and hearts were then quickly excised and placed in ice-cold bicarbonate-buffered Krebs-Henseleit solution. A short section of aorta was cannulated under the surface of the solution and attached to a custom-made 21-gauge cannula filled with the same solution using an aneurysm clip (Harvard Apparatus, Edenbridge, Kent, UK). Fresh Krebs-Henseleit solution was then passed through 200 and 5 μm filters (Millipore, Watford, UK) and warmed to 37°C using a water jacket and circulator (Techne model C-85A, Cambridge, UK) before being used for constant-flow retrograde perfusion at 2–2.5 ml/min using a peristaltic pump (Watson-Marlow Bredel model 505S, Falmouth, Cornwall, UK). Hearts were regarded as suitable for experimentation if, on rewarming, they regained a healthy pink colour and began to contract spontaneously.
Electrophysiological measurements
An epicardial monophasic action potential (MAP) electrode (Hugo Sachs, Harvard Apparatus) was placed against the basal region of the left ventricular epicardium. In addition, a small access window was created in the interventricular septum to allow access to the left ventricular endocardium [9]. A custom-made endocardial MAP electrode composing two twisted strands of high-purity Teflon-coated 0.25 mm diameter silver wire (Advent Research Materials, UK) was constructed. The Teflon coat was removed from the distal 1 mm of the electrode, which was then galvanically chlorided to eliminate DC offset, inserted and placed against the septal endocardial surface. MAPs were amplified, band-pass filtered (0.5 Hz to 1 kHz: Gould 2400S, Gould-Nicolet Technologies, Ilford, Essex, UK), and digitized at a sampling frequency of 5 kHz (micro1401, Cambridge Electronic Design, Cambridge, UK). Analysis of MAPs was performed using Spike II software (Cambridge Electronic Design).
Experimental protocol
A bipolar platinum stimulating electrode (1 mm interpole spacing) was placed on the basal surface of the right ventricular epicardium. Square-wave stimuli (Grass S48 stimulator, Grass-Telefactor, Slough, UK) of 2 ms duration and with amplitudes of twice the excitation threshold were initially applied to hearts at a constant cycle length of 125 ms for at least 10 min and until MAPs showed stable baselines, rapid upstroke phases that reached consistent amplitudes and smooth repolarization phases [30]. Hearts were then exposed to test solutions for 20 min, during which time stimulation was continued, before subsequent recordings were made.
Intrinsically evoked MAPs were recorded in the absence of stimulation while action potential duration (at 90% repolarization, APD90) and stimulation to depolarization latency were determined during regular stimulation at a constant interstimulus interval of 125 ms. Hearts were then subjected to an adapted form of an extrasystolic electrical stimulation procedure previously used to assess arrhythmogenicity and refractoriness in both human [43] and murine [22] studies of congenital LQTS, described in detail later. The possibility that events evoked by extrasystolic stimuli rather represented motion artifacts was excluded by their being reproducible between hearts and appearing identical in both electrodes.
All data are presented as means±standard errors of the means and include both the number of repetitions and the number of hearts. Comparisons were made using analysis of variance (significance threshold set at P ≤ 0.05).
Modeling
The charge-difference model of Fraser and Huang [16, 18] was adapted to permit computational modeling of the murine ventricular cardiac myocyte using ion channel equations and parameters from the model of Bondarenko et al. [6] with the Na+/K+-ATPase model of Hernandez et al. [24]. The use of charge-difference modeling allowed the model to reach a true beat-to-beat steady state that was independent of initial intracellular ion concentrations [17], thus permitting simulation of the influence of changes in extracellular ion concentrations that are well recognized to influence Na+/K+-ATPase activity, and hence steady-state intracellular ion concentrations.
Model cells were studied under normokalemic (5.2 mM K+) conditions with normal ion permeabilities, hypokalemic (3 mM K+) conditions with these same ion permeabilities and hypokalemic (3 mM K+) conditions with the K+ permeabilities of channels carrying the repolarizing currents IK1 and Ito reduced by 20%, replicating the effect of such hypokalemia on transmembrane K+ permeabilities observed experimentally by Killeen et al. [29]. Stimulation was applied at a regular 125 ms interstimulus interval at an amplitude of twice the diastolic threshold, as for the experimental preparations. After beat-to-beat stability was achieved, APD90 was measured under each condition. Refractory periods were then determined using a similar protocol to that used in the experiments, every eighth (S1) stimulus being followed by an extrasystolic (S2) stimulus. S1S2 interval was initially 70 ms and was subsequently decremented by 1 ms with each successive cycle until an S2 stimulus failed to initiate an action potential.
Results
After-depolarizations initiate arrhythmic activity in bradycardic hypokalemic hearts
In initial experiments, isolated perfused hearts were stimulated at a constant interstimulus interval of 125 ms for 20 min after 20 min exposure to test solutions. This demonstrated stable trains of MAPs, under all normokalemic (5.2 mM K+, n = 7; five hearts), hypokalemic (3.0 mM K+, n = 8; five hearts), or lidocaine-treated (10 μM) normokalemic (n = 6; five hearts) or hypokalemic (n = 7; five hearts) conditions: After-depolarizations and arrhythmic activity were consistently absent throughout. The subsequent experiments then examined arrhythmic properties at the longer cycle lengths (between 224 and 271 ms) that occurred in the absence of extrinsic stimulation (Fig. 1) and that have previously been reported to be proarrhythmic both under hypokalemic conditions and in the congenital LQTS [11]. Intrinsic cycle length did not differ significantly (P > 0.05) between normokalemic (250 ± 21 ms, six hearts), hypokalemic (253 ± 16 ms, seven hearts), lidocaine-treated normokalemic (248 ± 22 ms, six hearts), and lidocaine-treated hypokalemic (260 ± 10 ms, eight hearts) hearts.
Fig. 1.
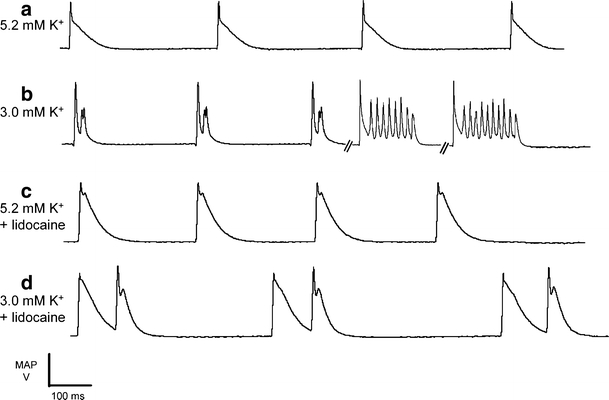
After-depolarizations and arrhythmic activity in spontaneously contracting hypokalemic hearts. Epicardial monophasic action potential recordings in the absence of extrinsic stimulation in hearts exposed to normokalemic (5.2 mM K+, a) and hypokalemic (3.0 mM K+, b) test solutions and normokalemic (c) and hypokalemic (d) test solutions containing lidocaine (10 μM) for 20 min
Epicardial MAPs then retained morphologically consistent waveforms and were entirely free of after-depolarization and arrhythmic phenomena through 116 min of recordings over six normokalemic hearts (Fig. 1a). In contrast, 46 ± 7% of MAPs showed after-depolarizations early in their repolarization phases during 140 min of recordings that led to episodes of arrhythmic activity in 52 ± 3% of cases in five out of seven hypokalemic hearts (P < 0.01 as compared to normokalemic hearts, Fig. 1b). However, MAPs showed consistent waveforms without such after-depolarizations or arrhythmic activity during 118 min of recordings over six lidocaine-treated normokalemic hearts (Fig. 1c). Finally, 40 ± 9% of MAPs showed after-depolarizations occurring late in the repolarization phase in 40 ± 9% of cases more than 98 min of recordings in six out of eight lidocaine-treated hypokalemic hearts (P > 0.05 as compared to hypokalemic hearts). After-depolarizations occurred more frequently in those instances where intrinsic cycle length was long. However, these events were never followed by arrhythmic activity (P < 0.01 as compared to hypokalemic hearts, Fig. 1d).
Extrasystolic stimulation immediately after recovery from refractoriness initiates arrhythmic activity in hypokalemic hearts
A programmed electrical stimulation protocol recently shown to predict arrhythmogenicity in clinical LQTS [43] and previously adapted for use in murine models of LQTS [22] confirmed the above arrhythmogenic tendencies in hypokalemic hearts (Fig. 2). This comprised regular (S1) stimulation at a constant interstimulus interval of 125 ms interrupted by an extrasystolic (S2) stimulus after every eighth S1 stimulus. The S1S2 interval was decremented in 1 ms steps with each successive stimulus cycle from an initial value of 120 ms until the S2 stimulus either appeared to initiate arrhythmic activity, confirmed during an imposed 250 ms pause, or failed to initiate a MAP suggesting that the VERP has been reached. Accordingly, VERP values are reported to the nearest millisecond.
Fig. 2.
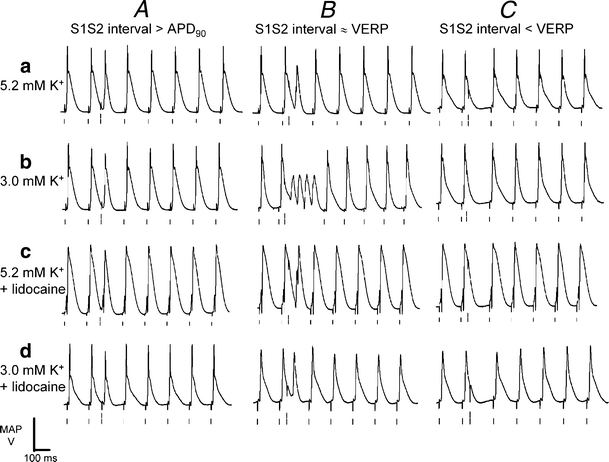
Arrhythmic activity in hypokalemic hearts after extrasystolic stimulation applied close to the refractory period. Epicardial monophasic action potential recordings resulting from application of extrasystolic (S2) stimuli at S1S2 intervals greater than the action potential duration at 90% repolarization (A), just greater than the ventricular effective refractory period (VERP; B), and just less than the VERP (C) in hearts exposed to normokalemic (5.2 mM K+, a) and hypokalemic (3.0 mM K+, b) test solutions and normokalemic (c) and hypokalemic (d) test solutions containing lidocaine (10 μM) for 20 min. Single vertical lines indicate the timing of S1 stimuli, and double lines indicate the timing of S2 stimuli
Normokalemic hearts (Fig. 2a, A–C) again were consistently free from arrhythmic activity after S2 stimulation after any S1S2 interval (n = 11; eight hearts). This also applied to hypokalemic hearts when S2 stimuli were delivered when MAPs had reached 90% repolarization (Fig. 2b, A, n = 7; five hearts). However, S2 stimuli delivered within the period just after recovery from refractoriness consistently initiated arrhythmic activity under these conditions (Fig. 2b, B). In contrast, S2 stimuli delivered before recovery from refractoriness failed to elicit MAPs, and this was followed by the resumption of stable rhythms (Fig. 2b, C). Finally, S2 stimulation did not result in arrhythmic activity in lidocaine-treated hearts whatever the S1S2 interval, whether under normokalemic (Fig. 2c, A–C, n = 8; six hearts) or hypokalemic (Fig. 2d, A–C, n = 8; five hearts) conditions. When taken together, the presence or absence of arrhythmogenicity in these experiments parallels clinical findings.
Arrhythmic tendency in hypokalemia correlates with increased local critical intervals
One hypothesis for the tendency towards either local or transmural re-excitation during action potential repolarization might consider the relationship between the time course of the recovery of membrane voltage and the corresponding time course of recovery of excitability from total refractoriness to a finite threshold for excitation in the myocardial regions concerned. These parameters were approximated by action potential duration at 90% repolarization (APD90) and VERP, respectively. Both these were measured during the procedures of the kind illustrated in Fig. 2, allowing for the delay between endocardial and epicardial excitation where appropriate. Firstly, the risk of local reexcitation of either the epicardium or the endocardium would be reflected in a critical interval given by the relevant APD90–VERP. Secondly, the risk of transmural re-excitation of either the epicardium by the endocardium (or the reverse) would require incorporation of the delay between endocardial and epicardial excitation given by the difference between endocardial and epicardial stimulation to depolarization latencies, Δlatency. This would give critical intervals of (endocardial APD90 + Δlatency−epicardial VERP) and (epicardial APD90 + Δlatency−endocardial VERP), respectively.
Figures 3a and 4a show typical epicardial and endocardial action potential waveforms during regular stimulation under each of the four above conditions (A–D). Figures 3b and 4b show the corresponding APD90s (vertical solid lines and dense hashing), VERPs (vertical broken lines and sparse hashing), and local critical intervals (shading). Asterisks indicate values that are significantly (P < 0.05) larger and daggers those that are smaller than those recorded in normokalemic hearts. Neither epicardial (46.6 ± 1.2 ms) nor endocardial (58.2 ± 3.7 ms) APD90s were significantly different (P > 0.05) from the corresponding VERPs (41 ± 4 and 48 ± 4 ms) under normokalemic conditions (Figs. 3A and 4A, n = 10; eight hearts). This resulted in local critical intervals taking small positive values of 5.4 ± 4.3 ms in the epicardium and 9.8 ± 5.3 ms in the endocardium. In contrast, epicardial (53.1 ± 0.7 ms) but not endocardial (56.9 ± 4.0 ms) APD90 increased significantly (P < 0.05), whereas both epicardial (29 ± 1 ms) and endocardial (29 ± 2 ms) VERPs decreased significantly under hypokalemic conditions (Figs. 3B and 4B, n = 6; five hearts). This resulted in significant positive shifts (P < 0.01) in both epicardial (23.7 ± 1.2 ms) and endocardial (28.5 ± 4.6 ms) local critical intervals, in fitting with the occurrence of arrhythmic activity under hypokalemic conditions.
Fig. 3.
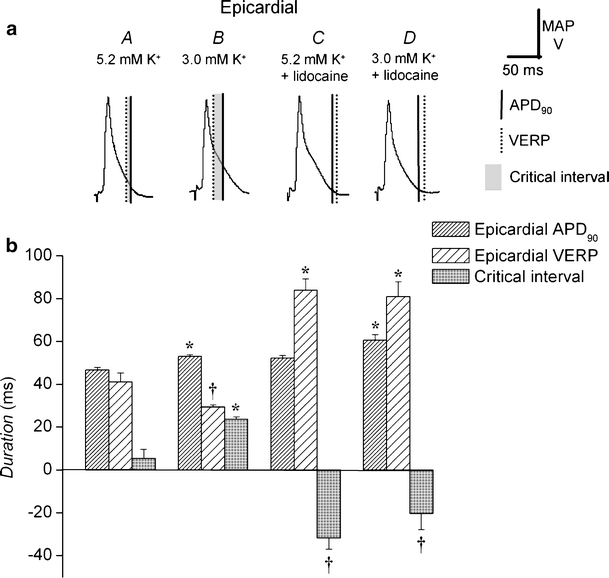
Changes in epicardial action potential duration, ventricular effective refractory period, and local critical interval after exposure to hypokalemia and to lidocaine. Epicardial MAP waveforms during regular stimulation in hearts exposed to normokalemic (5.2 mM K+, A) and hypokalemic (3.0 mM K+, B) test solutions and normokalemic (C) and hypokalemic (D) test solutions containing lidocaine (10 μM) for 20 min comparing action potential duration at 90% repolarization; APD90 (vertical solid lines), VERP (vertical broken lines), and local critical interval (shading; a). Action potential duration at 90% repolarization, APD90 (dense hashing), VERP (sparse hashing) and critical interval (shading) under these conditions (b). Asterisks indicate values that are significantly (P < 0.05) larger and daggers those that are smaller than those recorded in normokalemic hearts
Fig. 4.
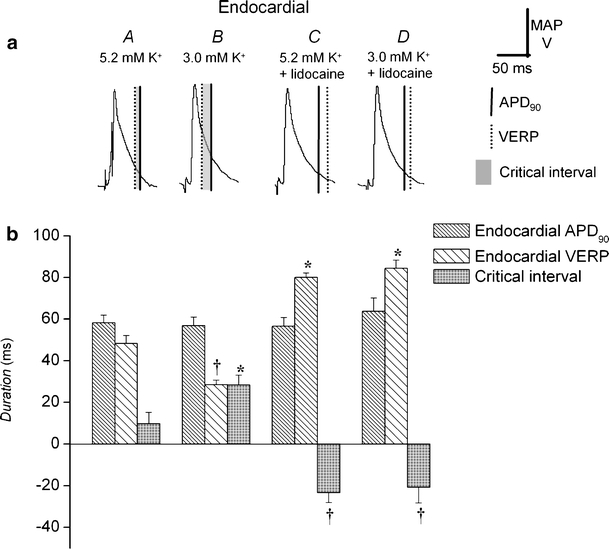
Changes in endocardial action potential duration, ventricular effective refractory period, and local critical interval after exposure to hypokalemia and to lidocaine. Endocardial MAP morphologies during regular stimulation in hearts exposed to normokalemic (5.2 mM K+, A) and hypokalemic (3.0 mM K+, B) test solutions and normokalemic (C) and hypokalemic (D) test solutions containing lidocaine (10 μM) for 20 min comparing action potential duration at 90% repolarizationl; APD90 (vertical solid lines), VERP (vertical broken lines), and local critical interval (shading; a). Action potential duration at 90% repolarization, APD90 (dense hashing), VERP (sparse hashing), and critical interval (shading) under these conditions (b). Asterisks indicate values that are significantly (P < 0.05) larger and daggers those that are smaller than those recorded in normokalemic hearts
The opposing effects of hypokalemia on APD90 and VERP can be explained in terms of alterations in conductances of repolarizing K+-channels
The above MAP findings concerning APD90 and VERP were in close agreement with the predictions of established ion channel equations and parameters from the model of Bondarenko et al. [6] with the Na+/K+-ATPase model of Hernandez et al. [24] using charge-difference modeling in simulated single cells. The model simulated the effects of regular stimulation at a 125 ms interstimulus interval until a steady state was reached, as reflected in beat-to-beat stability. Action potential characteristics were then simulated under normokalemic conditions, hypokalemic conditions with normal K+ permeabilities, and hypokalemic condition with the 20% reduction in the permeabilities of channels carrying the repolarizing K+ currents IK1 and Ito (C) as reported in recent experimental results [29] (Fig. 5). Figure 5a demonstrates the predicted steady-state action potential waveforms under each condition. Figure 5a and b also show APD90 (vertical solid lines and dense hashing), VERP (vertical broken lines and sparse hashing), and critical intervals (shading). Under normokalemic conditions (A), the resting membrane potential was −83 mV. APD90 (22 ms) was shorter than recorded in the whole hearts in keeping with previous results from microelectrode studies [7, 20]. Nevertheless, APD90 was shorter than VERP (27 ms) resulting in a critical interval of −5 ms. Figures 5B (a and b) demonstrate the consequences of an altered Nernst potential for K+ alone both upon resting membrane potential and the time course of a subsequent action potential. Hypokalemia hyperpolarized the membrane potential (−93 mV) and shortened both APD90 (19 ms) and VERP (25 ms), thus having little effect on the limiting criterion for re-excitation (−6 ms). In contrast, Fig. 5C (a and b) additionally demonstrate the combined effects of hypokalemia on both the Nernst potential and K+ permeabilities of the respective channels carrying IK1 and Ito. Although there was no additional effect on the resting membrane potential (−93 mV), hypokalemia increased both APD90 (29 ms) and VERP (27 ms) causing a positive shift in critical interval from −5 ms to +2 ms (Fig. 5C).
Fig. 5.
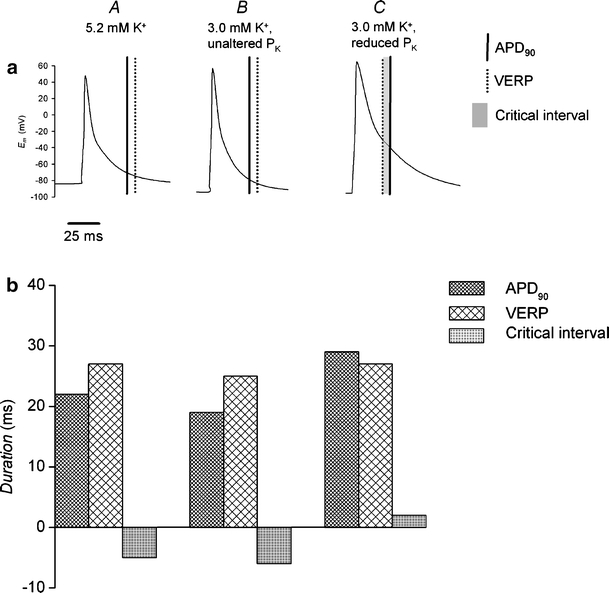
Computational modeling of murine ventricular action potentials showing changes in action potential duration, ventricular effective refractory period, and critical interval after exposure to hypokalemia. Action potential morphologies during regular stimulation in cells under normokalemic (5.2 mM K+, A) and hypokalemic (3.0 mM K+) conditions comparing action potential duration at 90% repolarization; APD90 (vertical solid lines), VERP (vertical broken lines), and critical interval (shading; a). In B, permeabilities of ion channel are under normokalemic conditions. In C, permeabilities of ion channels carrying the repolarizing K+ currents IK1 and Ito are reduced by 20%. APD90 (dense hashing), VERP (sparse hashing), and critical interval (shading) under these conditions (b)
The abolition of arrhythmic tendency by lidocaine correlates with negative shifts in local critical intervals
Exposure of normokalemic hearts to lidocaine (Figs. 3, C and 4C) significantly increased (P < 0.05) epicardial (54.8 ± 2.7 ms), although not endocardial (56.6 ± 4.2 ms), APD90 and significantly increased (P < 0.01) both epicardial (84 ± 5 ms) and endocardial (80 ± 2 ms) VERPs (n = 5; five hearts). This resulted in significant (P < 0.01) negative shifts in local critical intervals in both the epicardium (−31.7 ± 5.3 ms) and endocardium (−23.4 ± 4.7 ms). Lidocaine exerted concordant effects on hypokalemic hearts (Figs. 3D and 4D): Epicardial APD90 increased to 60.6 ± 2.7 ms, and endocardial APD90 remained unchanged (63.7 ± 6.4 ms), whereas both epicardial (81 ± 7 ms) and endocardial (84 ± 4 ms) VERPs were significantly increased (P < 0.05, n = 6; five hearts). The resulting significant negative shifts (P < 0.01) in local critical intervals in both epicardium (−20.4 ± 7.5 ms) and endocardium (−20.7 ± 7.6 ms) paralleled the antiarrhythmic effect of lidocaine.
Arrhythmic tendency in hypokalemia also correlates with increased transmural critical intervals
Figures 6a and 7a show epicardial and endocardial action potential waveforms during regular stimulation under each condition. Figures 6b and 7b show APD90 (vertical solid lines and dense hashing) and VERPs (vertical dotted lines and sparse hashing), as detailed above, together with Δlatencies (horizontal arrows and horizontal shading) and transmural critical intervals (shading) under the four conditions studied. Asterisks indicate values that are significantly (P < 0.05) larger and daggers those that are smaller than recorded in normokalemic hearts. Figure 6 thus compares endocardial APD90s with epicardial VERPs, allowing for Δlatency to describe critical intervals for epicardial re-excitation. In contrast, Fig. 7 compares epicardial APD90s with endocardial VERPs, allowing for Δlatency to describe critical intervals for endocardial re-excitation.
Fig. 6.
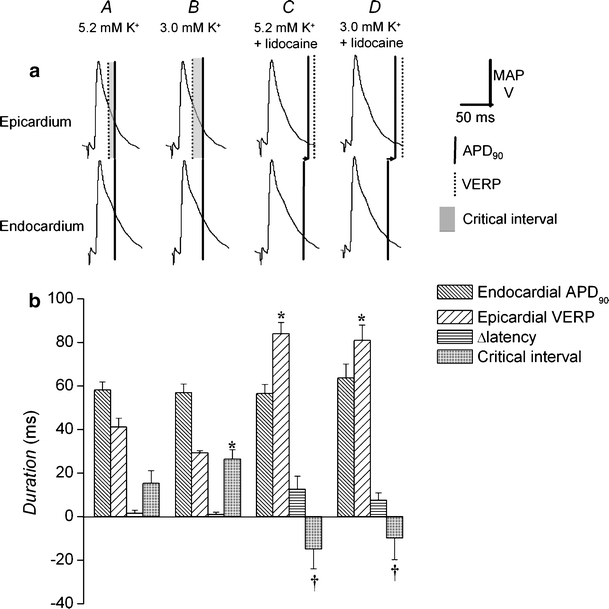
Changes in endocardial action potential duration, epicardial ventricular effective refractory period, transmural conduction time, and epicardial transmural critical interval after exposure to hypokalemia and to lidocaine. Epicardial and endocardial MAP morphologies during regular stimulation cross-comparing epicardial and endocardial waveforms and the relationship between the action potential duration at 90% repolarization; APD90 (vertical solid lines) and VERP (vertical broken lines) of one waveform and the decay of the other, indicating critical intervals (shading). Hearts were exposed to normokalemic (5.2 mM K+, A) and hypokalemic (3.0 mM K+, B) test solutions and normokalemic (C) and hypokalemic (D) test solutions containing lidocaine (10 μM) for 20 min. Horizontal arrows indicate the time taken for depolarization to spread from epicardium to endocardium (a). APD90 (dense hashing), VERP (sparse hashing), transmural conduction time (horizontal hashing), and critical interval (shading) under these conditions (b). Asterisks indicate values that are significantly (P < 0.05) larger, and daggers those that are smaller than those recorded in normokalemic hearts
Fig. 7.
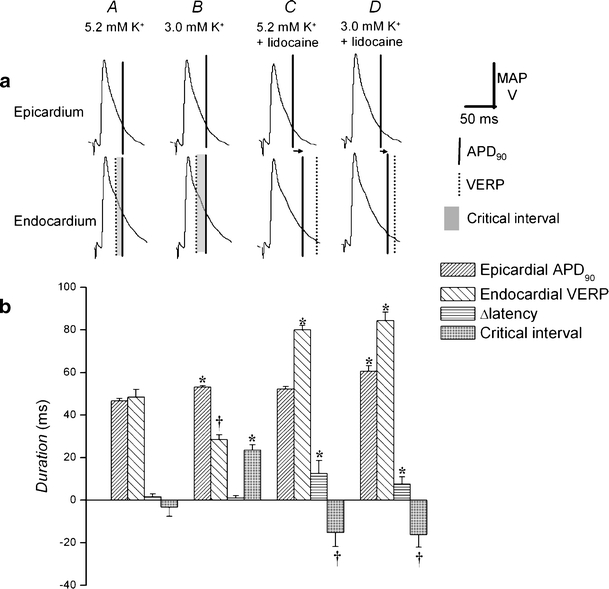
Changes in epicardial action potential duration, endocardial ventricular effective refractory period, transmural conduction time, and endocardial transmural critical interval after exposure to hypokalemia and to lidocaine. Epicardial and endocardial MAP morphologies during regular stimulation cross-comparing epicardial and endocardial waveforms and the relationship between the action potential duration at 90% repolarization; APD90 (vertical solid lines) and VERP (vertical broken lines) of one waveform and the decay of the other, indicating critical intervals (shading). Hearts were exposed to normokalemic (5.2 mM K+, A) and hypokalemic (3.0 mM K+, B) test solutions and normokalemic (C) and hypokalaemic (D) test solutions containing lidocaine (10 μM) for 20 min. Horizontal arrows indicate the time taken for depolarization to spread from epicardium to endocardium (a). APD90 (dense hashing), VERP (sparse hashing), transmural conduction time (horizontal hashing), and critical interval (shading) under these conditions (b). Asterisks indicate values that are significantly (P < 0.05) larger and daggers those that are smaller than those recorded in normokalemic hearts
Epicardial (21.0 ± 0.82 ms) and endocardial (58.2 ± 3.7 ms) latencies were statistically indistinguishable in normokalemic hearts giving a Δlatency of 1.6 ± 1.4 ms. This contributed to significant (P < 0.05) negative shifts in transmural critical intervals in both the epicardium and endocardium (−14.3 ± 6.1 and −3.3 ± 4.2 ms, respectively, Figs. 6A and 7A). Hypokalemia had no significant effect (P > 0.05) on latencies or on Δlatency (1.1 ± 1.1 ms) but resulted in significant (P > 0.01) positive shifts in transmural critical intervals in both the epicardium (23.6 ± 2.6 ms) and endocardium (29.2 ± 6.0 ms; Figs. 6B and 7B).
The abolition of arrhythmic tendency by lidocaine also correlates with significantly decreased transmural critical intervals
In contrast, exposure of normokalemic hearts to lidocaine significantly increased both epicardial and endocardial latencies (33.8 ± 2.6 and 46.3 ± 5.6 ms, respectively) but still did not significantly alter (P > 0.05) Δlatency (12.5 ± 6.2 ms). However, transmural critical intervals became significantly negative in both the epicardium (−15.2 ± 6.6 ms) and endocardium (−16.6 ± 8.8 ms; Figs. 6C and 7C). This was also true when hypokalemic hearts were exposed to lidocaine: Both epicardial and endocardial latencies were significantly increased (26.3 ± 3.2 and 33.8 ± 1.3 ms, respectively) but Δlatency was not significantly altered (P > 0.05, 7.6 ± 3.4 ms). Again, transmural critical intervals were significantly decreased (P < 0.05) in both the epicardium (−12.8 ± 5.9 ms) and endocardium (−10.4 ± 1.7 ms; Figs. 6D and 7D).
Arrhythmogenesis occurs in the absence of significant alterations in the TDR
The analysis above thus established four critical intervals, which, when taken together, provided a clear prediction of arrhythmogenicity under these circumstances when changes in APD90 did not correspond to changes in VERP. In contrast, an analysis in terms of TDR, previously shown to predict arrhythmogenicity in both congenital and acquired forms of the LQTS [2], gave insufficiently sensitive predictions. TDR was calculated as the time between stimulation and 90% repolarization in the endocardium minus the time between stimulation and 90% repolarization in the epicardium. TDR values did not significantly alter with the presence or otherwise of arrhythmogenicity (Fig. 8). Thus, in normokalemic hearts (Fig. 8, A) epicardial repolarization time (67.6 ± 1.5 ms) was significantly shorter (P < 0.05) than endocardial repolarization time (77.6 ± 3.9 ms), giving a TDR of 10.0 ± 4.2 ms (n = 10; eight hearts). Epicardial and endocardial repolarization times, as well as the resulting TDR, remained unchanged under hypokalemic conditions (Fig. 8, B). Finally, although treatment with lidocaine significantly increased (P < 0.05) epicardial and endocardial repolarization times under both normokalemic (Fig. 8, C, to 86.1 ± 2.8 and 103.0 ± 7.0 ms, respectively, n = 6; five hearts) and hypokalemic (Fig. 8, D, to 86.9 ± 4.1 and 97.6 ± 6.6 ms, respectively, n = 5; five hearts) conditions, in neither case did it affect TDR.
Fig. 8.
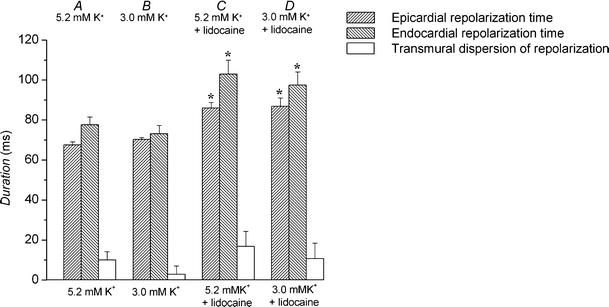
Changes in transmural dispersion of repolarization after exposure to hypokalemia and to lidocaine. Epicardial (up-sloping hashing) and endocardial (down-sloping hashing) stimulation to repolarization times, and the difference between these values giving transmural dispersion of repolarization (open bars) in hearts exposed to normokalemic (5.2 mM K+, A) and hypokalemic (3.0 mM K+, B) test solutions and normokalemic (C) and hypokalemic (D) test solutions containing lidocaine (10 μM) for 20 min. Asterisks indicate values that are significantly (P < 0.05) larger than those recorded in normokalemic hearts
These findings indicate that despite similarities, criteria that have been established to predict arrhythmogenicity in LQTS do not necessarily apply in hypokalemia. However, explicit inclusion of refractory behavior yields novel criteria, which may constitute more sensitive general predictors of arrhythmogenicity and may prove particularly useful in situations where APD90 diverges sharply from VERP. Further, these novel criteria provide a physiological basis for the participation of refractoriness in arrhythmogenicity.
Discussion
In clinical situations, hypokalemia is associated with arrhythmogenesis initiated by PVDs [52] and accompanied by prolongation of the electrocadiographic QT interval, reflecting increased action potential duration [23]. Furthermore, class 1 antiarrhythmic agents are effective in suppressing arrhythmic activity in hypokalemic patients [42]. These features thus resemble corresponding characteristics of the congenital LQTS [12, 41], where arrhythmic activity is thought to result from re-entrant excitation [2]. This has been attributed to the propagation of depolarization from active cells to previously active adjacent regions subsequently triggering spread of excitation and thus establishing re-entrant circuits [1, 3, 37].
We sought to study the physiological basis for the arrhythmogenicity observed under hypokalemic conditions, particularly the extent to which this resembles or differs from the corresponding features of LQTS, in intact isolated perfused murine hearts. Epicardial and endocardial MAPs were first recorded from hypokalemic hearts, confirming that stimulation at a regular interstimulus interval of 125 ms (S1 stimulation) resulted in stable rhythms. In contrast, at the long intrinsic cycle lengths occurring in the absence of extrinsic stimulation, frequent after-depolarizations were observed and were often followed by the initiation of an arrhythmic activity. This is consistent with the known proarrhythmic effect of bradycardia [10, 13, 46, 51]. Previous studies correlating results from single-cell and whole-heart preparations have attributed such after-depolarizations to inward currents flowing through reactivated voltage-operated Ca2+ channels [27, 35], Ca2+-coupled inward Na+ currents via the Na+–Ca2+ exchanger [47], or Ca2+-induced Ca2+-release from intracellular stores [26]. In the presence of the class 1b antiarrhythmic agent lidocaine, after-depolarizations persisted. These events were especially common in hearts where intrinsic cycle length was particularly long, again in agreement with the known proarrhythmic effect of bradycardia [10, 13, 46, 51]. However, in the presence of lidocaine, these events were never followed by the initiation of arrhythmic activity. Thus, the experiments demonstrated that hypokalemic murine hearts showed arrhythmogenic properties in agreement with clinical findings and established conditions in which arrhythmogenicity was and was not observed.
A quantitative assessment of MAP waveforms and refractory characteristics associated with this arrhythmogenicity was then performed using an extrasystolic stimulation (S2) procedure previously established in the assessment of arrhythmogenicity in both clinical [43] and murine [22] studies of LQTS. S2 stimulation reproducing the effect of after-depolarizations immediately after recovery from refractoriness failed to initiate arrhythmic activity in normokalemic hearts. However, such stimulation consistently resulted in arrhythmic activity in hypokalemic hearts. This is in agreement with previous reports that after-depolarizations and S2 stimulation early during action potential repolarization are particularly arrhythmogenic [14, 38] and also parallels clinical observations that PVDs coincident with T-waves frequently initiate arrhythmic activity [48]. In contrast, S2 stimuli did not elicit arrhythmic activity in lidocaine-treated hearts, whether studied under normokalemic or hypokalemic conditions. These are consistent with after-depolarizations having occurred late in action potential repolarization, and thence, failing to initiate arrhythmic activity.
Previous studies in murine [30], canine [15], and human [31] ventricles have consistently reported that maneuvers, which alter action potential duration, also produce corresponding changes in refractory period, with the notable exception of exposure to class 1 antiarrhythmic drugs [39]. However, the effect of isolated reduction in [K+]o on these parameters has not been studied. Exploration of the effect of varying S1S2 interval demonstrated for the first time that although action potential duration (quantified at 90% repolarization, APD90) was increased in hypokalemia, VERP was decreased. Furthermore, exposure to lidocaine had no effect on APD90 in the epicardia or endocardia of normokalemic hearts and significantly increased APD90 only in the endocardia of hypokalemic hearts, despite significantly increasing VERP in all cases. Thus, the proarrhythmic effect of hypokalemia was associated with recovery from refractoriness occurring earlier in action potential repolarization, whereas the antiarrhythmic effect of lidocaine was associated with recovery from refractoriness occurring later in action potential repolarization.
Reduction of [K+]o might be expected to increase outward K+ currents and thereby decrease APD90. Indeed, computer modeling of single ventricular myocytes confirmed that reduction of [K+]o per se resulted in decreased APD90. Furthermore, the Nernst equation would predict that reduction of [K+]o should hyperpolarize the resting membrane potential, thereby increasing the proportion of sodium channels available for activation [19] and decreasing the VERP: our model replicated this effect. However, incorporation of recent data from our group demonstrating that reduction of [K+]o decreases the repolarizing K+ currents IK1 and Ito [29] resulted in VERP returning to its normokalemic value and APD90 being increased beyond its normokalemic value. Thus, although reduction in K+ permeability compensates for the change in VERP, it overcompensates for the change in APD90, rendering the APD90 longer than the VERP, in fitting with experimental results and with the proarrhythmic effect of hypokalemia. Previous studies have reported that although exposure to lidocaine increases VERP through an effect on the gating of fast Na+-channels [32, 34], it has a proportionately smaller effect on action potential duration [5]. Exposure to lidocaine is thus established to result in postrepolarization refractoriness [39], in fitting with experimental results and with the antiarrhythmic effect of lidocaine.
We then applied an analytical scheme to provide a simple physiological explanation for these findings. Subject to electrotonic coupling between cells [25], the simplest condition for local re-excitation between adjacent cells within either epicardium or endocardium would require membrane potential to exceed threshold at some point during action potential repolarization, the recovery of membrane potential lagging behind the recovery of excitability. Recovery of excitability was approximated by the VERP, measured using a standard stimulus of consistent amplitude and duration. Recovery of membrane potential was approximated by the action potential duration at 90% repolarization (APD90). Accordingly, APD90−VERP gives a critical interval that reflects tendency towards local re-excitation and arrhythmogenicity. Positive shifts in this interval would reflect a relatively proarrhythmic state, whereas negative shifts in this interval would reflect an antiarrhythmic state. The corresponding analytical condition for transmural re-excitation across the thickness of the myocardial wall with a transmural conduction time given by Δlatency [40] yields transmural critical intervals of (endocardial APD90 + Δlatency−epicardial VERP) for the epicardium and (epicardial APD90 + Δlatency−endocardial VERP) for the endocardium, again subject to electrotonic spread of current between cells [25]. Although exposure to lidocaine increased both epicardial and endocardial stimulation to depolarization latencies, attributable to its established effect on conduction velocity [8], it had no significant effect on Δlatency. Hypokalemia resulted in significant positive shifts in the magnitude of all four critical intervals, whereas exposure to lidocaine resulted in significant negative shifts, in precise agreement with the presence or absence of arrhythmogenicity. Modelling of single ventricular myocytes predicted shorter APD90s than were recorded from whole-heart preparations, in agreement with previous experimental observations in such single-cell preparations [7, 20, 30]. Nevertheless, hypokalemia when similarly modeled for such single-cell preparations resulted in a positive shift in critical interval, in common with our experimental observations from whole hearts.
Although changes in all four critical intervals correlated with arrhythmogenicity, TDR, previously shown to predict arrhythmogenicity in LQTS [36, 44, 45], proved an insufficiently sensitive predictor. This finding may be attributable to sharp differences between APD90 and VERP: it is possible that APD90 and VERP were in close agreement in previous studies on LQTS [49, 50]. In the latter event, the present analysis would have yielded identical results to one adopting TDR.
Thus, we establish for the first time that hypokalemia decreases VERP despite increasing APD90 and attribute this surprising finding to effects of reduced [K+]o on ion channel gating. Secondly, we establish novel indices incorporating VERP as general criteria for re-entrant arrhythmogenicity that additionally provide a physiological basis for the association between changes in epicardial and endocardial VERP and APD90 and susceptibility to arrhythmogenesis. Thirdly, we establish that such analyses provide more sensitive indications of arrhythmogenicity than previous analyses invoking TDR.
Acknowledgements
We thank the James Baird Fund, the Frank Elmore Fund, the Medical Research Council, the Wellcome Trust and the British Heart Foundation for their generous support. JAF holds a Research Fellowship at Gonville & Caius College, Cambridge and gratefully acknowledges the technical assistance of Bruce Beckles and the PWF Condor service run by the University of Cambridge.
References
- 1.Antzelevitch C, Jalife J, Moe GK (1980) Characteristics of reflection as a mechanism of reentrant arrhythmias and its relationship to parasystole. Circulation 61:182–191 [DOI] [PubMed]
- 2.Antzelevitch C, Oliva A (2006) Amplification of spatial dispersion of repolarization underlies sudden cardiac death associated with catecholaminergic polymorphic VT, long QT, short QT and Brugada syndromes. J Intern Med 259:48–58 [DOI] [PMC free article] [PubMed]
- 3.Antzelevitch C, Yan GX, Shimizu W (1999) Transmural dispersion of repolarization and arrhythmogenicity: the Brugada syndrome versus the long QT syndrome. J Electrocardiol 32(Suppl):158–165 [DOI] [PubMed]
- 4.Balasubramaniam R, Grace AA, Saumarez RC, Vandenberg JI, Huang CL (2003) Electrogram prolongation and nifedipine-suppressible ventricular arrhythmias in mice following targeted disruption of KCNE1. J Physiol 552:535–546 [DOI] [PMC free article] [PubMed]
- 5.Bigger JT Jr, Mandel WJ (1970) Effect of lidocaine on the electrophysiological properties of ventricular muscle and purkinje fibers. J Clin Invest 49:63–77 [DOI] [PMC free article] [PubMed]
- 6.Bondarenko VE, Szigeti GP, Bett GC, Kim SJ, Rasmusson RL (2004) Computer model of action potential of mouse ventricular myocytes. Am J Physiol Heart Circ Physiol 287:H1378–H1403 [DOI] [PubMed]
- 7.Brunet S, Aimond F, Li H, Guo W, Eldstrom J, Fedida D, Yamada KA, Nerbonne JM (2004) Heterogeneous expression of repolarizing, voltage-gated K+ currents in adult mouse ventricles. J Physiol 559:103–120 [DOI] [PMC free article] [PubMed]
- 8.Carmeliet E, Zaman MY (1979) Comparative effects of lignocaine and lorcainide on conduction in the Langendorff-perfused guinea-pig heart. Cardiovasc Res 13:439–449 [DOI] [PubMed]
- 9.Casimiro MC, Knollmann BC, Ebert SN, Vary JC Jr, Greene AE, Franz MR, Grinberg A, Huang SP, Pfeifer K (2001) Targeted disruption of the Kcnq1 gene produces a mouse model of Jervell and Lange-Nielsen Syndrome. Proc Natl Acad Sci USA 98:2526–2531 [DOI] [PMC free article] [PubMed]
- 10.Davy JM, Weissenburger J, Ertzbischoff O, Lainee P, Chezalviel F, Poirier JM, Cheymol G, Motte G (1988) [Sotalol-induced torsades de pointe in the conscious dog with atrioventricular block. Role of hypokalemia]. Arch Mal Coeur Vaiss 81:1117–1124 [PubMed]
- 11.Eckardt L, Haverkamp W, Borggrefe M, Breithardt G (1998) Experimental models of torsade de pointes. Cardiovasc Res 39:178–193 [DOI] [PubMed]
- 12.El-Sherif N, Myerburg RJ, Scherlag BJ, Befeler B, Aranda JM, Castellanos A, Lazzara R (1976) Electrocardiographic antecedents of primary ventricular fibrillation. Value of the R-on-T phenomenon in myocardial infarction. Br Heart J 38:415–422 [DOI] [PMC free article] [PubMed]
- 13.El-Sherif N, Zeiler RH, Craelius W, Gough WB, Henkin R (1988) QTU prolongation and polymorphic ventricular tachyarrhythmias due to bradycardia-dependent early afterdepolarizations. Afterdepolarizations and ventricular arrhythmias. Circ Res 63:286–305 [DOI] [PubMed]
- 14.Fozzard HA (1986) The heart and cardiovascular system: scientific foundations. Raven, New York
- 15.Franz MR, Chin MC, Sharkey HR, Griffin JC, Scheinman MM (1990) A new single catheter technique for simultaneous measurement of action potential duration and refractory period in vivo. J Am Coll Cardiol 16:878–886 [DOI] [PubMed]
- 16.Fraser JA, Huang CL (2004) A quantitative analysis of cell volume and resting potential determination and regulation in excitable cells. J Physiol 559:459–478 [DOI] [PMC free article] [PubMed]
- 17.Fraser JA, Huang CL (2007) Quantitative techniques for steady-state calculation and dynamic integrated modelling of membrane potential and intracellular ion concentrations. Prog Biophys Mol Biol (in press). DOI 10.1016/j.pbiomolbio.2006.1010.1001 [DOI] [PubMed]
- 18.Fraser JA, Rang CE, Usher-Smith JA, Huang CL (2005) Slow volume transients in amphibian skeletal muscle fibres studied in hypotonic solutions. J Physiol 564:51–63 [DOI] [PMC free article] [PubMed]
- 19.Gettes LS, Reuter H (1974) Slow recovery from inactivation of inward currents in mammalian myocardial fibres. J Physiol 240:703–724 [DOI] [PMC free article] [PubMed]
- 20.Guo W, Xu H, London B, Nerbonne JM (1999) Molecular basis of transient outward K+ current diversity in mouse ventricular myocytes. J Physiol 521(Pt 3):587–599 [DOI] [PMC free article] [PubMed]
- 21.Han J, Moe GK (1964) Nonuniform recovery of excitability in ventricular muscle. Circ Res 14:44–60 [DOI] [PubMed]
- 22.Head CE, Balasubramaniam R, Thomas G, Goddard CA, Lei M, Colledge WH, Grace AA, Huang CL (2005) Paced electrogram fractionation analysis of arrhythmogenic tendency in ΔKPQ Scn5a mice. J Cardiovasc Electrophysiol 16:1329–1340 [DOI] [PubMed]
- 23.Helfant RH (1986) Hypokalemia and arrhythmias. Am J Med 80:13–22 [DOI] [PubMed]
- 24.Hernandez J, Fischbarg J, Liebovitch LS (1989) Kinetic model of the effects of electrogenic enzymes on the membrane potential. J Theor Biol 137:113–125 [DOI] [PubMed]
- 25.Jack JJB, Noble D, Tsien RW (1975) Electric current flow in excitable cells. Clarendon Press, Oxford
- 26.Janiak R, Lewartowski B (1996) Early after-depolarisations induced by noradrenaline may be initiated by calcium released from sarcoplasmic reticulum. Mol Cell Biochem 163–164:125–130 [DOI] [PubMed]
- 27.January CT, Gong Q, Zhou Z (2000) Long QT syndrome: cellular basis and arrhythmia mechanism in LQT2. J Cardiovasc Electrophysiol 11:1413–1418 [DOI] [PubMed]
- 28.Josephson ME, Caracta AR, Lau SH, Gallagher JJ, Damato AN (1972) Effects of lidocaine on refractory periods in man. Am Heart J 84:778–786 [DOI] [PubMed]
- 29.Killeen MJ, Thomas G, Gurung IS, Goddard CA, Fraser JA, Mahaut-Smith MP, Colledge WH, Grace AA, Huang CL (2007) Arrhythmogenic mechanisms in the isolated perfused hypokalaemic murine heart. Acta Physiologica 189(1):33–46 [DOI] [PMC free article] [PubMed]
- 30.Knollmann BC, Katchman AN, Franz MR (2001) Monophasic action potential recordings from intact mouse heart: validation, regional heterogeneity, and relation to refractoriness. J Cardiovasc Electrophysiol 12:1286–1294 [DOI] [PubMed]
- 31.Koller BS, Karasik PE, Solomon AJ, Franz MR (1995) Relation between repolarization and refractoriness during programmed electrical stimulation in the human right ventricle. Implications for ventricular tachycardia induction. Circulation 91:2378–2384 [DOI] [PubMed]
- 32.Leuwer M, Haeseler G, Hecker H, Bufler J, Dengler R, Aronson JK (2004) An improved model for the binding of lidocaine and structurally related local anaesthetics to fast-inactivated voltage-operated sodium channels, showing evidence of cooperativity. Br J Pharmacol 141:47–54 [DOI] [PMC free article] [PubMed]
- 33.Lubinski A, Lewicka-Nowak E, Kempa M, Baczynska AM, Romanowska I, Swiatecka G (1998) New insight into repolarization abnormalities in patients with congenital long QT syndrome: the increased transmural dispersion of repolarization. Pacing Clin Electrophysiol 21:172–175 [DOI] [PubMed]
- 34.Martins JB, Kelly KJ (1985) Prolongation of refractoriness and activation time in normal canine ventricular myocardium following bolus administration of lidocaine. Am Heart J 109:533–539 [DOI] [PubMed]
- 35.Milberg P, Eckardt L, Bruns HJ, Biertz J, Ramtin S, Reinsch N, Fleischer D, Kirchhof P, Fabritz L, Breithardt G, Haverkamp W (2002) Divergent proarrhythmic potential of macrolide antibiotics despite similar QT prolongation: fast phase 3 repolarization prevents early afterdepolarizations and torsade de pointes. J Pharmacol Exp Ther 303:218–225 [DOI] [PubMed]
- 36.Milberg P, Reinsch N, Wasmer K, Monnig G, Stypmann J, Osada N, Breithardt G, Haverkamp W, Eckardt L (2005) Transmural dispersion of repolarization as a key factor of arrhythmogenicity in a novel intact heart model of LQT3. Cardiovasc Res 65:397–404 [DOI] [PubMed]
- 37.Moe GK, Rheinboldt WC, Abildskov JA (1964) A computer model of atrial fibrillation. Am Heart J 67:200–220 [DOI] [PubMed]
- 38.Naito M, Michelson EL, Kaplinsky E, Dreifus LS, David D, Blenko TM (1982) Role of early cycle ventricular extrasystoles in initiation of ventricular tachycardia and fibrillation: evaluation of the R on T phenomenon during acute ischemia in a canine model. Am J Cardiol 49:317–322 [DOI] [PubMed]
- 39.Nakaya Y, Nii H, Nomura M, Fujino K, Mori H (1989) Effects of lidocaine and quinidine on post-repolarization refractoriness after the basic and premature action potentials: consideration of aim of antiarrhythmic drug therapy. Am Heart J 118:907–912 [DOI] [PubMed]
- 40.Noble D (1979) The initiation of the heartbeat. Clarendon Press, Oxford, NY
- 41.Noda T, Shimizu W, Satomi K, Suyama K, Kurita T, Aihara N, Kamakura S (2004) Classification and mechanism of Torsade de Pointes initiation in patients with congenital long QT syndrome. Eur Heart J 25:2149–2154 [DOI] [PubMed]
- 42.Rehnqvist N, Ericsson CG, Eriksson S, Olsson G, Svensson G (1984) Comparative investigation of the antiarrhythmic effect of propafenone (Rytmonorm) and lidocaine in patients with ventricular arrhythmias during acute myocardial infarction. Acta Med Scand 216:525–530 [DOI] [PubMed]
- 43.Saumarez RC, Pytkowski M, Sterlinski M, Hauer RN, Derksen R, Lowe MD, Szwed H, Huang CL, Ward DE, Camm AJ, Grace AA (2006) Delayed paced ventricular activation in the long QT syndrome is associated with ventricular fibrillation. Heart Rhythm 3:771–778 [DOI] [PubMed]
- 44.Shimizu W, Antzelevitch C (1997) Sodium channel block with mexiletine is effective in reducing dispersion of repolarization and preventing torsade des pointes in LQT2 and LQT3 models of the long-QT syndrome. Circulation 96:2038–2047 [DOI] [PubMed]
- 45.Shimizu W, Antzelevitch C (1998) Cellular basis for the ECG features of the LQT1 form of the long-QT syndrome: effects of beta-adrenergic agonists and antagonists and sodium channel blockers on transmural dispersion of repolarization and torsade de pointes. Circulation 98:2314–2322 [DOI] [PubMed]
- 46.Shimizu W, Tanaka K, Suenaga K, Wakamoto A (1991) Bradycardia-dependent early afterdepolarizations in a patient with QTU prolongation and torsade de pointes in association with marked bradycardia and hypokalemia. Pacing Clin Electrophysiol 14:1105–1111 [DOI] [PubMed]
- 47.Sipido KR, Volders PG, de Groot SH, Verdonck F, Van de Werf F, Wellens HJ, Vos MA (2000) Enhanced Ca2+ release and Na/Ca exchange activity in hypertrophied canine ventricular myocytes: potential link between contractile adaptation and arrhythmogenesis. Circulation 102:2137–2144 [DOI] [PubMed]
- 48.Smirk FH (1949) R waves interrupting T waves. Br Heart J 11:23–26 [DOI] [PMC free article] [PubMed]
- 49.Thomas G, Gurung IS, Killeen MJ, Hakim P, Goddard CA, Mahaut-Smith MP, Colledge WH, Grace AA, Huang CL (2006) Effects of L-type Ca2+ channel antagonism on ventricular arrhythmogenesis in {Δ}KPQ Scn5a (long QT 3) murine hearts. J Physiol 578(Pt 1):85–97 [DOI] [PMC free article] [PubMed]
- 50.Thomas G, Killeen MJ, Gurung IS, Hakim P, Balasubramaniam RN, Goddard CA, Grace AA, Huang CL (2007) Mechanisms of ventricular arrhythmogenesis in mice following targeted disruption of KCNE1 long QT syndrome 5. J Physiol 578(Pt 1):99–114 [DOI] [PMC free article] [PubMed]
- 51.Vos MA, Verduyn SC, Gorgels AP, Lipcsei GC, Wellens HJ (1995) Reproducible induction of early afterdepolarizations and torsade de pointes arrhythmias by d-sotalol and pacing in dogs with chronic atrioventricular block. Circulation 91:864–872 [DOI] [PubMed]
- 52.Whelton PK (1984) Diuretics and arrhythmias in the Medical Research Council trial. Drugs 28(Suppl 1):54–65 [DOI] [PubMed]
- 53.Yamaguchi M, Shimizu M, Ino H, Terai H, Uchiyama K, Oe K, Mabuchi T, Konno T, Kaneda T, Mabuchi H (2003) T wave peak-to-end interval and QT dispersion in acquired long QT syndrome: a new index for arrhythmogenicity. Clin Sci 105:671–676 [DOI] [PubMed]
- 54.Yan G-X, Antzelevitch C (1998) Cellular basis for the normal T wave and the electrocardiographic manifestations of the long-QT syndrome. Circulation 98:1928–1936 [DOI] [PubMed]


