
Fig.4.
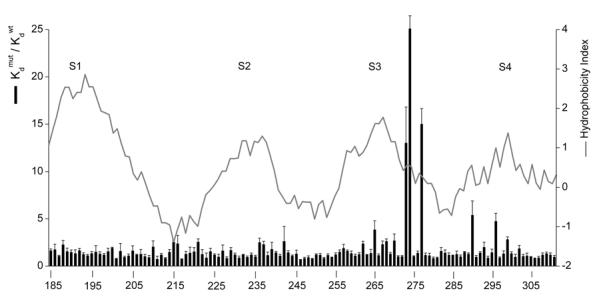
The hanatoxin receptor within Kv2.1 channels.
Bar graph plots the normalized hanatoxin Kd for each mutation spanning from K185 in S1 to T311 in S4. Data were taken from (Swartz and MacKinnon, 1997b) and (Li-Smerin and Swartz, 2000). Most residues were mutated to Ala, except for the native Ala residues which were mutated to Tyr. Solid line superimposed on the bar graph is a 17-residue window analysis of the Kyte-Doolittle hydrophobicity index (Kyte and Doolittle, 1982).