

Abstract
The central component that establishes chronic pain from peripheral nerve injury is associated with increased tumor necrosis factor-α (TNFα) production in the brain. This study examined TNFα and its reciprocally permissive role with α2-adrenergic activation during peak and progressive decline of thermal hyperalgesia in sciatic nerve chronic constriction injury (CCI). Accumulation of TNFα mRNA (in situ hybridization) increases in the hippocampus and locus coeruleus during the onset of neuropathic pain and persists as hyperalgesia abates. Activation of α2-adrenergic receptors in control rats decreases TNFα mRNA accumulation in these brain regions. In contrast, during hyperalgesia, α2-adrenergic activation enhances TNFα mRNA accumulation. Whether this enhanced TNFα production is associated with changes in the regulation of norepinephrine (NE) release was tested. Hippocampal slices were electrically depolarized to evaluate α2-adrenergic and TNFα regulation of NE release. While inhibition of NE release by TNFα is maximal during peak hyperalgesia, it subsequently transforms to facilitate NE release. In addition, α2-adrenergic receptor activation with clonidine (0.2 mg/kg, i.p.) in CCI rats experiencing hyperalgesia restores TNFα and α2-adrenergic inhibition of NE release. While TNFα directs the development of hyperalgesia, it also directs its resolution. Transformed sensitivity to α2-adrenergic agonists during hyperalgesia demonstrates a mechanism for therapy.
Keywords: Neuropathic pain, Tumor necrosis factor-α, Hyperalgesia, α2-Adrenergic receptor, Norepinephrine, In situ hybridization
1. Introduction
The prototypical α2-adrenergic agonist clonidine is widely known to elicit antinociception in experimental models of pain (Dennis et al., 1980; Kayser et al., 1992; Paalzow, 1974; Pertovaara, 1993; Reddy et al., 1980; Tasker and Melzack, 1989; Yaksh, 1985). However, its clinical applications are limited due to side-effects such as sedation, sympatholysis, and anxiolysis (Eisenach et al., 1996; Kawamata et al., 1997; Lakhlani et al., 1997; Martin and Eisenach, 2001). On the other hand, tricyclic antidepressants, devoid of these side-effects, are commonly used to treat chronic pain (Korzeniewska-Rybicka and Plaznik, 1998; Max, 1994; McQuay et al., 1996; Otsuka et al., 2001; Tura and Tura, 1990). Recently, we elucidated an antinociceptive mechanism for tricyclic antidepressants involving α2-adrenergic receptor regulation of both tumor necrosis factor-α (TNFα) production and norepinephrine (NE) release (Ignatowski et al., 2005).
The release of NE in the brain is continuously regulated by TNFα, which is expressed in neurons (Ignatowski et al., 1996; Ignatowski et al., 1997; Ignatowski and Spengler, 1994). TNFα inhibits NE release in the hippocampus of naïve rats (Covey et al., 2000; Ignatowski and Spengler, 1994; Nickola et al., 2001). Enhanced production of this cytokine in noradrenergic brain regions, the hippocampus and locus coeruleus, occurs during the development of centrally-mediated, neuropathic pain (Covey et al., 2000). A characteristic symptom of neuropathic pain is hyperalgesia, or increased sensitivity to a noxious stimulus. During peak hyperalgesia, TNFα-inhibition of NE release in those hippocampi is significantly enhanced (Covey et al., 2000). Blockade of TNFα activity in the brain during the development of hyperalgesia completely alleviates hyperalgesia (Ignatowski et al., 1999). Interestingly, blockade of TNFα activity in the brains of naïve rats facilitates NE release (Reynolds et al., 2004b). Similar to TNFα, during peak hyperalgesia, the α2-adrenergic receptor that inhibits NE release (Dixon et al., 1979; Langer, 1981) is supersensitized (Covey et al., 2000). Therefore, two diverse mediators, TNFα and α2-adrenergic agonists (i.e., NE) share a common function, regulation of NE release. It is their interactive relationship that directs the release of NE in the brain (Covey et al., 2000; Ignatowski and Spengler, 1994; Reynolds et al., 2005a). Therefore, the hippocampus was investigated since it is replete with α2-adrenergic receptors (Scheinin et al., 1994) that inhibit NE release (Kiss et al., 1995). The hippocampus is also involved in processing painful stimuli and regulating mood states (Delgado, 1954; Dutar et al., 1985; Khanna and Sinclair, 1989; McEwen, 2001; McKenna and Melzack, 1992). Furthermore, tricyclic antidepressant drugs (desipramine, amitriptyline, zimelidine) elicit neuroplastic changes in the regulation of NE release from the hippocampus following i.p. administration to animals within time frames corresponding to the therapeutic analgesic and/or antidepressant effectiveness of these drugs (Ignatowski et al., 1996, 2005; Ignatowski and Spengler, 1994; Nickola et al., 2001). Taken together, these findings make the hippocampus a likely region for which attention should be focused for understanding fundamental mechanisms associated with the development, dissipation, and treatment of pain.
The resolution of hyperalgesia begins at 14–28 days post sciatic nerve chronic constriction injury (CCI) (Attal et al., 1990; Bennett and Xie, 1988; Covey et al., 2000; Ignatowski et al., 1999). The increased levels of TNFα in noradrenergic regions gradually decrease coincident with dissipation of hyperalgesia, returning to pre-CCI values at resolution of hyperalgesia (Covey et al., 2000; Covey et al., 2002). During the resolution of hyperalgesia, TNFα facilitates NE release in the brain counteracting the enhanced decrease in NE release by TNFα during development of hyperalgesia (Ignatowski et al., 2005). An interactive relationship occurs between inhibition of NE release by TNFα and α2-adrenergic agonists, and these responses transform such that both facilitate NE release during the resolution of neuropathic pain. In the present study, we tested the hypothesis that activation of the α2-adrenergic receptor, which directs TNFα production in the brain (Ignatowski et al., 1996; Nickola et al., 2000), re-establishes normal neuron functioning by treating rats undergoing neuropathic pain with the selective α2-adrenergic agonist, clonidine. Accumulation of mRNA for TNFα in noradrenergic brain regions (hippocampus and locus coeruleus) as well as TNFα and α2-adrenergic regulation of electrically-stimulated NE release from the hippocampus were assessed.
2. Materials and Methods
2.1. Animals
Male, Sprague-Dawley rats (Harlan Sprague Dawley Inc., Indianapolis, IN) initially weighing 180–230g were used for all experiments. The rats were housed in groups of three to five animals at 23 ± 1°C in Laboratory Animal Facility-accredited pathogen-free quarters with access to food and water ad libitum. The animals were maintained on a 12 hr light/dark cycle, with the lights on from 0600 – 1800 hr. Rats received four days to acclimate to the animal room before testing. Experiments were carried out in accordance with protocols approved by the Institutional Animal Care and Use Committee of The University at Buffalo as well as with the guidelines for the ethical treatment of animals established by the National Institutes of Health. All efforts were made to ensure minimal animal suffering, as well as to use only the number of animals necessary to achieve statistical results.
2.2. Chronic constriction injury (CCI)
Loose ligatures were applied around the common sciatic nerve leading to the right hind paw according to described methods (Bennett and Xie, 1988). Briefly, rats were anesthetized with ketamine (60 mg/kg) and xylazine (3 mg/kg) intraperitoneally (i.p.) prior to surgery. The sciatic nerve was exposed unilaterally, and four ligatures (4.0 chromic gut, Roboz Surgical Instrument Co., Inc., Rockville, MD) were placed around the nerve, ~1 mm apart, proximal to the trifurcation. Ligatures were tied such that constriction to the diameter of the nerve was barely discernable, allowing for uninterrupted circulation through the epineural vasculature. In sham procedures, the nerve was similarly exposed and freed of adherent tissue/muscle, but no ligatures were placed. The incisions were closed with surgical clips. All surgeries were performed between 0800–1200 hr.
2.3. Thermal hyperalgesia measurement
At specified times after application of ligatures or sham surgery, the thermal nociceptive threshold was measured in each hind paw. Hyperalgesia (increased sensitivity to sensory stimuli) was measured by determining changes in paw withdrawal latency (PWL) using a plantar algesia apparatus (model #33, Analgesia Meter, IITC Life Science Instruments, Woodland Hills, CA) (Hargreaves et al., 1988). A “difference score” generated from subtracting the contralateral PWL from the ipsilateral PWL was used as an index of hyperalgesia. PWL was measured using a radiant heat source (58 ± 0.1°C) to stimulate thermal receptors in the foot. The use of this apparatus is based on the fact that an injury to a peripheral nerve ultimately results in increased sensitivity to a sensory (thermal) stimulus. A maximal automatic cut-off latency of 15 sec was used to prevent tissue damage. Rats were placed in one of four Plexiglas chambers, on top of a temperature maintained (32 ± 0.1°C) glass surface. Rats were acclimated to the testing apparatus for 7–10 min (when exploratory behavior ceased), and measurements of the thermal withdrawal threshold were taken for each hind paw. Baseline latencies were determined before experimental treatment for all animals as the mean of three separate trials, taken one and two days pre-surgery and on the day of surgery (day 0). Only rapid hind paw movements away from the thermal stimulus (with or without licking of hind paw) were considered as a withdrawal response. Paw movements associated with weight shifting or locomotion were not counted. Each hind paw was measured three times at 4 min intervals, and the averaged values for each day were used to compute thermal hyperalgesia (ipsilateral PWL – contralateral PWL). All measurements were recorded between 0630–0800 hr. Since the apparatus houses four rats, only eight rats were tested per day.
2.4. In vitro superfusion
Procedures were according to methods we have previously described (Ignatowski et al., 1997). Briefly, regions of brains from rats sacrificed by decapitation were isolated on ice, and 0.4 mm thick transverse slices of hippocampi were prepared (McIlwain Tissue Chopper, The Mickle Laboratory Engineering Co. Ltd., Goose Green, UK). The slices were placed in ice-cold Krebs physiological buffer solution of the following composition (mM): NaCl 118, KCl 4.8, CaCl2 1.3, KH2PO4 1.2, MgSO4 1.2, NaHCO3 25, glucose 10, ascorbic acid 0.06, and EDTA 0.03 (Sigma-Aldrich, St. Louis, MO). The slices were preincubated in Krebs buffer for 10 min at 37°C, saturated with 95% O2/5% CO2 (Strate Welding, Buffalo, NY). At the end of the preincubation, [3H]-NE (levo-[ring-2,5,6,-3H]-; Perkin Elmer, Boston, MA; specific activity 57.3 Ci/mmol) was added to a final concentration of 330 nM (concentration chosen for NE uptake-1 site), and the slices were incubated for an additional 15 min. The slices were transferred to six 0.1-ml superfusion chambers (one slice per chamber) (Brandel, Gaithersberg, MD). Each slice was positioned between two nylon mesh disks placed between two mesh platinum electrodes designed to stimulate nerve endings (field stimulation). Each tissue slice was superfused at a constant rate of 0.5 ml/min to ensure that the changes observed in radioactivity were actually changes in tissue overflow. The slices were superfused with fresh Krebs buffer for 30 min prior to the onset of consecutive field stimulations in order to wash away excess (non-specific) [3H]-NE.
Neuron release of [3H]-NE was studied by applying nine consecutive field stimulations (2 mins) consisting of trains of squarewave pulses (2 ms duration, 26 V) every 16 minutes at increasing frequencies of 0.5, 0.5, 1, 2, 4, 6, 8, 12, and 16 Hz for each experiment. After baseline response of [3H]-NE release (the first 0.5 Hz stimulation), and during each subsequent stimulation, four experimental slices were superfused with solutions containing either recombinant murine TNFα (rmTNFα, 10 ng/ml, R&D Systems, Minneapolis, MN) (two experimental chambers) or the α2-adrenergic agonist, UK-14,304 (10−8 M, Sigma-Aldrich) (two additional experimental chambers). UK-14,304 or rmTNFα was added to the Krebs buffer 16 min before the second 0.5 Hz stimulation to assess their effect on the cumulative frequency-response of neurons. Two control chambers were perfused with Krebs buffer alone. Aliquots of the superfusate (2 ml) were collected at 4 min intervals, 1 ml from each collected sample was withdrawn, and 4 ml of Ultima Gold scintillation cocktail (Packard Instrument Co., Meriden, CT) was added to the remaining 1 ml of sample. Immediately following the last fraction collected, each tissue slice was removed from its chamber and solubilized in 0.2 ml 1 N NaOH. The labeled amine that was released in excess of the spontaneous efflux of tritium was greater than 90% unmetabolized [3H]-NE when separated on Dowex columns. The stimulation-evoked release of [3H]-NE was calculated as the percent release of the total [3H] pool in the tissue at the time of stimulation in excess of spontaneous efflux. Complete frequency-response curves for [3H]-NE release were determined alone or for the response to either rmTNFα or UK-14,304. The EF50 values (frequency that achieved 50% of the maximum response) for frequency-response curves were obtained by using non-linear least squares regression to fit a curve (SigmaPlot, SPSS Inc., Chicago, IL). It should be noted that the curves graphed in each figure represent the average of individual curves in respective experiments. However, EF50 values reported in the Results Section were calculated using SigmaPlot, and represent averaged values based on the individual curves.
2.5. In situ hybridization
In situ hybridization was performed using a modification of a method by Kunkel et al. (1988). The brainstem was isolated from control rats, rats undergoing CCI and sham-operated rats; the tissue was immediately snap-frozen in liquid nitrogen. This area consists of a section of brainstem 1 mm thick, which is medial and inferior to the superior cerebellar peduncle, superior to the nucleus of the Vth cranial nerve, and contains the nucleus locus coeruleus. This region was located using morphologic landmarks as described by Paxinos and Watson (1996), (Bregma: −9.68 mm, lateral: +1.5 mm, vertical −7.5 mm). Frozen tissue sections (4 μm thickness) were prepared on a cryostat, and mounted onto poly-L-lysine (Sigma-Aldrich) coated slides. Mounted sections were immediately fixed in ice cold 4% paraformaldehyde (Sigma-Aldrich) in 1x PBS for 15 min. Tissue sections were then rinsed three times in ice cold 70% ethanol, and stored in 70% ethanol at 4°C. At the time of hybridization, sections were post-fixed in 4% paraformaldehyde in PBS at room temperature for 10 min, washed in 0.5x SSC at room temperature for 10 min, and pretreated with 5 μg/ml proteinase K (Promega, Madison, WI) in 2x SSC at 37°C for 15 min. Sections were rinsed with 2x SSC, and acetylated with freshly prepared 0.5% acetic anhydride (Sigma-Aldrich) in 0.1 M TEA (Sigma-Aldrich) (pH 7.2) for 5 min. Sections were rinsed again in 0.5x SSC, and then covered with a prehybridization buffer consisting of 20% deionized formamide, 5x SSC, 5% dextran sulfate, 10 μg/ml tRNA, 100 μg/ml salmon sperm DNA, 1x Denhardt’s solution (all from Sigma-Aldrich), and 10 mM DTT (Boehringer Mannheim, Indianapolis, IN). Sections were incubated with the prehybridization buffer at 42°C for 2 hr. An antisense 30-mer cDNA oligonucleotide probe (5’-GTC-CCC-CTT-CTC-CAG-CTG-GAA-GAC-TCC-TCC-3’) complementary to mRNA specific for TNFα was labeled with 35S-dCTP (NEN, Boston, MA), using a protocol by Elner et al. (1991). The probe was diluted in hybridization buffer such that the final activity contained within the buffer was 1 x 10⁶ bound cpm/100 μl. Each tissue section was covered with 100 μl hybridization buffer, and hybridized overnight at 42°C. After hybridization, sections were washed twice with 2x SSC at room temperature for 10 min to remove non-adherent radioactivity, then washed with 1x SSC at 42°C for 60 min. Sections were dehydrated in graded concentrations of ethanol (50%, 70%, 95%) with 0.3% ammonium acetate (Sigma-Aldrich) and then air dried. Slides were coated in NTB-2 emulsion (Eastman Kodak, Rochester, NY), dried, placed in lightproof boxes and exposed for 10 weeks at 4°C. Slides were developed with Kodak D-19 developer (1:1 ddH20), and fixed with Kodak Rapid Fix Solution A. Tissue sections were counterstained with hematoxylin and eosin. Controls run in parallel with experimental sections include sections hybridized with unlabeled oligonucleotide probe, with a complementary sense cDNA oligonucleotide probe for TNFα, or with an oligonucleotide probe to detect mRNA specific to β-actin mRNA.
Computer-aided grain counting was performed on digitized sections obtained under bright-field conditions using a digital camera (Pixera 600ES-CU) attached to a Zeiss Axiovert 35 microscope (West Germany) and using imaging device Viewfinder (version 3.0.1; Pixera Corp.) and Studio (version 3.0.1; Pixera Corp.) software. All image analyses were performed by the same observer who was not aware of the treatment group. The cross-sectional area of each of five neurons per section (30 neurons total per region) was outlined, and the number of grains above each outlined cell was determined using a threshold algorithm with Image J Analysis software (ImageJ 1.32j; National Institutes of Health, Bethesda, MD, USA; http://rsb.info.nih.gov/ij/). Measurements are expressed as estimated number of silver grains per cell. The neuron phenotype of analyzed cells was verified by hematoxylin and eosin staining and recognized by morphological characteristics including cell location, size, and shape.
2.6. Drug administration & experimental protocol
Where indicated, rats were injected i.p. with either sterile saline (0.9%) or 0.2 mg/kg clonidine (hydrochloride, Sigma-Aldrich) dissolved in sterile saline at a volume of 1 ml/kg. Immediately following drug administration, rats were returned to their home cages and given ad libitum access to food and water. Immediately before decapitation, rats were returned to Plexiglas chambers, tested for thermal hyperalgesia, and decapitated at either 30 min or 120 min post-injection. The dose (0.2 mg/kg) of clonidine was selected for systemic administration based on our previously published reports on its affects on TNFα production in the brain (Ignatowski et al., 1996; Nickola et al., 2000) and that the appropriate analgesic dose of this drug is in the range of 0.006–2.0 mg/kg, with 0.2 mg/kg completely reversing carrageenan-induced thermal hyperalgesia (Sluka and Chandran, 2002).
2.7. Statistical analysis
Frequency-response curves (EF50 values) were analyzed using non-linear regression analysis with SigmaPlot software (SPSS Inc., Chicago, IL). Data were analyzed by either Student’s t-test or ANOVA followed by multiple comparisons tests where appropriate using SigmaStat statistical software (SPSS Inc.) as indicated in the figure legends. Values of p < 0.05 were considered statistically significant. All data points or bars on graphs represent the mean ± S.E.M.
3. Results
3.1. Treatment with clonidine attenuates CCI-induced thermal hyperalgesia
During the development of neuropathic pain induced by CCI, rats experience thermal hyperalgesia, or increased pain perception to a noxious thermal stimulus, first measured at day-2 post-ligature placement, with maximum responses occurring between days-2-8 post-ligature placement. Following the last day of maximal hyperalgesia (day-8), while this response abates, it remains significant through day-12. At day-14 post-ligature placement, there was no difference in PWL of CCI rats as compared to sham-operated rats (Fig. 1). Non-operated animals tested at the same times did not differ from sham-operated animals, with scores remaining at the zero score (Fig. 1). Although reports of contralateral side effects following nerve injury have been reported (Kleinschnitz et al., 2005; Koltzenburg et al., 1999), the data presented in Table 1 shows no difference in actual responses of the contralateral hind paw as assessed at days-2-16 post-CCI.
Figure 1.

Assessment of thermal hyperalgesia in the CCI model of neuropathic pain. Data are presented as the difference score of ipsilateral/experimental – contralateral/control hind paw withdrawal latency in seconds. Each point is expressed as the mean ± S.E.M. (number of rats in parentheses). Statistical significance different from sham-operated rats was reached at * p < 0.01, ** p < 0.001 using a Student’s t-test. Thermal pain perception peaks at days-2-8 post-CCI, with a steady decline to non-significant differences from sham-operated rats beginning at day-14 post-CCI. CCI = chronic constriction injury.
Table 1.
Withdrawal latencies (in seconds) for the ipsilateral and contralateral hindpaws of both sham-operated and CCI rats, expressed as the average (mean ± S.E.M.) of the number of animals in parentheses.
| Days Post Surgery | |||||||||
|---|---|---|---|---|---|---|---|---|---|
| 0 | 2 | 4 | 6 | 8 | 10 | 12 | 14 | 16 | |
| CCI - Ipsilateral | 12.2 ± 0.2 (97) # | 7.1 ± 0.4** (49) | 8.2 ± 0.4 * (46) | 7.5 ± 0.4** (46) | 7.0 ± 0.4** (46) | 9.0 ± 0.7 * (21) | 9.1 ± 0.7 * (21) | 9.3 ± 0.5 (21) | 9.4 ± 0.5** (21) |
| CCI - Contralateral | 12.3 ± 0.2 (97) | 12.2 ± 0.3 (49) | 13.3 ± 0.3 † (46) | 11.8 ± 0.4 (46) | 12.2 ± 0.3 (46) | 12.6 ± 0.5 (21) | 12.3 ± 0.7 (21) | 11.9 ± 0.6 (21) | 12.2 ± 0.5 (21) |
| Sham - Ipsilateral | 12.2 ± 0.2 (97) | 12.6 ± 0.6 (21) | 10.9 ± 0.7 (21) | 12.1 ± 0.7 (21) | 13.0 ± 0.4 (21) | 12.4 ± 1.0 (4) | 9.8 ± 1.0 (4) | 11.2 ± 1.1 (4) | N.D. |
| Sham - Contralateral | 12.3 ± 0.2 (97) | 12.9 ± 0.5 (21) | 12.2 ± 0.5 (21) | 12.2 ± 0.6 (21) | 13.0 ± 0.4 (21) | 13.3 ± 0.6 (4) | 9.4 ± 0.3 (4) | 12.0 ± 1.6 (4) | N.D. |
Statistical significance determined using One-way ANOVA followed by Tukey multiple comparison post-hoc test, except for data at day-4 post-surgery that used Kruskal-Wallis ANOVA on Ranks followed by Dunn’s Method:
Significantly (p < 0.05) different from all three groups at day-4 post-surgery; from CCI-contralateral and Sham-contralateral on day-10 post-surgery; and from CCI-contralateral on day-12 post-surgery.
Significantly (p < 0.05) different from Sham-ipsilateral.
Significantly (p < 0.001) different from CCI-contralateral, Sham-ipsilateral, and Sham-contralateral on days-2, -6, and -8 post-surgery; and from CCI-contralateral on day-16 post-surgery.
Statistical significance determined using Repeated-measures ANOVA followed by Tukey multiple comparison post-hoc test:
Significantly (p < 0.001) different from all days (2–16) post-CCI.
No significant differences were observed for CCI-contralateral hind paw values (days-0-16).
CCI = chronic constriction injury, N.D. = not determined.
Our previous studies employing the same model demonstrate that along with the development of thermal hyperalgesia, there is an increase in levels of biologically active TNFα within the locus coeruleus and the hippocampus, regions of the brain associated with noradrenergic neurotransmission (Covey et al., 2000; Ignatowski et al., 1999). The increased levels of TNFα return to baseline values coincident with the dissipation of hyperalgesia (Covey et al., 2000). Based on these findings and to further study the role of TNFα in mediating hyperalgesia, the selective α2-adrenergic agonist, clonidine (0.2 mg/kg, i.p.), a compound that affects levels of TNFα in the brain (Ignatowski et al., 1996; Nickola et al., 2000), was administered to rats experiencing peak hyperalgesia. Clonidine, also efficacious in alleviating chronic pain symptoms, when administered i.p. to rats at day-8 post-ligature placement, attenuated thermal hyperalgesia measured at 90 min post-injection, but not at 10 min post-injection (Figs. 2A and 2B). At day-16 post-ligature placement, when thermal hyperalgesia begins to subside, clonidine had no effect on PWL as compared to the respective controls (Fig. 2).
Figure 2.


Assessment of thermal hyperalgesia in control, sham-8, CCI-8, and CCI-16 rats both prior to and (A) 10 min or (B) 90 min following either saline or clonidine (0.2 mg/kg, ip) administration. Data are presented as the difference score of ipsilateral/experimental – contralateral/control hind paw withdrawal latency in seconds. Each bar represents the mean ± S.E.M. (number of rats in parentheses). Statistical significance was evaluated by ANOVA followed by Tukey multiple comparison test: * p < 0.05, as compared to CCI-8 at 10 min post-clonidine; † p < 0.001, as compared to control-pre-saline/clonidine, control at 10 min post-saline, Sham-8-pre-saline/clonidine, Sham-8 at 10 min post-saline, and CCI-16 at 10 min post-clonidine; § p < 0.05, as compared to control at 10 min post-clonidine, Sham-8 at 10 min post-clonidine, and CCI-16 at 10 min post-saline; # p < 0.05, as compared to CCI-8-pre-saline/clonidine, CCI-8 at 90 min post-saline, CCI-16-pre-saline/clonidine, and CCI-16 at 90 min post-saline; ** p < 0.01, as compared to CCI-8-pre-saline/clonidine, CCI-8 at 90 min post-saline, CCI-16-pre-saline/clonidine, and CCI-16 at 90 min post-saline; *** p < 0.001, as compared to control-pre-saline/clonidine; ‡ p < 0.01, as compared to control at 10 min post-saline, control at 10 min post-clonidine, and Sham-8 at 10 min post-saline; ψ p < 0.05, as compared to Sham-8 at 10 min post-clonidine and CCI-16 at 10 min post-clonidine; p < 0.05, as compared to control-pre-saline/clonidine. Clonidine administration to rats experiencing peak hyperalgesia (CCI-8) abolishes pain perception, while having no effect on control/sham-operated rats or on rats at day-16 post-CCI. CCI = chronic constriction injury; Sham-8 = rats at day-8 post-sham surgery; CCI-8 = rats at day-8 post-CCI; CCI-16 = rats at day-16 post-CCI.
3.2. Electrically-stimulated, frequency-dependent [3H]-NE release from left hippocampal brain slices
In the present study, we investigated electrically-stimulated, frequency-dependent [3H]-NE release from left hippocampal brain slices obtained from CCI rats either at or subsequent to peak hyperalgesia.
The generation of frequency-response curves for NE release from consecutively-stimulated hippocampal slices prepared from control rats reveals an escalation in NE release at the onset of each consecutive, increased stimulation frequency (Fig. 3A). Since no differences were observed in EF50 or frequency response values for [3H]-NE release, the control group consists of non-operated, day-8 sham-operated, and day-8 sham-operated, saline-injected (i.p.) rats. In the presence of either exogenous TNFα (10 ng/ml) or UK-14,304 (10−8 M), a selective α2-adrenergic agonist, frequency-dependent, stimulated release of NE was inhibited (Fig. 3A). The concentration of 10 ng/ml TNFα was chosen based on the previous generation of TNFα concentration-effect curves (0.1 – 100 ng/ml), with 10 ng/ml providing near maximum inhibition of stimulated NE release (Ignatowski and Spengler, 1994). The concentration of 10−8 M UK-14,304 was chosen from the EC75 value of previously generated UK-14,304 concentration-effect curves for inhibition of stimulated NE release (Reynolds et al., 2005a; Reynolds et al., 2005b). As shown in figure 4A, while TNFα inhibits NE release to a similar extent across all frequencies tested, UK-14,304 works more effectively at the lower frequencies (0.5 to 2 Hz), similar to that published for clonidine (Ignatowski et al., 1996). At day-8 post-ligature placement, when thermal hyperalgesia transitions from maximal to declining (Fig. 1), a transition also occurs whereby TNFα (10 ng/ml) and UK-14,304 (10−8 M) are no longer effective in inhibiting NE release at the higher frequencies of stimulation (Fig. 3C). In fact, at the higher frequencies of stimulation, presynaptic sensitivity to TNFα and UK-14,304 transforms from inhibition of NE release to facilitation of release (Fig. 4C). At day-16 post-ligature placement, a transformation is evident whereby both TNFα (10 ng/ml) and UK-14,304 (10−8 M) now facilitate stimulated NE release in a frequency-dependent manner (Figs. 3E and 4E).
Figure 3.

Frequency-response curves for field-stimulation of hippocampal slices isolated from the contralateral side to the CCI injury from (A) control rats (control group consists of non-operated, sham-8, and sham-8, saline injection (i.p.) rats); (B) control rats at 120 min post-clonidine (i.p.); (C) rats at day-8 post-CCI at 120 min post-saline (i.p.); (D) rats at day-8 post-CCI at 120 min post-clonidine (i.p.); (E) rats at day-16 post-CCI at 120 min post-saline (i.p.); and (F) rats at day-16 post-CCI at 120 min post-clonidine (i.p.) with the effects of either TNFα (10 ng/ml) or UK-14,304 (10−8 M) in vitro. Results are expressed as % of baseline (0.5 Hz) electrically-stimulated NE release. Each point is expressed as the mean ± S.E.M. (number of rats in parentheses). Statistical significance between stimulation frequencies of the control and two experimental groups in each panel was reached using a paired Student’s t-test as follows: (A) * p < 0.05, ** p < 0.01 as compared to control w/10−8 M UK, and # p < 0.05, † p < 0.01 as compared to control w/10 ng/ml TNF; (B) * p < 0.05, ** p < 0.01 as compared to control at 120’ post-clonidine w/10−8 M UK, and † p < 0.01 as compared to control at 120’ post-clonidine w/10 ng/ml TNF; (C) * p < 0.05 as compared to CCI-8 w/10−8 M UK, and # p < 0.05 as compared to CCI-8 w/10 ng/ml TNF; (D) * p < 0.05 as compared to CCI-8 at 120’ post-clonidine w/10−8 M UK, and # p < 0.05 as compared to CCI-8 at 120’ post-clonidine w/10 ng/ml TNF; (E) * p < 0.05 as compared to CCI-16 w/10−8 M UK, and # p < 0.05 as compared to CCI-16 w/10 ng/ml TNF; and (F) * p < 0.05, ** p < 0.01, p< 0.001 as compared to CCI-16 at 120’ post-clonidine w/10−8 M UK, and # p < 0.05, † p < 0.01, ‡ p < 0.001 as compared to CCI-16 at 120’ post-clonidine w/10 ng/ml TNF. CCI = chronic constriction injury, UK = UK-14,304.
Figure 4.

Frequency-response curves for field-stimulation of hippocampal slices isolated from the contralateral side to the injury from (A) control rats (control group consists of non-operated, sham-8, and sham-8, saline injection (i.p.) rats); (B) control rats at 120 min post-clonidine (i.p.); (C) rats at day-8 post-CCI at 120 min post-saline (i.p.); (D) rats at day-8 post-CCI at 120 min post-clonidine (i.p.); (E) rats at day-16 post-CCI at 120 min post-saline (i.p.); and (F) rats at day-16 post-CCI at 120 min post-clonidine (i.p.) with the effects of either TNFα (10 ng/ml) or UK-14,304 (10−8 M) in vitro. Results are expressed as % change in NE release from control release. Each point is expressed as the mean ± S.E.M. (number of rats in parentheses). Note the increase in ordinate values in (E) as compared to all other panels. Note also that the transformation in electrically-stimulated NE release (CCI-16) corresponds with the dissipation of thermal hyperalgesia.
Administration of the α2-adrenergic agonist, clonidine (0.2 mg/kg, i.p., 120 min), to naïve rats (control group) appears to ‘desensitize’ the α2-adrenergic receptor, whereby UK-14,304 (10−8 M) and TNFα (10 ng/ml) are no longer effective in inhibiting frequency-dependent stimulated NE release (Figs. 3B and 4B). This response is similar to that observed in field-stimulation of slices obtained from animals at day-16 post-ligature placement (Figs. 3E and 4E). It should be noted that these tissue slices undergo extensive washing by superfusion prior to depolarization, thereby precluding a residual clonidine effect. Interestingly, clonidine (0.2 mg/kg, i.p., 120 min) administration to rats experiencing peak thermal hyperalgesia associated with neuropathic pain, appears to enhance both UK-14,304 and TNFα inhibition of NE release (Figs. 3D and 4D); however, this release was variable, indicating diversity among animals being either at peak hyperalgesia or experiencing the maintenance of pain. Therefore, at day-8 post-ligature placement, 120 min after clonidine is injected, α2-adrenergic and TNFα regulation of NE release functions similar to that which occurs in naïve animals (compare Fig. 3A to 3D and 4A to 4D). While this return to inhibition of NE release by TNFα and UK-14,304 occurs during this 2 hr treatment with clonidine, these animals at day-8 post-ligature placement also no longer experienced thermal hyperalgesia (Fig. 2B). Following activation of the α2-adrenergic receptor (120 min) with clonidine (0.2 mg/kg, i.p.) in rats during the maintenance of hyperalgesia, at a time when stimulation of the α2-adrenergic receptor facilitates NE release (Figs. 3E and 4E), both TNFα and UK-14,304 inhibited stimulated NE release (Figs. 3F and 4F), similar to that which occurs in naïve animals (Figs. 3A and 4A), but opposite to that which occurs in naïve rats administered clonidine (Figs. 3B and 4B).
3.3. Effect of α2-adrenergic receptor activation on the accumulation of mRNA for TNFα in neurons
In situ hybridization reveals constitutive accumulation of mRNA specific for TNFα in the region of the brainstem containing the locus coeruleus (Fig. 5) and in the hippocampus (Fig. 6). This accumulation of mRNA was localized to neurons as determined by hematoxylin and eosin staining and recognized by morphological characteristics. As previously published (Covey et al., 2002), during the development of chronic pain, there is an increase in the number of grains/neuron in the brain 8 days post-ligation of the sciatic nerve (Figs. 5B (panel c) and 6B (panel c) and Table 2). Similar to that previously published (Covey et al., 2002), an increase in the number of TNFα mRNA grains/neuron in the brain persisted at day-16 post-ligature placement (Figs. 5B (panel e) and 6B (panel e) and Table 2). Expression of TNFα mRNA was not altered in day-8 sham-operated rats, nor was the amount or pattern of expression of β-actin mRNA altered by this paradigm (data not shown).
Figure 5.
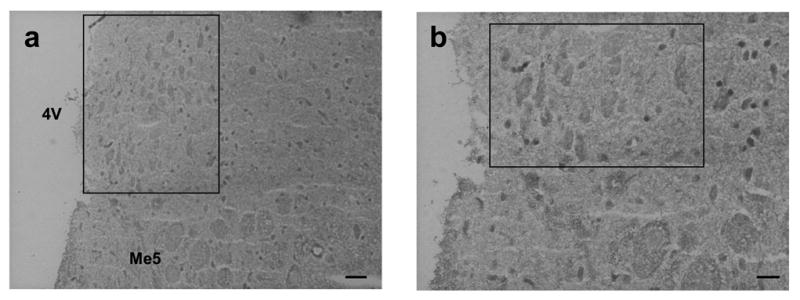

TNFα mRNA accumulation in the locus coeruleus. (A) Representative digital photomicrographs illustrating the region of the rat brain stem containing the locus coeruleus that was assessed for TNFα mRNA accumulation. (a) The region of the locus coeruleus (enclosed in box) adjacent to the 4th ventricle (4V) and to the mesencephalic trigeminal nucleus (Me5). Scale bar = 40 μm. (b) Increased magnification of a portion of the section illustrated in (a). Scale bar = 20 μm. (B) In situ hybridization localizing mRNA for TNFα in neurons of the locus coeruleus. Tissue from control rats (a) reveals constitutive expression of mRNA specific for TNFα. Tissue from control rats receiving clonidine (0.2 mg/kg, i.p.) for 120 min prior to sacrifice (b) reveals a decrease in accumulation of mRNA specific for TNFα. Tissue sections obtained from rats at day-8 post-ligature placement (c) and at day-16 post-ligature placement (e) reveal an increase in accumulation of mRNA specific for TNFα, as compared with control rats. However, tissue obtained from rats at day-8 post-ligature placement (d) and receiving clonidine (0.2 mg/kg, i.p.) for 120 min prior to sacrifice reveal an increase in accumulation of mRNA specific for TNFα. While, similar to control, tissue sections prepared from rats at day-16 post-ligature placement (f) and receiving clonidine (0.2 mg/kg, i.p.) for 120 min prior to sacrifice reveal no significant change in TNFα mRNA accumulation. All photos were taken at same magnification. Appropriate background values (grains) were subtracted from each section. Scale bar = 10 μm.
Figure 6.
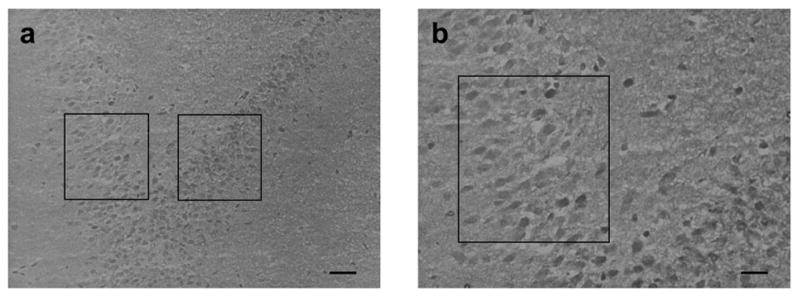

TNFα mRNA accumulation in the hippocampus. (A) Representative digital photomicrographs illustrating the hippocampus of the rat brain and indicating the region used to assess TNFα mRNA accumulation. (a) Magnification of the characteristic jelly-roll region of the hippocampus demonstrating the areas (enclosed in box) used for neuron grain analysis. Scale bar = 40 μm. (b) Increased magnification of a portion of the left boxed section illustrated in (a). Scale bar = 20 μm. (B) Effect of α2-adrenergic receptor activation on hippocampal neuron accumulation of TNFα mRNA as per in situ hybridization analysis. Tissue from control rats (a) reveals constitutive expression of mRNA specific for TNFα. Tissue obtained from control animals receiving clonidine (0.2 mg/kg, i.p.) for 120 min prior to sacrifice (b) reveals an inhibition in accumulation of mRNA specific for TNFα. Tissue sections obtained from rats at day-8 post-ligature placement (c) and at day-16 post-ligature placement (e) reveal an increase in accumulation of mRNA specific for TNFα, as compared with control rats. Tissue obtained from rats at day-8 post-ligature placement receiving clonidine (0.2 mg/kg, i.p.) for 120 min prior to sacrifice (d) reveals increased accumulation of mRNA specific for TNFα. Similarly, tissue obtained from rats at day-16 post-ligature placement receiving clonidine (0.2 mg/kg, i.p.) for 120 min (f) reveals enhanced accumulation of mRNA specific for TNFα. Scale bar = 10 μm.
Table 2.
Measurement of normalized average number of silver grains per neuron probed for mRNA specific for TNFα using in situ hybridization.
| Locus Coeruleus | Hippocampus | |
|---|---|---|
| Control | 76.7 ± 4.5 (17) | 71.9 ± 5.4 (7) |
| CCI-2 | 108 ± 25.5 (3) * | 107 ± 13 (3) * |
| CCI-8 | 106.7 ± 17.5 (7) * | 113.6 ± 17.5 (5) ** |
| CCI-16 | 100.2 ± 10.9 (6) * | 112.2 ± 11.3 (5) ** |
Data represent the normalized average number of grains per neuron (five neurons in each of six sections per brain region analyzed) with the number of animals indicated in parentheses. Data from three separate groups containing animals from all experimental paradigms were normalized to compare results and perform statistical analysis. Statistical significance was determined using Student’s t-test. Statistically different from control,
p < 0.05,
p < 0.01. CCI = chronic constriction injury.
Administration of clonidine (0.2 mg/kg, i.p.) to naïve rats (control group) for 120 min decreased neuron accumulation of TNFα mRNA in both the locus coeruleus and the hippocampus (Figs. 5B (panel b), 6B (panel b), and 7). This finding supports previous results assessing bioactive TNFα production in these same regions following acute (either 1 day or 7.5–60 min) clonidine administration to rats (Ignatowski et al., 1996; Nickola et al., 2000). Of particular interest, the administration of clonidine to rats experiencing thermal hyperalgesia at day-8 post-ligature placement, when neuron-associated TNFα expression is increased (Figs. 5B (panel c) and 6B (panel c)), increased the accumulation of message for TNFα (Figs. 5B (panel d), 6B (panel d), and 7). In addition, the activation of α2-adrenergic receptors in the brain following antidepressant drug administration to rats also results in increased TNFα production, the opposite response to receptor activation in naïve animals (Nickola et al., 2000). This transformation in α2-adrenergic receptor regulation of TNFα production from inhibition to facilitation occurs within the therapeutically effective time frame for antidepressant drugs. Activation of the α2-adrenergic receptor during the maintenance of thermal hyperalgesia (starting at day-8 and continuing through day-16 post-ligature placement) increases accumulation of TNFα mRNA, opposite to naive animals (Figs. 5B (panel f) and 6B (panel f)). It is interesting to note that at the same time when clonidine administration to rats (day-8 and day-16 post-ligature placement) enhances TNFα levels in the brain, presynaptic regulation of NE release in response to TNFα and α2-adrenergic activation transforms from facilitation back to inhibition, similar to the inhibition that occurs in naïve rats (Fig. 3).
4. Discussion
These findings demonstrate a role for TNFα and α2-adrenergic activation in the brain during the development and maintenance of hyperalgesia, a nociceptive behavior. It is well known that α2-adrenergic agents produce antinociception and analgesia (Dennis et al., 1980; Kayser et al., 1992; Paalzow, 1974; Pertovaara, 1993; Reddy et al., 1980; Tasker and Melzack, 1989; Yaksh, 1985). As expected based on its’ pharmacokinetic profile, clonidine administration (0.2 mg/kg, i.p.) completely blocked the thermal hyperalgesia induced by CCI (Fig. 1) after 90 min (Fig 2B), but not after 10 min (Fig. 2A). The role of TNF and the α2-adrenergic receptor in mediating this profound clonidine effect on nociceptive behavior (90 min) was further investigated.
The regulation of NE release was studied at different stages during CCI. Rat hippocampal tissue was sliced and exposed to the selective α2-adrenergic agonist, UK-14,304 or to TNFα (Figs. 3 and 4). Exogenous TNFα, similar to α2-adrenergic activation, inhibits frequency-dependent release of NE (Figs. 3A and 4A) (Ignatowski et al., 1997). However, administration of clonidine to naïve rats (120 min) changes subsequent in vitro UK-14,304 and TNFα regulation of NE release. Whereas at lower frequencies both compounds continue to inhibit NE release, albeit to a lesser extent; at higher physiological frequencies, there exists a transformation whereby both UK-14,304 and TNFα facilitate NE release (Figs. 3B and 4B). Thus, it is apparent that activation of the α2-adrenergic receptor in vivo rapidly changes that receptor.
While the α2-adrenergic receptor regulates TNFα production by different cell types including neurons, it is also a principal regulator of NE release from noradrenergic neurons. The α2-adrenergic autoreceptor inhibits NE release, through a feedback mechanism (Dixon et al., 1979; Langer, 1981). TNFα can either inhibit or facilitate NE release; the direction is dependent upon the simultaneous activation of α2-adrenergic receptors. Inhibition of NE release by TNFα from hippocampal slices from naïve rats transforms to facilitation following chronic administration of antidepressant drugs (Ignatowski and Spengler, 1994; Nickola et al., 2001; Reynolds et al., 2004a). Likewise, enhanced TNFα-inhibition of NE release during peak hyperalgesia in the CCI model transforms to facilitation upon treatment of pain with amitriptyline or during the natural dissipation of hyperalgesia (Ignatowski et al., 2005). Both the inhibition and the facilitation of NE release by TNFα are dependent upon continual functioning of the α2-adrenergic receptor (Covey et al., 2000; Ignatowski and Spengler, 1994; Ignatowski et al., 2005). Regulation of NE release by TNFα and the α2-adrenergic autoreceptor are, therefore, reciprocally permissive, and adapt to modifications in each response. Changes in TNFα levels in the brain lead to changes in monoamine release over a range of physiologic frequencies (1–20 Hz); responses that appear to underlie the analgesic mechanism of action of α2-adrenergic agonists.
At the higher frequencies tested, following acute (2 hr) in vivo activation of the α2-adrenergic receptor in control rats (Figs. 3B and 4B), TNFα and α2-adrenergic regulation of NE release resembles that which occurs following chronic (14 days) antidepressant administration alone (Ignatowski et al., 1997; Ignatowski and Spengler, 1994; Reynolds et al., 2004a). Interestingly, the transformation in TNFα and UK-14,304 regulation of NE release from inhibition (Fig. 3A) to facilitation (Fig. 3B) does not occur at peak hyperalgesia (Fig. 3D). However, clonidine administration to rats that are experiencing maintained pain induces a response opposite to that in naïve rats (compare Figs. 3B to 3F and 4B to 4F). While an enhanced inhibition of NE release by TNFα occurs during development of neuropathic pain (Covey et al., 2000), the present data demonstrate that a window exists whereby these cellular events transform between the development of hyperalgesia, peak hyperalgesia, and decline in hyperalgesia. It is notable that similar to administration of the antidepressant drug amitriptyline (Ignatowski et al., 2005), the α2-adrenergic agonist clonidine works best at alleviating thermal hyperalgesia (Fig. 2B) when NE release is low (Covey et al., 2000; Ignatowski et al., 1999; Ignatowski et al., 2005). Therefore, at lower release of NE, as occurs in chronic pain, the response to TNFα and UK-14,304 is different than at high frequencies. When NE release is low in the brain during the development of neuropathic pain (Covey et al., 2000), the response to analgesic drugs is notable.
In hippocampal slices from rats administered the antidepressant desipramine for 14 days, a time when desipramine is clinically efficacious as an antidepressant, TNFα-regulation of NE release transforms, such that TNFα facilitates NE release (Ignatowski and Spengler, 1994; Reynolds et al., 2005b). Also, a transformation from inhibition to facilitation of NE release by exogenous TNFα occurs in hippocampal slices from rats after 1 day, but not after chronic administration of clonidine (Ignatowski et al., 1996; Reynolds et al., 2005b). The transformation, which serves to increase noradrenergic output, is observed after a period of administration when both compounds have antidepressant qualities. Whether this extends to the analgesic properties of clonidine was examined in the CCI model.
A loss in TNFα and α2-adrenergic inhibition of NE release occurs subsequent to peak hyperalgesia, and fully transforms to frequency dependent facilitation of NE release during the beginning of its natural resolution (Figs. 3 and 4). In fact, contraindication of α2-adrenergic receptor activation (as occurs at higher frequencies) simultaneous with antidepressant administration is documented (Cocco and Ague, 1977; Jimerson et al., 1980; Parale and Kulkarni, 1986) and mediated through TNFα production (Reynolds et al., 2005b).
The α2-adrenergic autoreceptor is influenced by TNFα. Fourteen days of continual icv microinfusion of rrTNFα into the rat enhances α2-adrenergic inhibition of NE release (Nickola et al., 2000). Constitutive TNFα maintains homeostasis in NE release by regulating the intracellular signaling pathway of the α2-adrenergic receptor (Reynolds et al., 2005a). Of particular interest, TNFα increases expression of specific G-proteins that couple to α2-adrenergic receptors (Hotta et al., 1999; Klein et al., 1995; Pollock et al., 2000; Reithman et al., 1991; Scherzer et al., 1997). Therefore, sustained increases in neuron-derived TNFα induced by CCI alter the G-protein repertoire in neuron membranes, changing the response of the neurons to mediators acting on G-protein coupled receptors, including the α2-adrenergic receptor. The α2-adrenergic receptor couples to two G-proteins with opposing effects (Giα and Gsα) (Chabre et al., 1994; Eason et al., 1992). A change in availability of G-proteins would allow the receptor to couple with opposing G-proteins, thereby favoring the facilitation of NE release. In fact, pre-exposure of hippocampal membranes to pertussis toxin, which inactivates Giα-proteins, transforms TNFα-regulation of NE release to facilitation, a response reversed by subsequent exposure to TNFα (Reynolds et al., 2005a). Taken together, the present results and evidence cited suggests that a switch in G-protein coupling of the α2-adrenergic receptor may occur, explaining the transformation in α2-adrenergic receptor regulation of both TNFα production and NE release observed during CCI.
The present study demonstrates a fundamental role that TNFα in the brain plays in orchestrating neurotransmission. While the role of neuron production of TNFα is recently appreciated, these findings follow our previous work, a series of studies that show the interdependence between TNFα production in the brain and functioning of α2-adrenergic autoreceptors and α2-adrenergic receptors that regulate TNFα production. Constitutive TNFα, immunolocalized to neurons, is denoted by accumulation of biologically active TNFα in brain tissue (Ignatowski et al., 1997; Ignatowski and Spengler, 1994; Nickola et al., 2000). Administration of an α2-adrenergic agonist to naïve rats rapidly decreases total levels of TNFα in the brain (Ignatowski et al., 1996). However, following chronic antidepressant drug administration, which decreases expression of TNFα within neurons in the brain (Ignatowski et al., 1997; Nickola et al., 2001), administration of an α2-adrenergic agonist enhances total levels of TNFα (Nickola et al., 2000). Similarly, α2-adrenergic activation of neurons in culture, exposed to negligible TNFα, enhances TNFα production (Renauld and Spengler, 2002). Therefore, the α2-adrenergic receptor enhances as well as inhibits the production of neuron-derived TNFα.
When administered to naïve rats for 1 day or 14 days, clonidine decreases total levels of TNFα in the brain (Ignatowski et al., 1996; Nickola et al., 2000). Yet, after either 1 day or 14 days administration of clonidine, total TNFα mRNA accumulation in brain tissue homogenates remains unaffected (Ignatowski et al., 1996; Reynolds et al., 2005b). However, when localized within neurons, TNFα mRNA expression is rapidly decreased following 120 min clonidine administration (Figs. 5B (panel b), 6B (panel b), and 7). Therefore, regulation of TNFα production by neurons in response to clonidine administration may be different than that which occurs by other cell populations and displays the possible interplay between neurons and accessory cells.
Amitriptyline, possessing both antidepressant and analgesic properties, when administered to naïve rats increases total levels of TNFα in the brain (Reynolds et al., 2004a). Likewise, at 60 min following amitriptyline administration TNFα levels are increased at peak hyperalgesia, coinciding with the antihyperalgesic response (Ignatowski et al., 2005). It is interesting to note that clonidine, when antinociceptive (Fig. 2B), increases TNFα mRNA accumulation in the hippocampus (Figs. 6B (panel d) and 7B). However, when clonidine is not antinociceptive (Fig. 2A), it only affects TNF mRNA accumulation in the locus coeruleus (Figs. 5B (panel d) and 7A), the region of noradrenergic nerve cell bodies that extends to the hippocampus. Therefore, analgesic properties of these compounds may involve induction of TNFα expression in a specific region of the brain associated with mood and memory processing. In fact, enhancing levels of TNFα in the brain at day-8 post-ligature placement is involved in alleviating hyperalgesia (Ignatowski et al., 2005). Therefore, while TNFα is involved in the development of hyperalgesia (Ignatowski et al., 1999), in animals experiencing hyperalgesia, TNFα possesses antinociceptive properties (Ignatowski et al., 2005).
We have elucidated a mechanism whereby clonidine (i.p.) treatment of nociception transforms neuron response to TNFα and α2-adrenergic agonists in the brain. This transformation is a switch in neuron response to TNFα and α2-adrenergic agonists from inhibition to facilitation of NE release. This culminates in increased NE release from neurons during recovery from neuropathic pain, similar to chronic antidepressant administration to naïve rats. Paradoxically, this mechanism requires production of TNFα, a cytokine associated with development of thermal hyperalgesia (Covey et al., 2000; Covey et al., 2002; Ignatowski et al., 1999; Oka et al., 1996; Xie et al., 2006). In fact, subsequent to peak hyperalgesia, TNFα as well as α2-adrenergic receptor activation increases NE release. This enhanced NE release will increase α2-adrenergic receptor activation, and therefore induce TNFα production. Given that TNFα now facilitates NE release, this enhanced TNFα production will further support increased NE release, propagating enhanced NE release in the brain, leading to resolution of hyperalgesia. Since the α2-adrenergic receptor that regulates TNFα synthesis transforms before the autoreceptor that regulates NE release, TNFα regulates the α2-adrenergic autoreceptor culminating in the regulation of NE release. Therefore, normal physiological functioning is restored; this occurs during both clonidine- and amitriptyline-induced antinociception (Ignatowski et al., 2005). These neuroplastic changes in the noradrenergic system which we are elucidating most likely represent similar changes throughout other regions of the nervous system associated with pain.
Figure 7.


Quantification of results of in situ hybridization for mRNA specific for TNFα in neurons of the (A) locus coeruleus and (B) hippocampus from control rats and rats at day-8 and day-16 post-ligature placement, following α2-adrenergic receptor activation (clonidine, 0.2 mg/kg, i.p.) for 30 min or 120 min prior to sacrifice. Results are presented as percent change in the normalized, average number of grains/neuron (30 neurons/brain region) from own constitutive levels. Each bar is expressed as the mean ± SEM with the number of animals indicated in parentheses. Statistical significance was determined by using Mann-Whitney Rank Sum Test. Statistically different from respective controls, * p < 0.05, ** p ≤ 0.01.
Acknowledgments
This work was supported by the United Spinal Association/Eastern Paralyzed Veterans Association (TAI) and by the National Institutes of Health Grant No. NS41352 (RNS).
Footnotes
Publisher's Disclaimer: This is a PDF file of an unedited manuscript that has been accepted for publication. As a service to our customers we are providing this early version of the manuscript. The manuscript will undergo copyediting, typesetting, and review of the resulting proof before it is published in its final citable form. Please note that during the production process errors may be discovered which could affect the content, and all legal disclaimers that apply to the journal pertain.
References
- Attal N, Jazat F, Kayser V, Guilbaud G. Further evidence for a 'pain-related' behaviour in a model of unilateral peripheral mononeuropathy. Pain. 1990;41:235–251. doi: 10.1016/0304-3959(90)90022-6. [DOI] [PubMed] [Google Scholar]
- Bennett GJ, Xie YK. A peripheral mononeuropathy in rat that produces disorders of pain sensation like those seen in man. Pain. 1988;33:87–107. doi: 10.1016/0304-3959(88)90209-6. [DOI] [PubMed] [Google Scholar]
- Chabre O, Conklin BR, Brandon S, Bourne HR, Limbird LE. Coupling of the alpha2A-adrenergic receptor to multiple G-proteins. A simple approach for estimating receptor-G-protein coupling efficiency in a transient expression system. J Biol Chem. 1994;269:5730–5734. [PubMed] [Google Scholar]
- Cocco G, Ague C. Interactions between cardioactive drugs and antidepressants. Eur J Clin Pharmacol. 1977;11:389–393. doi: 10.1007/BF00566537. [DOI] [PubMed] [Google Scholar]
- Covey WC, Ignatowski TA, Knight PR, Spengler RN. Brain-derived TNFα: involvement in neuroplastic changes implicated in the conscious perception of persistent pain. Brain Res. 2000;859:113–122. doi: 10.1016/s0006-8993(00)01965-x. [DOI] [PubMed] [Google Scholar]
- Covey WC, Ignatowski TA, Renauld AE, Knight PR, Nader ND, Spengler RN. Expression of neuron-associated tumor necrosis factor alpha in the brain is increased during persistent pain. Reg Anesth Pain Med. 2002;27:357–366. doi: 10.1053/rapm.2002.31930. [DOI] [PubMed] [Google Scholar]
- Delgado JMR. Cerebral structures involved in transmission and elaboration of noxious stimulation. J Neurophysiol. 1955;18:261–275. doi: 10.1152/jn.1955.18.3.261. [DOI] [PubMed] [Google Scholar]
- Dennis SG, Melzack R, Gutman S, Boucher F. Pain modulation by adrenergic agents and morphine as measured by three pain tests. Life Sci. 1980;26:1247–1259. doi: 10.1016/0024-3205(80)90070-3. [DOI] [PubMed] [Google Scholar]
- Dixon WR, Mosimann WF, Weiner N. The role of presynaptic feedback mechanisms in regulation of norepinephrine release by nerve stimulation. J Pharmacol Exp Ther. 1979;209:196–204. [PubMed] [Google Scholar]
- Dutar P, Lamour Y, Jobert A. Activation of identified septo-hippocampal neurons by noxious peripheral stimulation. Brain Res. 1985;328:15–21. doi: 10.1016/0006-8993(85)91317-4. [DOI] [PubMed] [Google Scholar]
- Eason MG, Kurose H, Holt BD, Raymond JR, Liggett SB. Simultaneous coupling of alpha2-adrenergic receptors to two G-proteins with opposing effects. Subtype-selective coupling of alpha 2C10, alpha 2C4, and alpha 2C2 adrenergic receptors to Gi and Gs. J Biol Chem. 1992;267:15795–15801. [PubMed] [Google Scholar]
- Eisenach JC, DeKock M, Kimscha W. Alpha sub 2-adrenergic agonists for regional anesthesia: a clinical review of clonidine (1984–1995) Anesthesiol. 1996;85:655–674. doi: 10.1097/00000542-199609000-00026. [DOI] [PubMed] [Google Scholar]
- Elner VM, Strieter RM, Pavilack MA, Elner SG, Remick DG, Danforth JM, Kunkel SL. Human corneal interleukin-8, IL-1 and TNF-induced gene expression and secretion. Amer J Pathol. 1991;139:977–988. [PMC free article] [PubMed] [Google Scholar]
- Hargreaves K, Dubner R, Brown F, Flores C, Joris J. A new and sensitive method for measuring thermal nociception in cutaneous hyperalgesia. Pain. 1988;32:77–88. doi: 10.1016/0304-3959(88)90026-7. [DOI] [PubMed] [Google Scholar]
- Hotta K, Emala CW, Hirshman CA. TNF-alpha upregulates Gialpha and Gqalpha protein expression and function in human airway smooth muscle cells. Amer J Physiol. 1999;276:L405–L411. doi: 10.1152/ajplung.1999.276.3.L405. [DOI] [PubMed] [Google Scholar]
- Ignatowski TA, Chou RC, Spengler RN. Changes in noradrenergic sensitivity to tumor necrosis factor-α in brains of rats administered clonidine. J Neuroimmunol. 1996;70:55–63. doi: 10.1016/s0165-5728(96)00098-7. [DOI] [PubMed] [Google Scholar]
- Ignatowski TA, Covey WC, Knight PR, Severin CM, Nickola TJ, Spengler RN. Brain-derived TNFα mediates neuropathic pain. Brain Res. 1999;841:70–77. doi: 10.1016/s0006-8993(99)01782-5. [DOI] [PubMed] [Google Scholar]
- Ignatowski TA, Noble BK, Wright JR, Gorfien JL, Heffner RR, Spengler RN. Neuronal-associated tumor necrosis factor (TNFα): its role in noradrenergic functioning and modification of its expression following antidepressant drug administration. J Neuroimmunol. 1997;79:84–90. doi: 10.1016/s0165-5728(97)00107-0. [DOI] [PubMed] [Google Scholar]
- Ignatowski TA, Spengler RN. Tumor necrosis factor-α: presynaptic sensitivity is modified after antidepressant drug administration. Brain Res. 1994;665:293–299. doi: 10.1016/0006-8993(94)91350-1. [DOI] [PubMed] [Google Scholar]
- Ignatowski TA, Sud R, Reynolds JL, Knight PR, Spengler RN. The dissipation of neuropathic pain paradoxically involves the presence of tumor necrosis factor-α (TNF) Neuropharmacology. 2005;48:448–460. doi: 10.1016/j.neuropharm.2004.11.001. [DOI] [PubMed] [Google Scholar]
- Jimerson DC, Post RM, Stoddard FJ, Gillin JC, Bunney WE. Preliminary trial of the noradrenergic agonist clonidine in psychiatric patients. Biol Psychiatry. 1980;15:45–57. [PubMed] [Google Scholar]
- Kawamata T, Omote K, Kawamata M, Iwasaki H, Namiki A. Antinociceptive interaction of intrathecal α2-adrenergic agonists, tizanidine and clonidine, with lidocaine in rats. Anesthesiology. 1997;87:436–438. doi: 10.1097/00000542-199708000-00035. [DOI] [PubMed] [Google Scholar]
- Kayser V, Guilbaud G, Besson JM. Potent antinociceptive effects of clonidine systemically administered in an experimental model of clinical pain, the arthritic rat. Brain Res. 1992;593:7–13. doi: 10.1016/0006-8993(92)91255-d. [DOI] [PubMed] [Google Scholar]
- Khanna S, Sinclair JG. Noxious stimuli produce prolonged changes in the CA1 region of the rat hippocampus. Pain. 1989;39:337–343. doi: 10.1016/0304-3959(89)90047-X. [DOI] [PubMed] [Google Scholar]
- Kiss JP, Zsilla G, Mike A, Zelles T, Toth E, Lajtha A, Vizi ES. Subtype-specificity of the presynaptic alpha 2-adrenoceptors modulating hippocampal norepinephrine release in rat. Brain Res. 1995;674:238–244. doi: 10.1016/0006-8993(94)01447-p. [DOI] [PubMed] [Google Scholar]
- Klein JB, Scherzer JA, Harding G, Jacobs AA, McLeish KR. TNF-alpha stimulates increased plasma membrane guanine nucleotide binding protein activity in polymorphonuclear leukocytes. J Leukocyte Biol. 1995;57:500–506. doi: 10.1002/jlb.57.3.500. [DOI] [PubMed] [Google Scholar]
- Kleinschnitz C, Brinkhoff J, Sommer C, Stoll G. Contralateral cytokine gene induction after peripheral nerve lesions: dependence on the mode of injury and NMDA receptor signaling. Brain Res Mol Brain Res. 2005;136:23–28. doi: 10.1016/j.molbrainres.2004.12.015. [DOI] [PubMed] [Google Scholar]
- Koltzenburg M, Wall PD, McMahon SB. Does the right side know what the left side is doing? Trends Neurosci. 1999;22:122–127. doi: 10.1016/s0166-2236(98)01302-2. [DOI] [PubMed] [Google Scholar]
- Korzeniewska-Rybicka I, Plaznik A. Analgesic effect of antidepressant drugs. Pharmacol Biochem Behav. 1998;59:331–338. doi: 10.1016/s0091-3057(97)00336-5. [DOI] [PubMed] [Google Scholar]
- Kunkel SL, Spengler M, May MA, Spengler RN, Larrick J, Remick DG. Prostaglandin E2 regulates macrophage-derived tumor necrosis factor gene expression. J Biol Chem. 1988;263:5380–5384. [PubMed] [Google Scholar]
- Lakhlani PP, MacMillan LB, Guo TZ, McCool BA, Lovinger DM, Maze M, Limbird LE. Substitution of a mutant α2A-adrenegic receptor via 'hit and run' gene targeting reveals the role of this subtype in sedative, analgesic, and anesthetic- sparing responses in vivo. Proc Natl Acad Sci USA. 1997;94:9950–9955. doi: 10.1073/pnas.94.18.9950. [DOI] [PMC free article] [PubMed] [Google Scholar]
- Langer SZ. Presynaptic regulation of the release of catecholamines. Pharmacol Rev. 1981;32:337–362. [PubMed] [Google Scholar]
- Martin TJ, Eisenach JC. Pharmacology of opioid and nonopioid analgesics in chronic pain states. J Pharmacol Exp Ther. 2001;299:811–817. [PubMed] [Google Scholar]
- Max MB. Antidepressant as analgesics. In: Fields HL, Liebeskind JC, editors. Pharmacological approaches to the treatment of chronic pain. IASP Press; Seattle: 1994. pp. 229–246. [Google Scholar]
- McEwen BS. Plasticity of the hippocampus: adaptation to chronic stress and allostatic load. Ann NY Acad Sci. 2001;933:265–277. doi: 10.1111/j.1749-6632.2001.tb05830.x. [DOI] [PubMed] [Google Scholar]
- McKenna JE, Melzack R. Analgesia produced by lidocaine microinjection into the dentate gyrus. Pain. 1992;49:105–112. doi: 10.1016/0304-3959(92)90195-H. [DOI] [PubMed] [Google Scholar]
- McQuay HJ, Tramer M, Nye BA, Carroll D, Wiffen PJ, Moore RA. A systematic review of antidepressants in neuropathic pain. Pain. 1996;68:217–227. doi: 10.1016/s0304-3959(96)03140-5. [DOI] [PubMed] [Google Scholar]
- Nickola TJ, Ignatowski TA, Reynolds JL, Spengler RN. Antidepressant drug- induced alterations in neuron-localized tumor necrosis factor-α mRNA and α2-adrenergic receptor sensitivity. J Pharmacol Exp Ther. 2001;297:680–687. [PubMed] [Google Scholar]
- Nickola TJ, Ignatowski TA, Spengler RN. Antidepressant drug administration modifies the interactive relationship between α2-adrenergic sensitivity and levels of TNF in the rat brain. J Neuroimmunol. 2000;107:50–58. doi: 10.1016/s0165-5728(00)00244-7. [DOI] [PubMed] [Google Scholar]
- Oka T, Wakugawa Y, Hosoi M, Oka K, Hori T. Intracerebroventricular injection of tumor necrosis factor-alpha induces thermal hyperalgesia in rats. Neuroimmunomodulation. 1996;3:135–140. doi: 10.1159/000097238. [DOI] [PubMed] [Google Scholar]
- Otsuka N, Kiuchi Y, Yokogawa F, Masuda Y, Oguchi K, Hosoyamada A. Antinociceptive efficacy of antidepressants: assessment of five antidepressants and four monoamine receptors in rats. J Anesth. 2001;15:154–158. doi: 10.1007/s005400170018. [DOI] [PubMed] [Google Scholar]
- Paalzow L. Analgesia produced by clonidine in mice and rats. J Pharm Pharmacol. 1974;26:361–363. doi: 10.1111/j.2042-7158.1974.tb09291.x. [DOI] [PubMed] [Google Scholar]
- Parale MP, Kulkarni SK. Clonidine-induced behavioral despair in mice: reversal by antidepressants. Psychopharmacology. 1986;89:171–174. doi: 10.1007/BF00310623. [DOI] [PubMed] [Google Scholar]
- Paxinos G, Watson C. The rat brain in stereotaxic coordinates. Academic Press; New York: 1996. [DOI] [PubMed] [Google Scholar]
- Pertovaara A. Antinociception induced by alpha-2-adrenoceptor agonists, with special emphasis on medetomidine studies. Prog Neurobiol. 1993;40:691–709. doi: 10.1016/0301-0082(93)90011-g. [DOI] [PubMed] [Google Scholar]
- Pollock VP, Lofthouse EJ, Jupp OJ, Gauld SB, Anderson HM, MacEwan DJ. Selective down-regulation of the G(q)alpha/G11alpha G-protein family in tumor necrosis factor-alpha induced cell death. Mol Cell Biochem. 2000;206:67–74. doi: 10.1023/a:1007066409645. [DOI] [PubMed] [Google Scholar]
- Reddy SVR, Maderdrut JL, Yaksh TL. Spinal cord pharmacology of adrenergic agonist-mediated antinociception. J Pharmacol Exp Ther. 1980;213:525–533. [PubMed] [Google Scholar]
- Reithman C, Giershcik P, Jakons KH, Werden K. Regulation of adenylyl cyclase by noradrenaline and tumor necrosis factor alpha in rat cardiomyocytes. Eur Heart J. 1991;12F:139–142. doi: 10.1093/eurheartj/12.suppl_f.139. [DOI] [PubMed] [Google Scholar]
- Renauld AE, Spengler RN. Tumor necrosis factor expressed by primary hippocampal neurons and SH-SY5Y cells is regulated by α2-adrenergic receptor activation. J Neurosci Res. 2002;67:264–274. doi: 10.1002/jnr.10101. [DOI] [PubMed] [Google Scholar]
- Reynolds JL, Ignatowski TA, Gallant S, Spengler RN. Amitriptyline administration transforms tumor necrosis factor-alpha regulation of norepinephrine release in the brain. Brain Res. 2004a;1023:112–120. doi: 10.1016/j.brainres.2004.07.028. [DOI] [PubMed] [Google Scholar]
- Reynolds JL, Ignatowski TA, Spengler RN. Effect of tumor necrosis factor- α on the reciprocal G-protein-induced regulation of norepinephrine release by the α2-adrenergic receptor. J Neurosci Res. 2005a;79:779–787. doi: 10.1002/jnr.20407. [DOI] [PubMed] [Google Scholar]
- Reynolds JL, Ignatowski TA, Sud R, Spengler RN. Brain-derived tumor necrosis factor-alpha and its involvement in noradrenergic neuron functioning involved in the mechanism of action of an antidepressant. J Pharmacol Exp Ther. 2004b;310:1216–1225. doi: 10.1124/jpet.104.067835. [DOI] [PubMed] [Google Scholar]
- Reynolds JL, Ignatowski TA, Sud R, Spengler RN. An antidepressant mechanism of desipramine is to decrease tumor necrosis factor-α production culminating in increases in noradrenergic neurotransmission. Neuroscience. 2005b;133:519–531. doi: 10.1016/j.neuroscience.2005.02.023. [DOI] [PubMed] [Google Scholar]
- Scheinin M, Lomasney JW, Hayden-Hixson DM, Schambra UB, Caron MG, Lefkowitz RJ, Fremeau RTJ. Distribution of alpha 2-adrenergic receptor subtype gene expression in rat brain. Brain Res Mol Brain Res. 1994;21:133–149. doi: 10.1016/0169-328x(94)90386-7. [DOI] [PubMed] [Google Scholar]
- Scherzer JA, Lin Y, McLeish KR, Klein JB. TNF translationally modulates the expression of Gi protein alpha(i2) subunits in human polymorphonuclear leukocytes. J Immunol. 1997;158:913–918. [PubMed] [Google Scholar]
- Sluka KA, Chandran P. Enhanced reduction in hyperalgesia by combined administration of clonidine and TENS. Pain. 2002;100:183–190. doi: 10.1016/s0304-3959(02)00294-4. [DOI] [PubMed] [Google Scholar]
- Tasker RAR, Melzack R. Different alpha-receptor subtypes are involved in clonidine-produced analgesia in different pain tests. Life Sci. 1989;44:9–17. doi: 10.1016/0024-3205(89)90212-9. [DOI] [PubMed] [Google Scholar]
- Tura B, Tura SM. The analgesic effect of tricyclic antidepressants. Brain Res. 1990;518:19–22. doi: 10.1016/0006-8993(90)90948-b. [DOI] [PubMed] [Google Scholar]
- Xie W, Liu X, Xuan H, Luo S, Zhao X, Zhou Z, Xu J. Effect of betamethasone on neuropathic pain and cerebral expression of NF-κB and cytokines. Neurosci Lett. 2006;393:255–259. doi: 10.1016/j.neulet.2005.09.077. [DOI] [PubMed] [Google Scholar]
- Yaksh TL. Pharmacology of spinal adrenergic systems which modulate spinal nociceptive processing. Pharmacol Biochem Behav. 1985;22:845–858. doi: 10.1016/0091-3057(85)90537-4. [DOI] [PubMed] [Google Scholar]