

Abstract
Aquaporin-9, an aquaglyceroporin present in diverse tissues, is unique among aquaporins because it is not only permeable to water, urea and glycerol, but also allows passage of larger uncharged solutes. Single particle analysis of negatively stained recombinant rat aquaporin-9 revealed a particle size characteristic of the tetrameric organization of all members of the aquaporin family. Reconstitution of aquaporin-9 into two-dimensional crystals enabled us to calculate a projection map at 7 Å resolution. The projection structure indicates a tetrameric structure, similar to GlpF, with each square-like monomer forming a pore. A comparison of the pore-lining residues between the crystal structure of GlpF and a homology model of aquaporin-9 locates substitutions in these residues predominantly to the hydrophobic edge of the tripathic pore of GlpF, providing first insights into the structural basis for the broader substrate specificity of aquaporin-9.
Keywords: Two-dimensional crystal, aquaporin-9, electron crystallography, membrane protein, projection structure
Introduction
Aquaporins are subdivided into two classes depending on whether they only conduct water (aquaporins) or also allow passage of small neutral solutes such as glycerol across the membrane (aquaglyceroporins). All members of the aquaporin family are impermeable to protons, thereby preserving transmembrane proton gradients. Aquaporin-9 (AQP9) was first identified in adipose tissue 1 and liver 2, but has now also been found in many other tissues (e.g., lung, pancreas, testis, central nervous system, retina, thyroid gland, intestines and anterior pituitary 3). The brain expresses two AQP9 isoforms; the shorter, 25 kDa AQP9 isoform is an alternative splice form of the 32 kDa protein found in liver and is expressed in brain mitochondria 4. While this study hypothesized that mitochondrial AQP9 in brain cells may also play a role in Parkinson’s disease, a recent study provided evidence against functionally significant AQP expression in mitochondria 5. AQP9 is unique among aquaporins, because it has broader substrate specificity than any other known member of this family. Expression of AQP9 in Xenopus oocytes has shown it to be permeable not only to water, glycerol and urea but also to polyols, carbamides, purines, pyrimidines, nucleosides and monocarboxylates 6. AQP9 is also one of only two mammalian AQPs known to be permeable to arsenite and might thus contribute to the toxicity of arsenic ingestion 7. Since AQP9 is expressed in myeloid and lymphoid leukemia cell lines, AQP9 is also likely to contribute to the efficacy of arsenite as a chemotherapeutic agent for acute promyelocytic leukemia 8.
The atomic structures of seven aquaporins have been published to date. Six structures of pure water pores, those of red blood cell AQP1 9–11, E. coli water pore AQPZ 12, lens-specific sheep AQP0 13; 14, rat AQP415, plant aquaporin SoPiP2;1 16 and archaeabacterial AQPM 17, but only one of an aquaglyceroporin, the E. coli glycerol facilitator GlpF 18; 19. All aquaporins assemble into tetramers, with each monomer forming an independent pore. They share the same fold consisting of two tandem repeats that sit in the membrane in opposite orientations. The first repeat contains helices 1 to 3 and reentrant loop B and the second repeat is formed by helices 4 to 6 and reentrant loop E. The two reentrant loops contain the aquaporin signature motif Asn-Pro-Ala (NPA) and form short pore-lining α -helices, named HB and HE. The first atomic model of an aquaporin, AQP1 9, already revealed the mechanism used by aquaporins to prevent proton conduction, which is based on the two NPA motifs and the opposing electrostatic fields of the two pore helices HB and HE. The proton exclusion mechanism was subsequently further refined using molecular dynamics simulations (e.g. 19–22). Using the crystal structures of the E. coli water pore AQPZ 12 and the E. coli glycerol facilitator GlpF 18, a molecular dynamics approach was also recently used to pinpoint the structural features that determine whether an aquaporin pore is permeable to glycerol or not 23. Once a structure for AQP9 is determined, the same approach should also be useful to elucidate why this aquaglyceroporin can have such a broad substrate specificity while still preventing proton conduction. In this study, we present the first structural data for AQP9 and provide an initial explanation why AQP9 may accommodate conduction of larger solutes than any other aquaglyceroporins characterized to date.
Results
Protein expression and purification
Recombinant rat AQP9 (295 amino acids) was purified in octyl-β ,D-glucopyranoside (OG). On a silver-stained SDS PAGE gel, the majority of AQP9 runs as a monomer, but traces of dimers and tetramers are also present (Figure 1(a), lane 1). The identities of the dimer and tetramer bands were confirmed by immunoaffinity blots using anti-His-tag antibodies. The AQP9 monomer runs as a double band with apparent molecular weights of ~32 kDa and ~35 kDa. Incubation with N-glycosidase F (PNGase F) eliminated the ~35 kDa band (Figure 1(a), lane 2), showing that it contains the N-glycosylated form of AQP9. The likely glycosylation site is Asn142 in loop C, which is part of an N-glycosylation consensus sequence, Asn-Xaa-Ser/Thr. This differs from AQP1, in which the glycosylation site is located in loop A 24.
Figure 1.
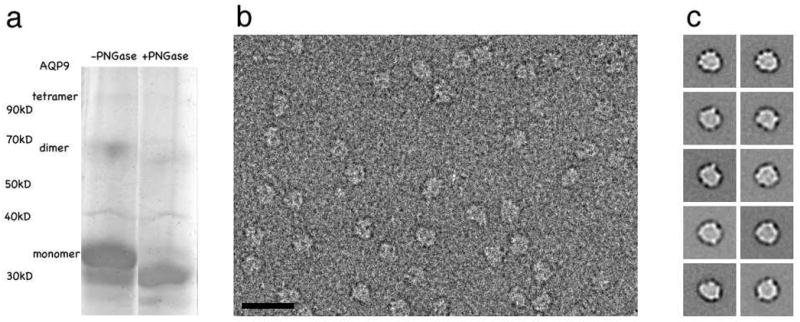
Protein purification and single particle EM analysis. (a) Silver stained 10% SDS PAGE gel of purified recombinant rat AQP9 before (lane 1) and after deglycosylation with PNGase F (lane 2). (b) Image of negatively stained AQP9 showing that the OG-solubilized particles are mono-dispersed and homogeneous in size. The scale bar is 100 nm. (c) Representative single particle averages. The side length of the individual panels is 50 nm.
Single particle electron microscopy analysis
We used single particle electron microscopy to assess the quality of our AQP9 preparations and the suitability of the recombinant protein for 2D crystallization trials. Electron micrographs of purified AQP9 negatively stained with uranyl formate showed mono-disperse particles that were homogenous in size (Figure 1(b)). To avoid interference with the staining of the protein, the detergent was removed from AQP9 adsorbed to the carbon film by washing the grid with five drops of deionized water prior to staining with uranyl formate. 6,220 particles were selected from 3 images and classified into 24 groups. Representative class averages shown in Figure 1(c) reveal a square shape with a side length of about 70 Å, which correlates well with the side length of 68 Å for AQP1 tetramers seen in 2D crystals (e.g. 25). As observed before with other AQP preparations, e.g. AQP1 26, only top views of AQP9 tetramers were seen in the class averages. The reason is that the protein presumably only adsorbs with its hydrophilic extramembranous moiety to the charged carbon film rather than with its hydrophobic detergent-covered transmembrane moiety. The single particle analysis indicated that AQP9 has the same tetrameric organization characteristic of all members of the aquaporin family and the preparations were suitable for 2D crystallization trials.
Two-dimensional crystallization
We reconstituted AQP9 into 2D crystals. While AQP9 could be reconstituted into lipid membranes with POPC (1-palmitoyl-2-oleoyl-sn-glycero-3-phosphocholine), DOPC (1,2-dioleoyl-sn-glycero-3-phosphocholine) and E. coli total lipid extract, the best ordered 2D crystals were formed with DMPC (1,2-dimyristoyl-sn-glycero-3-phosphocholine). Deglycosylation of AQP9 did not have a noticeable effect on the order of the resulting 2D arrays, and 2D crystallization trials were therefore continued with glycosylated AQP9. To obtain well-ordered crystals, it proved essential to remove the His-tag. Magnesium and calcium ions promoted formation of 2D crystals. Calcium was used for further 2D crystallization trials, because it resulted in crystals that were better ordered than those grown in the presence of magnesium. The best 2D crystals were obtained by dialyzing the protein-lipid mixture against a buffer containing 20 mM MES (pH 6), 150 mM NaCl, 50 mM CaCl2 and 1 mM dithiothreitol (Figure 2(a) and (b)). Initial crystallization trials were carried out at a final protein concentration in the reconstitution mixture of 1 mg/ml, later screens were performed at a protein concentration of 3 mg/ml, which increased the size of the formed arrays.
Figure 2.
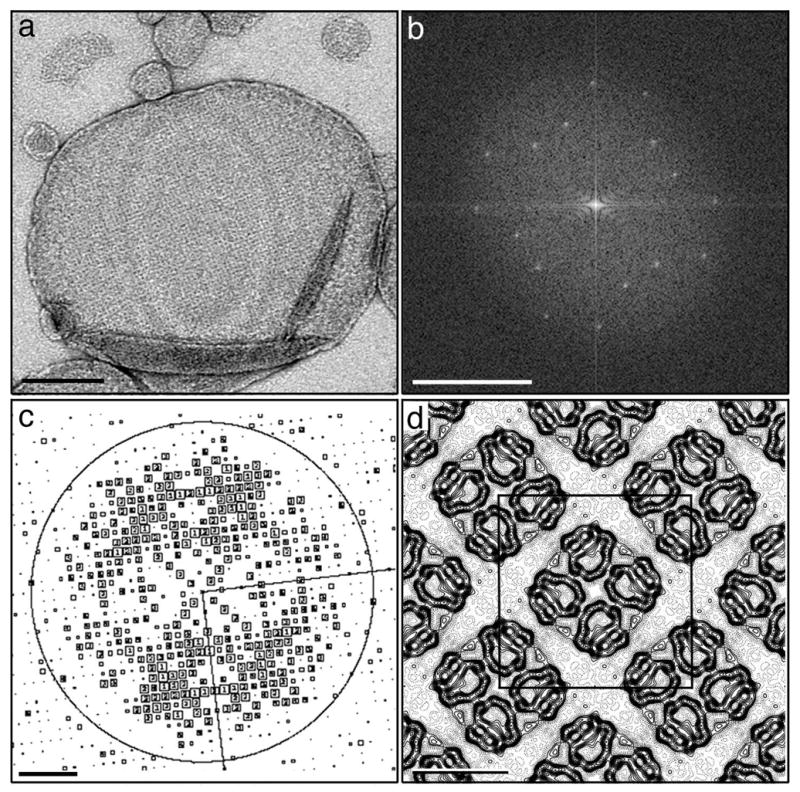
Analysis of AQP9 2D crystals. (a) The image of a negatively stained AQP9 2D crystal clearly reveals the square crystal lattice. Scale bar is 200 nm. (b) Fourier transform of the image shown in (a). Scale bar is 5 nm−1. (c) CTF plot of an image of a glucose-embedded 2D crystal. The circles represent CTF zero transitions and the boxed numbers depict the IQ values of the individual reflections as defined by 37. Scale bar is 1.7 nm−1. (d) p4212-symmetrized projection map of AQP9 at 7 Å resolution. A unit cell, lattice dimensions a = b = 103.0 Å, γ = 90º, contains two AQP9 tetramers and is outlined in black. Scale bar is 50 nm.
Projection map
AQP9 2D crystals were embedded in glucose and low-dose images were collected at liquid nitrogen temperature. The quality of the images was assessed by optical diffraction, and high-quality images (with no signs of specimen drift or charging) that showed diffraction spots beyond a resolution of 10 Å were selected for further image processing. After unbending and correction for the contrast transfer function (CTF), CTF plots typically showed good completeness of diffraction data to 7 Å resolution, and occasionally some strong diffraction spots to a resolution beyond 5 Å (Figure 2(c)). The AQP9 2D crystals have unit cell dimensions of a = b = 103 ± 1 Å and γ = 90º (n = 9) and display p4212 symmetry (Table 1). The amplitude and phase data from the best six images were merged to 7 Å resolution (Table 2) while applying p4212 symmetry. The final projection map of glucose-embedded AQP9 is shown in Figure 2(d). The projection map shows that a unit cell of the AQP9 2D crystals (outlined in black in Figure 2(d)) contains two tetramers that are incorporated into the membrane in opposite orientations.
Table 1.
Internal phase residuals of all possible two-sided plane groups using the image shown in Figure 2(c).
| Two-sided plane group | Phase residual (degrees)a | Number of comparisons | Target residual (degrees)b |
|---|---|---|---|
| p1 | 20.1 c | 254 | |
| p 2 | 35.1 e | 127 | 29.0 |
| p12_b | 80.1 | 109 | 20.5 |
| p12_a | 76.7 | 108 | 20.4 |
| p121_b | 30.9 | 109 | 20.5 |
| p121_a | 18.2 f | 108 | 20.4 |
| c12_b | 80.1 | 109 | 20.5 |
| c12_a | 76.7 | 108 | 20.4 |
| p222 | 62.5 | 344 | 23.3 |
| p2221b | 61.0 | 344 | 23.3 |
| p2221a | 63.7 | 344 | 23.3 |
| p22121 | 28.5d | 344 | 23.3 |
| c222 | 62.5 | 344 | 23.3 |
| p4 | 26.9 d | 347 | 23.3 |
| p422 | 55.0 | 777 | 21.5 |
| p4212 | 24.9 d | 777 | 21.5 |
Internal phase residuals were determined using the program ALLSPACE 34 from spots of IQ1 to IQ5 to 7Å resolution. Only plane groups compatible with the AQP9 lattice are shown.
Phase residual versus other spots (90° random).
Target residual based on statistics taking Friedel weight into account.
Note that in space group p1 no phase comparison is possible, so the numbers given here are theoretical phase residuals based on the signal-to-noise ratio of the observed diffraction spots.
Within 20% of target residual.
Within 30% of target residual.
Symmetry that yields a residual better than the target residual.
Table 2.
Phase residuals in resolution shells.
| Resolution shell (Å) | |||||
|---|---|---|---|---|---|
| From | To | Number of phases | Mean value of Δα c (deg.) | Standard error (deg.) | Mean figure of merit |
| 100 | 9.9 | 45 | 12.6 | 3.1 | 0.92 |
| 9.8 | 7.0 | 41 | 22.2 | 3.8 | 0.85 |
| 7.0 | 5.7 | 40 | 28.4 | 4.3 | 0.75 |
c, Difference between the symmetry-imposed phase of 0° and 180° and the observed combined phase. 45° is random.
Electron diffraction
Most of the AQP9 2D crystals were vesicular, and larger vesicles tended to fold on themselves on the carbon film, reducing the useful crystalline area for structure analysis. Occasionally, AQP9 also formed single-layered crystalline sheets, which are particularly well suited to collect electron diffraction data. An electron diffraction pattern recorded from a glucose-embedded 2D crystalline sheet is shown in Figure 3. Sharp diffraction spots can be seen to a resolution of about 3.8 Å without background subtraction. The crystalline AQP9 sheets are currently not much larger than 500 nm. While this size suffices to collect diffraction patterns from untilted specimens, the crystals are currently too small to collect diffraction patterns from highly tilted specimens.
Figure 3.

Electron diffraction of an AQP9 2D crystal. The diffraction pattern was recorded from a glucose-embedded crystal and shows diffraction spots to a resolution of about 3.8 Å. Scale bar is 1 nm−1.
Discussion
The sequence identity among water-specific aquaporins and among glycerol-conducting aquaporins is higher than 35%, whereas the sequence identity in between members of the two subgroups is generally less than 30%. This difference at the level of sequence identity is reflected in the projection structures of aquaporins; the projection map of the AQP9 tetramer (Figure 4(a)) resembles more that of the E. coli glycerol facilitator GlpF 27 (Figure 4(b)) than to those of pure water pores, such as AQP1 (e.g. 25) or AQP0 28 (Figure 4(c)). Projections of the GlpF and AQP9 monomers have a squarish overall shape, whereas projections of monomers of pure water pores appear more wedge-shaped. The protein density in each monomer encloses a pore. GlpF has a larger pore compared to those in pure aquaporins 29, and our 7 Å projection map suggests that the pore in AQP9 is similar to the pore in GlpF. The round GlpF pore has a diameter of about 7 Å. Our AQP9 projection map shows an oval pore with approximate dimensions of 7 Å by 12 Å. The apparent enlargement of the AQP9 pore is due to a region of lower density that emanates from the round pore seen in GlpF (marked by an asterisk in Figure 4(a)), which may explain the permeability of AQP9 for bulkier solutes.
Figure 4.
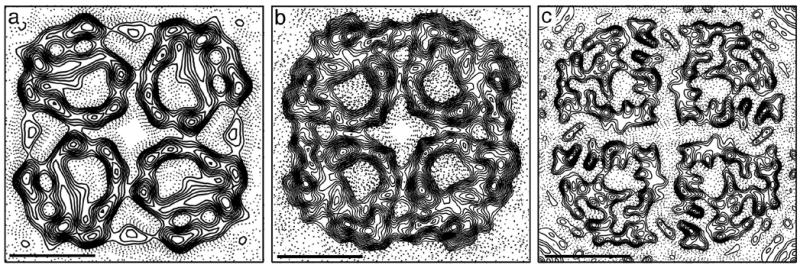
Projection maps of different aquaporins. (a) Projection structure of the AQP9 tetramer at 7 Å resolution. Asterisk indicates the weaker density of the AQP9 pore as compared to the pore in GlpF. (b) Projection structure of GlpF at 3.7 Å resolution. Reprinted with permission from 27. (c) Projection structure of AQP0 at 4 Å resolution (adapted from 38). Scale bars are 25 nm.
We used the homology server Modeller to build a model of AQP9 based on the known GlpF structure (PDB id: 1LDA 19), which, among aquaporins of known three-dimensional (3D) structure, has the highest level of identity with AQP9 (38%). GlpF has been described to have a tripathic pore with one hydrophobic corner and two sides that have either hydrogen-bond donor or acceptor groups 29. If we compare the AQP9 homology model with the GlpF crystal structure, we find that the weaker density of the AQP9 pore seen in our projection map extends towards the hydrophobic face of the pore.
An interesting pattern emerged when we looked at a multiple sequence alignment of rat, human and mouse AQP9 with GlpF, AQP1, AQP0 and AQPZ, four of the aquaporins with known atomic structures (Figure 5). The pore residues (marked by P in Figure 5) that are conserved in the aligned aquaporin sequences (Gly 80, His 82, Asn 84, Asn 216 and Arg 219 in rat AQP9) all localized to the faces that present the hydrogen-bond donor and acceptor groups, predominantly in the center of the pore, specifically in loop B and pore helices HB and HE (Figure 6(a)). The residues that are only conserved in aquaglyceroporins but not in water-conducting aquaporins (Ile 60, Val 68, Leu 172, Ile 196, Ile 200, Gly 208, Gly 212, Ala 214 and Met 215) all lie in the center of the pore on the hydrophobic side of the channel and are part of helices 2, 4 and 5 and loop E (Figure 6(b)). Finally, residues that form part of the pore and are conserved among all the AQP9 homologs but are different in GlpF (Phe 64, Gly 81, Met 91, Val 176, Phe 180, Leu 209 and Cys 213) also fall into the hydrophobic face and are part of helices 2 and 4, loops B and E, and pore helix HB. Most of these substitutions are located close to the entrances of the pore (Figure 6(c)). By correlating the observed weaker density of the pore in our AQP9 projection map with the pattern of conserved residues in the aligned sequences, we can propose that the broader specificity found in AQP9 is related to changes in the hydrophobic face of the tripathic pore. These amino acid substitutions are located close to the openings of the pore and may thus allow larger solutes easier access to the pore. On the other hand, the central constricted region of the pore is conserved in all aquaporins, indicating that AQP9 uses the same proton exclusion mechanism as all the other aquaporins. For a larger solute to permeate the AQP9 constriction site may thus require a solute-induced change in this pore region similar but probably larger than the one seen in molecular dynamics simulations of glycerol permeating the GlpF pore 23.
Figure 5.
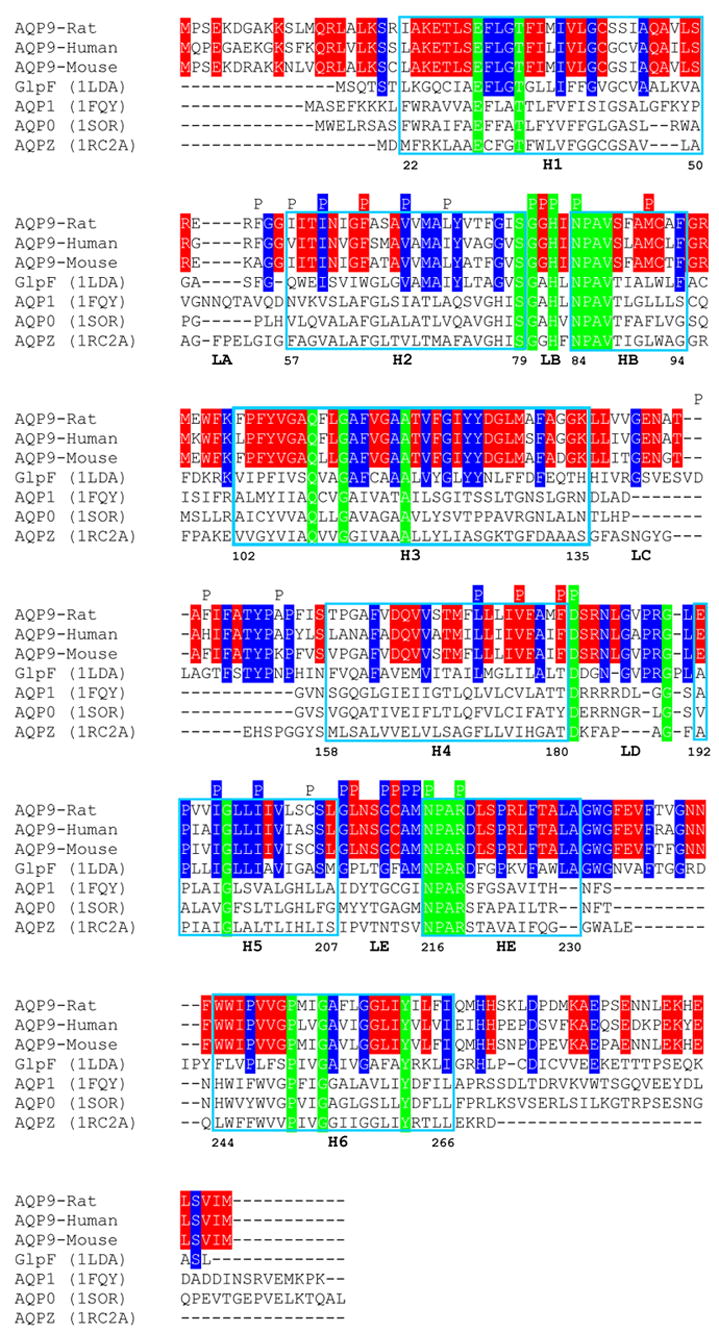
Multiple sequence alignment. Multiple sequence alignment of rat, human and mouse AQP9 with GlpF, AQP1, AQP0 and AQPZ (aquaporins with known 3D structures). Secondary structure assignments are shown according to the crystal structure of GlpF 18. Residue numbering follows the rat AQP9 sequence. Residues in red are conserved in all aquaporins, residues in green are only conserved in glycerol-conducting aquaporins, and residues in blue are only conserved in AQP9 homologs. Residues marked with a “P” form part of the pore in the GlpF structure, according to the program HOLE 39. A green “P” indicates a pore residue in GlpF that is conserved in all aquaporins, a blue “P” a pore residue in GlpF that is conserved in all aquaglyceroporins, a red “P” a pore residue in GlpF that is different from all the AQP9 sequences shown, and an uncolored “P” a pore residue in GlpF that is identical to one or two AQP9 sequences.
Figure 6.

Conservation of pore residues in aquaporins. (a)–(c) Conserved pore residues shown in a homology model for AQP9. Residues conserved in all aquaporins are shown in green (a), those only conserved in glycerol-conducting aquaporins in blue (b), and those that differ between GlpF and AQP9 homologs in red (c).
Our data provides a tentative explanation for how the AQP9 pore can have such broad solute specificity without compromising proton exclusion. Our electron diffraction data (Figure 3) showing reflections in unprocessed diffraction patterns to at least 3.8 Å resolution is a promising first step towards determining the structure of the first eukaryotic aquaglyceroporin at atomic resolution.
Materials and Methods
Protein expression and purification
A construct of an N-terminal 6x(His) tag separated from the rat AQP9 gene by a TEV cleavage site was expressed in Sf9 insect cells using the Bac-to-Bac baculovirus expression system (Invitrogen). Cells were harvested 48 hours after virus infection. Membranes were prepared as described in 30, and AQP9 was purified as described in 31 with some modifications. Briefly, membranes were washed with 2 M urea and alkaline buffer (pH 11) prior to solubilization with 5% (w/v) OG in 250 mM NaCl and 20 mM Tris (pH 8.5) for 15 min at 25ºC. After centrifugation at 100,000g for 45 min at 4ºC, the OG concentration of the supernatant was lowered to 2% (w/v) by dilution. Solubilized 6x(His)-tagged AQP9 was adsorbed overnight to Ni-NTA agarose at 4ºC. The resin was washed with 20 mM histidine and the protein eluted with 150 mM imidazole in 250 mM NaCl and 20 mM Tris (pH 8.5) for 2–4 hours at 4ºC. The His-tag was removed by digestion with TEV-protease and gel filtration chromatography prior to crystallization. One liter of Sf9 culture yielded approximately 0.1 mg of pure AQP9. His-tagged AQP9 was detected in a Western blot using anti-His-tag antibodies conjugated with peroxidase and developed with an enhanced chemiluminescence (ECL) kit (Amersham).
2D crystallization
AQP9 at concentrations ranging from 1 to 3 mg/ml was mixed with DMPC, DOPC, POPC, and E. coli total lipid extract (Avanti) at lipid to protein ratios (LPR) ranging from 0.4 to 1 (w/w). The mixtures were placed in 50 μ l dialysis buttons and dialyzed against 20 mM MES (pH 6), 150 mM NaCl, 50 mM CaCl2 and 1 mM dithiothreitol at 25ºC for 7 days with daily buffer exchanges. The best crystals were obtained with an LPR of 0.4 to 0.6.
Electron microscopy
OG-solubilized AQP9 was prepared by the conventional negative staining protocol described in 32. Images were taken with a FEI Tecnai T12 electron microscope equipped with a LaB6 filament and operated at 120 kV. Images were taken at a magnification of 52,000x on Kodak SO-163 film using low-dose procedures. Images were developed for 12 minutes with full-strength Kodak D-19 developer at 20°C.
AQP9 2D crystals were adsorbed to a thin carbon film on a molybdenum grid and quickly frozen in the presence of 20% glucose and transferred to a Gatan cryo-transfer holder. Images were taken with an FEI Tecnai F20 electron microscope equipped with a field emission gun and operated at 200 kV. Images were taken at a magnification of 50,000x on Kodak SO-163 film using low-dose procedures and developed as described above. The image quality and the order of the 2D crystals was assessed with a JEOL JFO-3000 laser diffractometer, and only drift-free images showing diffraction spots beyond 10 Å resolution were used for further analysis.
Image processing
For the single particle EM analysis, micrographs were digitized with a Zeiss SCAI scanner using a step size of 7 μ m. The digitized images were further binned over 3 x 3 pixels to give a final pixel size of 4.04 Å/pixel at the specimen level. 6,220 particles were selected interactively with WEB, the display program associated with the SPIDER software package 33, and windowed into 64 x 64 pixel images. The particles were subjected to 10 cycles of multi-reference alignment and K-means classification into 24 classes.
The micrographs of the AQP9 2D crystals were digitized with a Zeiss SCAI scanner using a step size of 7 μ m and processed with the MRC software package 34, as described in 25. The six best images were merged and used to calculate a projection map with imposed p4212 symmetry. A negative temperature factor of −500 was applied to the projection map to enhance the high-resolution Fourier terms.
Sequence alignment and homology modeling
Multiple sequence alignment of rat, human and mouse AQP9 with the sequences of aquaporins of known 3D structure was calculated with t-coffee 35 with the option to consider the structural alignment for calculations. To calculate a homology model of rat AQP9, we used the CPHmodels 2.0 Server 36.
Acknowledgments
We acknowledge contributions by Dr. Matthias Hediger and Dr. Ingeborg Schmidt-Krey during the early stages of this project. The authors wish to thank Dr. Stephen C. Harrison for continuous support and advice. This work was supported by NIH grant GM62580 (to T.W.). H.V. was a fellow of the Damon-Runyon Cancer Research Fund.
Footnotes
Publisher's Disclaimer: This is a PDF file of an unedited manuscript that has been accepted for publication. As a service to our customers we are providing this early version of the manuscript. The manuscript will undergo copyediting, typesetting, and review of the resulting proof before it is published in its final citable form. Please note that during the production process errors may be discovered which could affect the content, and all legal disclaimers that apply to the journal pertain.
References
- 1.Kuriyama H, Kawamoto S, Ishida N, Ohno I, Mita S, Matsuzawa Y, Matsubara K, Okubo K. Molecular cloning and expression of a novel human aquaporin from adipose tissue with glycerol permeability. Biochem Biophys Res Commun. 1997;241:53–58. doi: 10.1006/bbrc.1997.7769. [DOI] [PubMed] [Google Scholar]
- 2.Tsukaguchi H, Shayakul C, Berger UV, Mackenzie B, Devidas S, Guggino WB, van Hoek AN, Hediger MA. Molecular characterization of a broad selectivity neutral solute channel. J Biol Chem. 1998;273:24737–24743. doi: 10.1074/jbc.273.38.24737. [DOI] [PubMed] [Google Scholar]
- 3.Li C, Hirooka Y, Honda R, Morikawa R, Yatoh M, Gotoh M, Nogimori T. Distribution of aquaporin-9 in the rat: an immunohistochemical study. Int J Tissue React. 2005;27:51–58. [PubMed] [Google Scholar]
- 4.Amiry-Moghaddam M, Lindland H, Zelenin S, Roberg BA, Gundersen BB, Petersen P, Rinvik E, Torgner IA, Ottersen OP. Brain mitochondria contain aquaporin water channels: evidence for the expression of a short AQP9 isoform in the inner mitochondrial membrane. Faseb J. 2005;19:1459–1467. doi: 10.1096/fj.04-3515com. [DOI] [PubMed] [Google Scholar]
- 5.Yang B, Zhao D, Verkman AS. Evidence against functionally significant aquaporin expression in mitochondria. J Biol Chem. 2006;281:16202–16206. doi: 10.1074/jbc.M601864200. [DOI] [PubMed] [Google Scholar]
- 6.Tsukaguchi H, Weremowicz S, Morton CC, Hediger MA. Functional and molecular characterization of the human neutral solute channel aquaporin-9. Am J Physiol. 1999;277:F685–696. doi: 10.1152/ajprenal.1999.277.5.F685. [DOI] [PubMed] [Google Scholar]
- 7.Liu Z, Shen J, Carbrey JM, Mukhopadhyay R, Agre P, Rosen BP. Arsenite transport by mammalian aquaglyceroporins AQP7 and AQP9. Proc Natl Acad Sci U S A. 2002;99:6053–6058. doi: 10.1073/pnas.092131899. [DOI] [PMC free article] [PubMed] [Google Scholar]
- 8.Leung J, Pang A, Yuen WH, Kwong YL, Tse EW. Relationship of expression of aquaglyceroporin 9 with arsenic uptake and sensitivity in leukemia cells. Blood. 2006 doi: 10.1182/blood-2006-04-019588. Epub ahead of print. [DOI] [PubMed] [Google Scholar]
- 9.Murata K, Mitsuoka K, Hirai T, Walz T, Agre P, Heymann JB, Engel A, Fujiyoshi Y. Structural determinants of water permeation through aquaporin-1. Nature. 2000;407:599–605. doi: 10.1038/35036519. [DOI] [PubMed] [Google Scholar]
- 10.Sui H, Han BG, Lee JK, Walian P, Jap BK. Structural basis of water-specific transport through the AQP1 water channel. Nature. 2001;414:872–878. doi: 10.1038/414872a. [DOI] [PubMed] [Google Scholar]
- 11.Ren G, Reddy VS, Cheng A, Melnyk P, Mitra AK. Visualization of a water-selective pore by electron crystallography in vitreous ice. Proc Natl Acad Sci U S A. 2001;98:1398–1403. doi: 10.1073/pnas.041489198. [DOI] [PMC free article] [PubMed] [Google Scholar]
- 12.Savage DF, Egea PF, Robles-Colmenares Y, O'Connell JD, 3rd, Stroud RM. Architecture and selectivity in aquaporins: 2.5 Å X-ray structure of aquaporin Z. PLoS Biol. 2003;1:E72. doi: 10.1371/journal.pbio.0000072. [DOI] [PMC free article] [PubMed] [Google Scholar]
- 13.Gonen T, Sliz P, Kistler J, Cheng Y, Walz T. Aquaporin-0 membrane junctions reveal the structure of a closed water pore. Nature. 2004a;429:193–197. doi: 10.1038/nature02503. [DOI] [PubMed] [Google Scholar]
- 14.Harries WE, Akhavan D, Miercke LJ, Khademi S, Stroud RM. The channel architecture of aquaporin 0 at a 2.2-Å resolution. Proc Natl Acad Sci U S A. 2004;101:14045–14050. doi: 10.1073/pnas.0405274101. [DOI] [PMC free article] [PubMed] [Google Scholar]
- 15.Hiroaki Y, Kazutoshi T, Kamegawa A, Gyobo N, Nishikawa K, Suzuki H, Walz T, Sasaki S, Mitsuoka K, Kimura K, Mizoguchi A, Fujiyoshi Y. Implications of the aquaporin-4 structure on array formation and cell adhesion. J Mol Biol. 2006;355:628–639. doi: 10.1016/j.jmb.2005.10.081. [DOI] [PubMed] [Google Scholar]
- 16.Tornroth-Horsefield S, Wang Y, Hedfalk K, Johanson U, Karlsson M, Tajkhorshid E, Neutze R, Kjellbom P. Structural mechanism of plant aquaporin gating. Nature. 2006;439:688–694. doi: 10.1038/nature04316. [DOI] [PubMed] [Google Scholar]
- 17.Lee JK, Kozono D, Remis J, Kitagawa Y, Agre P, Stroud RM. Structural basis for conductance by the archaeal aquaporin AqpM at 1.68 Å. Proc Natl Acad Sci U S A. 2005;102:18932–18937. doi: 10.1073/pnas.0509469102. [DOI] [PMC free article] [PubMed] [Google Scholar]
- 18.Fu D, Libson A, Miercke LJ, Weitzman C, Nollert P, Krucinski J, Stroud RM. Structure of a glycerol-conducting channel and the basis for its selectivity. Science. 2000;290:481–486. doi: 10.1126/science.290.5491.481. [DOI] [PubMed] [Google Scholar]
- 19.Tajkhorshid E, Nollert P, Jensen MO, Miercke LJ, O'Connell J, Stroud RM, Schulten K. Control of the selectivity of the aquaporin water channel family by global orientational tuning. Science. 2002;296:525–530. doi: 10.1126/science.1067778. [DOI] [PubMed] [Google Scholar]
- 20.de Groot BL, Frigato T, Helms V, Grubmuller H. The mechanism of proton exclusion in the aquaporin-1 water channel. J Mol Biol. 2003;333:279–293. doi: 10.1016/j.jmb.2003.08.003. [DOI] [PubMed] [Google Scholar]
- 21.Chakrabarti N, Tajkhorshid E, Roux B, Pomes R. Molecular basis of proton blockage in aquaporins. Structure. 2004;12:65–74. doi: 10.1016/j.str.2003.11.017. [DOI] [PubMed] [Google Scholar]
- 22.Ilan B, Tajkhorshid E, Schulten K, Voth GA. The mechanism of proton exclusion in aquaporin channels. Proteins. 2004;55:223–228. doi: 10.1002/prot.20038. [DOI] [PubMed] [Google Scholar]
- 23.Wang Y, Schulten K, Tajkhorshid E. What makes an aquaporin a glycerol channel? A comparative study of AqpZ and GlpF. Structure. 2005;13:1107–1118. doi: 10.1016/j.str.2005.05.005. [DOI] [PubMed] [Google Scholar]
- 24.Preston GM, Jung JS, Guggino WB, Agre P. Membrane topology of aquaporin CHIP. Analysis of functional epitope-scanning mutants by vectorial proteolysis. J Biol Chem. 1994;269:1668–1673. [PubMed] [Google Scholar]
- 25.Walz T, Typke D, Smith BL, Agre P, Engel A. Projection map of aquaporin-1 determined by electron crystallography. Nat Struct Biol. 1995;2:730–732. doi: 10.1038/nsb0995-730. [DOI] [PubMed] [Google Scholar]
- 26.Walz T, Smith BL, Agre P, Engel A. The three-dimensional structure of human erythrocyte aquaporin CHIP. EMBO J. 1994b;13:2985–2993. doi: 10.1002/j.1460-2075.1994.tb06597.x. [DOI] [PMC free article] [PubMed] [Google Scholar]
- 27.Braun T, Philippsen A, Wirtz S, Borgnia MJ, Agre P, Kuhlbrandt W, Engel A, Stahlberg H. The 3.7 A projection map of the glycerol facilitator GlpF: a variant of the aquaporin tetramer. EMBO Rep. 2000;1:183–189. doi: 10.1093/embo-reports/kvd022. [DOI] [PMC free article] [PubMed] [Google Scholar]
- 28.Hasler L, Walz T, Tittmann P, Gross H, Kistler J, Engel A. Purified lens major intrinsic protein (MIP) forms highly ordered tetragonal two-dimensional arrays by reconstitution. J Mol Biol. 1998;279:855–864. doi: 10.1006/jmbi.1998.1796. [DOI] [PubMed] [Google Scholar]
- 29.Stroud RM, Miercke LJ, O'Connell J, Khademi S, Lee JK, Remis J, Harries W, Robles Y, Akhavan D. Glycerol facilitator GlpF and the associated aquaporin family of channels. Curr Opin Struct Biol. 2003a;13:424–431. doi: 10.1016/s0959-440x(03)00114-3. [DOI] [PubMed] [Google Scholar]
- 30.Doi T, Hiroaki Y, Arimoto I, Fujiyoshi Y, Okamoto T, Satoh M, Furuichi Y. Characterization of human endothelin B receptor and mutant receptors expressed in insect cells. Eur J Biochem. 1997;248:139–148. doi: 10.1111/j.1432-1033.1997.00139.x. [DOI] [PubMed] [Google Scholar]
- 31.Werten PJ, Hasler L, Koenderink JB, Klaassen CH, de Grip WJ, Engel A, Deen PM. Large-scale purification of functional recombinant human aquaporin-2. FEBS Lett. 2001;504:200–205. doi: 10.1016/s0014-5793(01)02703-x. [DOI] [PubMed] [Google Scholar]
- 32.Ohi M, Li Y, Cheng Y, Walz T. Negative Staining and Image Classification - Powerful Tools in Modern Electron Microscopy. Biol Proced Online. 2004;6:23–34. doi: 10.1251/bpo70. [DOI] [PMC free article] [PubMed] [Google Scholar]
- 33.Frank J, Radermacher M, Penczek P, Zhu J, Li Y, Ladjadj M, Leith A. SPIDER and WEB: processing and visualization of images in 3D electron microscopy and related fields. J Struct Biol. 1996;116:190–199. doi: 10.1006/jsbi.1996.0030. [DOI] [PubMed] [Google Scholar]
- 34.Crowther RA, Henderson R, Smith JM. MRC image processing programs. J Struct Biol. 1996;116:9–16. doi: 10.1006/jsbi.1996.0003. [DOI] [PubMed] [Google Scholar]
- 35.Notredame C, Higgins DG, Heringa J. T-Coffee: A novel method for fast and accurate multiple sequence alignment. J Mol Biol. 2000;302:205–217. doi: 10.1006/jmbi.2000.4042. [DOI] [PubMed] [Google Scholar]
- 36.Lund O, Nielsen M, Lundegaard C, Worning P. CASP5 conference 2002 [Google Scholar]
- 37.Henderson R, Baldin JM, Downing KH, Lepault J, Zemlin F. Structure of purple membrane from Halobacterium halobium: recording, measurement and evaluation of electron micrographs at 3.5 Å resolution. Ultramicroscopy. 1986;19:147–178. [Google Scholar]
- 38.Gonen T, Cheng Y, Kistler J, Walz T. Aquaporin-0 membrane junctions form upon proteolytic cleavage. J Mol Biol. 2004b;342:1337–1345. doi: 10.1016/j.jmb.2004.07.076. [DOI] [PubMed] [Google Scholar]
- 39.Smart OS, Goodfellow JM, Wallace BA. The pore dimensions of gramicidin A. Biophys J. 1993;65:2455–2460. doi: 10.1016/S0006-3495(93)81293-1. [DOI] [PMC free article] [PubMed] [Google Scholar]