

Abstract
The osteocyte, a terminally differentiated cell comprising 90%–95% of all bone cells1,2, may have multiple functions, including acting as a mechanosensor in bone (re)modeling3. Dentin matrix protein 1 (encoded by DMP1) is highly expressed in osteocytes4 and, when deleted in mice, results in a hypomineralized bone phenotype5. We investigated the potential for this gene not only to direct skeletal mineralization but also to regulate phosphate (Pi) homeostasis. Both Dmp1- null mice and individuals with a newly identified disorder, autosomal recessive hypophosphatemic rickets, manifest rickets and osteomalacia with isolated renal phosphate-wasting associated with elevated fibroblast growth factor 23 (FGF23) levels and normocalciuria. Mutational analyses showed that autosomal recessive hypophosphatemic rickets family carried a mutation affecting the DMP1 start codon, and a second family carried a 7-bp deletion disrupting the highly conserved DMP1 C terminus. Mechanistic studies using Dmp1-null mice demonstrated that absence of DMP1 results in defective osteocyte maturation and increased FGF23 expression, leading to pathological changes in bone mineralization. Our findings suggest a bone-renal axis that is central to guiding proper mineral metabolism.
Human disorders of phosphate (Pi) handling and skeletal mineralization can result from mutations in PHEX6, which cause X-linked hypophosphatemic rickets (XLH). A similar phenotype is also observed in Hyp mice, which have mutant Phex7 and show increased osteocyte expression of the phosphaturic factor FGF23 (ref. 8). Mutations in FGF23 that prevent its degradation also cause autosomal dominant hypophosphatemic rickets (ADHR)9. We identified two unrelated, consanguineous kindreds in which affected individuals originally presented with renal phosphate-wasting, rachitic changes and lower limb deformity. In family 1 (F1), there were three affected sisters (F1-1, F1-2 and F1-3), and in family 2 (F2), there was a single affected female (F2-1). The parents and siblings of these individuals did not show any clinical or biochemical evidence of the condition.
Individuals F1-1 and F1-3 presented with rickets and progressive lower limb deformity in late infancy, whereas sister F1-2 had rachitic changes on a chest X-ray at age 7 months. In contrast, F2-1 presented with a mild genu valgum at 8 years of age. The pre- or off-treatment age-related metabolic profiles for both kindreds were similar, characterized by hypophosphatemia owing to renal phosphate-wasting (serum Pi: 0.7–0.9 mmol/l, normal: 1.2–1.8; threshold maximum for renal tubular phosphate reabsorption/glomerular filtration rate (TmP/GFR): 0.61–0.81 mmol/l, lower limit of normal: ≥1.0), high normal to moderately elevated alkaline phosphatase, normal intact parathyroid hormone (PTH) levels (4.6–6.9 pmol/l, normal: 1.6–6.9), normocalcemia (ionized calcium: 1.16–1.18 mmol/l, normal: 1.1–1.3) and eucalciuria (urinary calcium-to-creatinine ratio: 0.19–0.33, normal: ≤ 0.6) (Supplementary Table 1 online). Serum 1,25 (OH)2D levels, available in three affected individuals, were inappropriately normal for the degree of hypophosphatemia when measured at >4 years (71–77 pmol/l, normal: 40–140). Resolution of rickets and normalization of alkaline phosphatase were observed during treatment with phosphate supplementation and calcitriol; however, the TmP/GFR remained low. Linear growth trajectories were heterogeneous among the affected individuals: affected individuals in F1 had a mid-parental height of 154.5 cm (5th–10th percentiles), with F1-1 and F1-2 measuring 153 cm (5th percentile) and 136.5 cm (<5th percentile) at final adult height, respectively. F1-3 had a height of 153.5 cm at 10 months post-menarche, well within the genetic target. The affected individual in F-2 had a final adult height of 172 cm (90th–95th percentile), 3 cm above the upper limit of her genetic target. In this family, both of the unaffected male siblings were in the upper range of their genetic target at final adult height. Biochemical studies obtained during adulthood showed persistent renal phosphate-wasting, as follows: F1-1, age 21 years, serum Pi 0.8: mmol/l (normal: 1.0–1.7), TmP/GFR: 0.62 (lower limit of normal: ≥0.8 mmol/l); F2-1, age 32 years, serum Pi: 0.7 mmol/l (normal: 0.9–1.5), TmP/GFR: 0.56 (lower limit of normal: ≥0.8 mmol/l). Both families were negative for FGF23 and PHEX mutations. Thus, we designated these two kindreds preliminarily as having autosomal recessive hypophosphatemic rickets (ARHR); they were distinguished from individuals with hereditary hypophosphatemic rickets with hypercalciuria (HHRH) by the presence of eucalciuria.
Based on extended studies of the Dmp1-null mouse (see below), we undertook a candidate gene approach using direct sequence analyses (Fig. 1) to test the ARHR families for mutations in DMP1, a member of the ‘SIBLING’ family10 that is primarily expressed in mineralized tissues11,12. In the affected individuals in family 1, we detected a homozygous deletion of nucleotides 1484–1490 (1484–1490del) in DMP1 exon 6 (Fig. 1a) that resulted in a frameshift that replaced the conserved C-terminal 18 residues (YHNRPMGDQDDNDCQDGY) with 33 unrelated residues (TNPLGTKMTMTAKTAISISCPKKQ LSHKGVLGT). The affected individual in family 2 had a biallelic nucleotide substitution in the DMP1 start codon (ATG to GTG, or A1→G) (Fig. 1c) that resulted in substitution of the initial methionine with valine (M1V). This change resulted in predicted loss of the highly conserved 16-residue DMP1 signal sequence. These mutations segregated with the disorder in both kindreds (Fig. 1b,d), and neither DMP1 mutation was found in 206 control alleles. Mutational analyses of an additional 19 hypophosphatemic individuals negative for PHEX and FGF23 mutations, with no known history of consanguinity, did not uncover any disease-causing changes in DMP1. After transfecting HEK293 cells and protein blotting using an antibody to V5, we detected wild-type DMP1 carrying a C-terminal V5 tag in cellular lysates as well as secreted into the growth medium (Fig. 1e). In contrast, the 1484–1490del mutant was faint, yet detectable, in the cellular lysates and was highly elevated in the medium. The M1V protein was wholly retained within the cells, consistent with loss of the signal peptide owing to translational initiation at an internal methionine (Fig. 1e).
Figure 1.
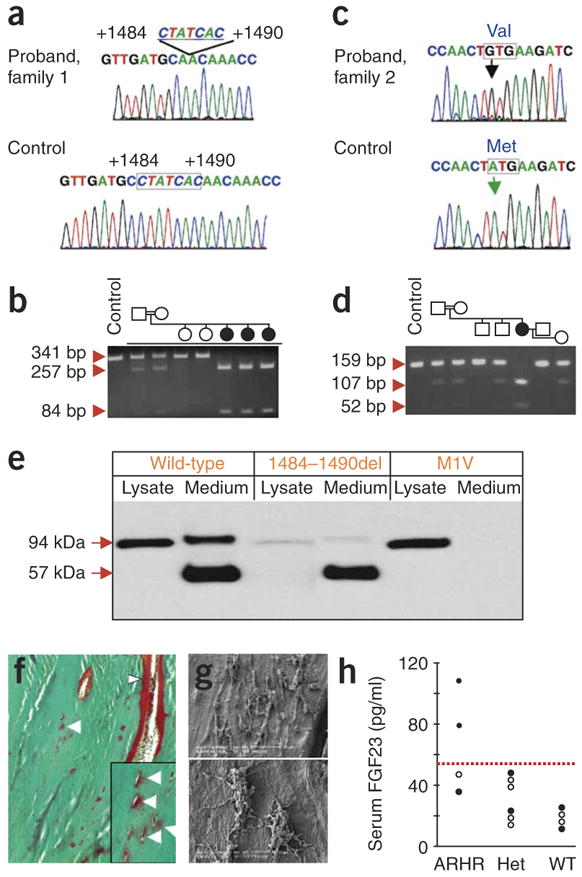
DMP1 mutations, osteomalacia and a defective osteocyte lacunocanalicular network in ARHR. (a) Family 1 had a biallelic deletion of nucleotides 1484–1490 in DMP1 exon 6 (missing nucleotides outlined). (b) The 1484–1490del segregates with the disorder, as assessed by RFLP, creating a new HpyCH4V site, which creates 257- and 84-bp fragments from the 341-bp exon 6 PCR product (circles: female; square: male, filled symbol: affected individuals; individuals F1-1, F1-2 and F1-3 are depicted chronologically from left to right). (c) Family 2 had a start codon mutation (A1→G) resulting in a methionine to valine change (M1V) not present in control individuals. (d) M1V segregates with the ARHR phenotype in family 2 and creates new 52-bp and 107-bp TaaI fragments from a 159-bp PCR product. (e) Wild-type (WT) and ARHR mutant DMP1 expression in HEK293 cells. Wild-type DMP1 was detected by protein blot analyses as a 94-kDa protein in the cellular lysates and as 94-kDa and 57-kDa polypeptides in the growth medium. The 1484–1490del mutant was primarily secreted as the 57-kDa form of DMP1, with fainter expression in the cellular lysates, whereas the M1V mutant was retained within the cell as the 94-kDa form of DMP1 and had no detectable signal in the medium. (f) Goldner staining indicates abundant osteoid (red) on bone edges (arrowheads) and surrounding osteocytes (arrows). (g) Resin-casted SEM images show osteocyte lacunae in a cluster (top), with few dendrites and rough surfaces (bottom). (h) Serum FGF23 levels: ARHR individuals compared with heterozygous (Het) and wild-type individuals. Filled circles: family 1; open circles: family 2. Dotted line represents upper limit of normal (54 pg/ml).
A transilial biopsy in individual F1-3 confirmed severe osteomalacia (osteoid thickness: 17.1 μm, normal: 5.9 ± 1.1 (s.d.); mineralization lag time: 56.3 d, normal: 14.1 ± 4.3 (s.d.)) and increased bone volume per tissue volume (43.2%, normal: 22.4 ± 4.2 (s.d.)). We observed excessive osteoid not only within cutting cones (arrow head) but also surrounding osteocyte lacunae (arrows) (Fig. 1f). The perilacunar hypomineralized regions were present mainly on the side of the lacunae oriented toward the central canal of the osteon. The osteocyte lacunocanalicular system was characterized by rough surfaces with few canaliculi (Fig. 1g). Serum FGF23 was elevated in two of the affected individuals, who were receiving calcitriol and phosphate therapy (Fig. 1h). Similar to XLH, serum FGF23 values in individuals with ARHR can overlap with the upper normal range13. Although the number of affected individuals we examined is low, the overlap of the FGF23 concentrations with the normal range could indicate that either or both of the mutated DMP1 gene products retain partial bioactivity.
It has been shown previously that DMP1 is highly expressed in the osteocyte4. To determine if lack of Dmp1 in osteocytes (Supplementary Fig. 1 online) could be responsible for both the human and mouse phenotypes and to test the potential mechanism of action, we investigated whether the observed abnormalities of mineralization in this mouse were associated with renal phosphate-wasting and increased FGF23 production by osteocytes. As reported previously, the Dmp1-null mice are mildly hypocalcemic but severely hypophosphatemic (control mice: 6.0 ± 0.2 mg/dl; Dmp1-null (hereafter, ‘null’): 3.9 ± 0.4; Supplementary Table 1)5. Studies showed increased renal phosphorus clearance (RPC) (control: 0.032 ± 0.003 ml/min; null: 0.052 ± 0.007) as well as increased PTH (control: 41 ± 5.0 pg/ml; null: 216 ± 24.1) and elevated serum Fgf23 levels (Fig. 2a). Of note, individuals with ARHR show mid- to high-normal PTH levels (Supplementary Table 1). We did not observe any significant differences in 1,25(OH)2D levels (control: 114 ± 25.4; null: 82.2 ± 25.9), although the values in the Dmp1-null serum were lower. This biochemical profile is similar to that observed in the Hyp mouse model of XLH7. The elevated circulating Fgf23 concentration in Dmp1-null mice was associated with increased bone Fgf23 mRNA expression, as measured by real-time PCR (Fig. 2b), and increased Fgf23 mRNA levels in osteocytes, as measured by in situ hybridization (Fig. 2c). Previously, we have shown that DMP1 is crucial for normal dentinogenesis14, chondrogenesis15 and mineralization5 in vivo. Newborns lacking Dmp1 have no apparent phenotype12 but develop the radiological appearance of rickets (Fig. 2d) and an osteomalacia phenotype5 with age. We combined fluorochrome labeling with DAPI nuclear staining to visualize the position of osteocytes relative to mineralization fronts (Fig. 3a). The control bone showed three discrete lines of fluorescent label, reflecting the mineralization fronts at the time of injection, and a typical pattern of osteocyte nuclei between fronts (Fig. 3a). In contrast, in the Dmp1-null mice, the fluorescent labeling of exposed sites of hydroxyapatite occurred in numerous dispersed punctate areas surrounding the osteocyte nuclei, reminiscent of a diffuse, osteomalacic form of mineralization (Fig. 3a). Using backscattered scanning electronic microscopy (SEM), we observed that mineral was evenly distributed surrounding the osteocyte lacunae in control bone (Fig. 3b); however, the mineral content was either missing or sparsely located in regions surrounding Dmp1-null osteocytes (Fig. 3c). We then used scanning transmission electron microscopy (STEM) to obtain a more accurate localization of mineral in relation to osteocytes. In control mice, the mineralized matrix (Fig. 3c), calcium (Fig. 3d), and phosphorus (Fig. 3e) surrounding the osteocyte were evenly distributed in the surrounding bone matrix (Fig. 3c–e). In contrast, in Dmp1-null mice, spherical structures reminiscent of calculospherulites were present, with markedly reduced propagation into the surrounding osteoid (Fig. 3c–e).
Figure 2.
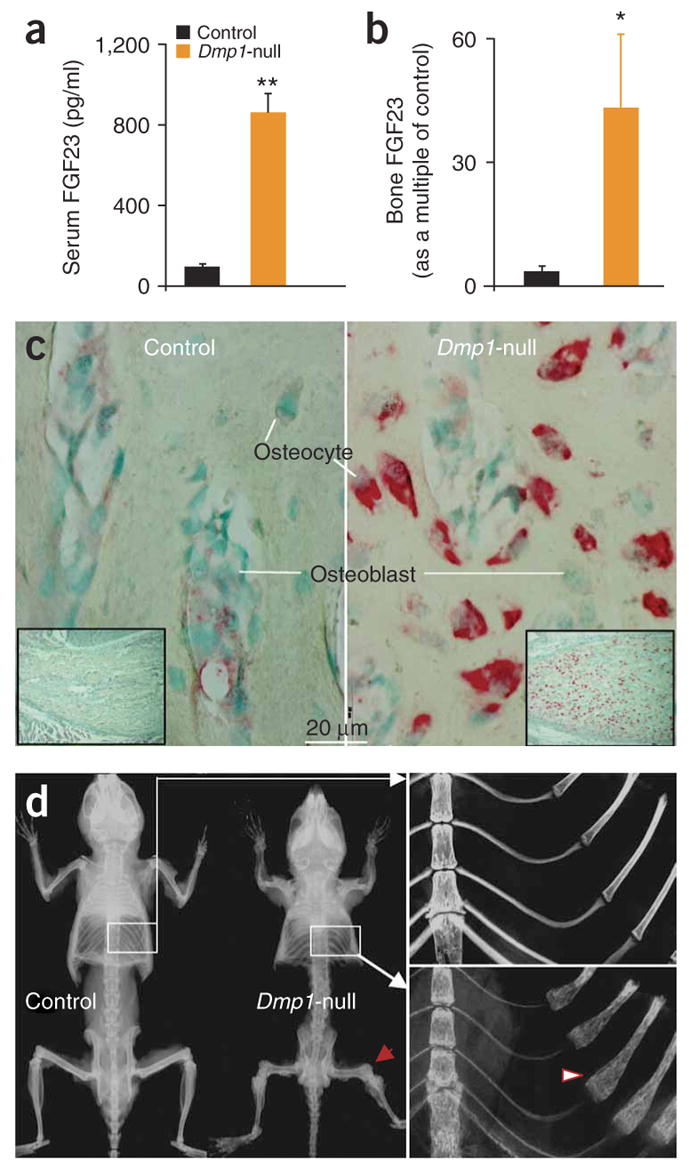
Dmp1-null mice show skeletal abnormalities, rickets and elevated FGF23. (a) Serum Fgf23 levels are shown for Dmp1-null mice compared with control heterozygote littermates. Data are mean ± s.e.m. from 2- to 5-month-old mice; n = 6 (Dmp1-null), n = 11 (control); **P < 0.01. (b) Real time RT-PCR of Dmp1-null long bone demonstrates marked elevation of Fgf23 mRNA expression (*P < 0.05). (c) In situ hybridization shows increased Fgf23 mRNA expression (red) in 10-d-old Dmp1-null osteocytes only. (d) Representative radiographs of skeletons from control and Dmp1-null mice at 3 months of age. In the Dmp1-null skeleton, the flared ends of long bones are indicated by arrows and the rachitic rosary of the ribs by an arrowhead.
Figure 3.
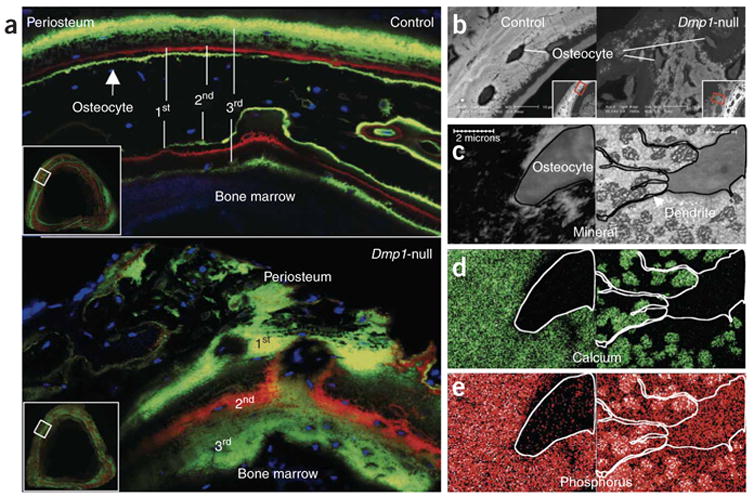
Dmp1-null mice show defects in mineralization. (a) Confocal microscopy images of fluorochrome labeling, counterstained with DAPI for visualization of osteocyte nuclei (blue). Dmp1- null osteocytes are buried in diffuse fluorochrome label, suggesting a defect in the process of mineral propagation. (b) Images of backscattered EM of tibias from 6-week-old mice (samples were treated with osmium to preserve cell morphology). (c–e) STEM maps of unstained osmium-free thin sections (<1 mm) from the same tibias of control (left) and Dmp1-null mice (right). With this technology, the convergent electron beam is scanned over a defined area of the sample to obtain mineral (c, black), calcium (d, green) and phosphorus (e, red/white) distribution within matrix.
We also observed high expression of Dmp1-lacZ in osteocytes using 8-d-old Dmp1-lacZ knock-in mice (Fig. 4a). Immunohistochemical staining of 4-month-old control mice showed high expression of DMP1 along osteocyte dendrites and canaliculi but undetectable expression in osteoblasts (Fig. 4b). Next, we performed studies to determine if defective osteoblast maturation and differentiation into osteocytes was responsible for the observed skeletal phenotype of Dmp1-null mice. In contrast to controls, markers of osteoblasts, such as alkaline phosphatase activity (Fig. 4c) and collagen type 1 mRNA (Fig. 4d), as well as early osteocyte markers such as E11/gp38 protein16 (Fig. 4e), were elevated in Dmp1-null osteocytes regardless of whether they were newly formed or deeply embedded. These observations partially explain the abnormal skeletal phenotype of Dmp1-null mice as being a result of continued, and inappropriate, expression of osteoblast and osteoid-osteocyte proteins in embedded osteocytes. This suggests that DMP1 expression in the extracellular matrix is essential for normal osteoblast-to-osteocyte differentiation through downregulation of osteoblast markers.
Figure 4.
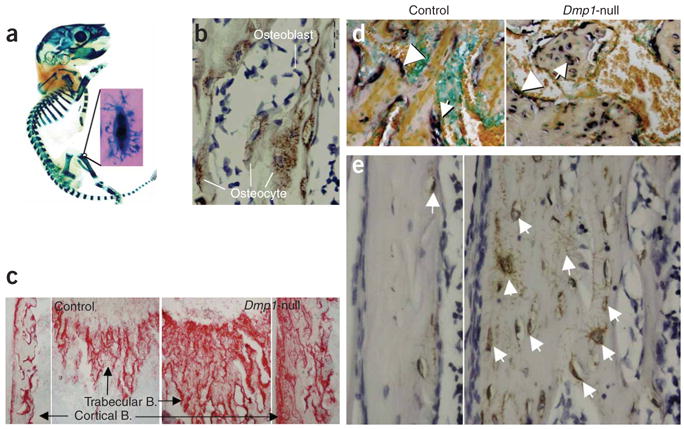
Defective osteoblast-to-osteocyte differentiation and maturation in Dmp1-null mice. (a) A whole mount X-gal stain of a skeleton from an 8-day-old Dmp1-lacZ knock-in pup. (b) DMP1 immunostain of bone matrix surrounding osteocytes. (c) An increase in alkaline phosphatase activity in 10-d-old Dmp1-null bone matrix (right). Arrows indicate region of magnification. B = bone. (d) Abnormal expression of type 1 collagen mRNA in Dmp1-null osteocytes. Arrows indicate osteocytes; arrowheads indicate osteoblasts. (e) Highly expressed E11 protein in all Dmp1-null osteocytes.
The distinguishing morphological feature of osteocytes is their long dendritic processes that travel through canaliculi, where DMP1 is restricted along canalicular walls and within the lamina limitans17. To examine the effects of Dmp1 ablation on the lacunocanalicular system, we delivered, via tail vein injection, procion red, a small–molecular weight dye that allows tracing of the entire osteocyte lacunocanalicular system. Confocal microscopy after injection showed that the control osteocyte lacunae were highly organized and regularly spaced in linear arrays (Fig. 5a), whereas the Dmp1-null osteocyte lacunae were much larger and randomly oriented (Fig. 5a). We further documented marked abnormalities in the distribution and organization of the Dmp1-null osteocyte-lacunocanalicular system with acid-etched SEM images (Fig. 5b). Indeed, the inner lacunocanalicular wall was smooth in control sections (Fig. 5b); however, the wall was buckled and enlarged in the null mouse (Fig. 5b), similar to observations in samples from individuals with ARHR (Fig. 1g) and consistent with TEM of the collapsed matrix surrounding the cell and its processes (Fig. 5c). The control TEM image (Fig. 5c) showed a distinct lamina limitans demarcating the canalicular wall and a normal dendritic process, with a distinct, visible space between the dendrite membrane and the canalicular wall. In the poorly mineralized matrix from the Dmp1-null mice (Fig. 5c), unmineralized collagen fibrils were evident, the lamina limitans was absent, and the membrane surface was buckled and irregular. Taken together, the above data indicate that the osteoid-osteocyte (and perhaps the mature osteocyte) is important in matrix mineralization and that DMP1 is integral to these functions.
Figure 5.
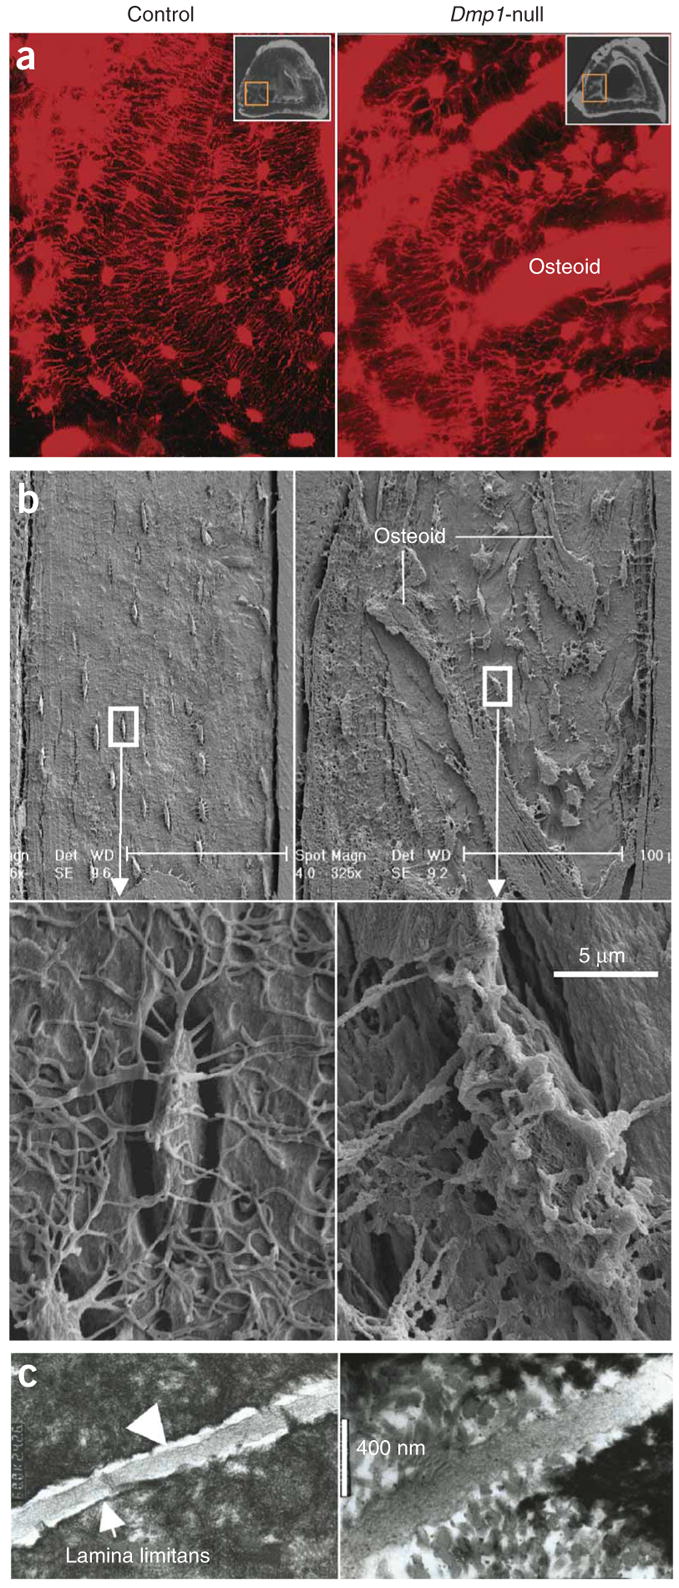
Defective organization of osteocyte lacunae and lacunocanalicular walls in Dmp1-null mice. (a) Visualization of disorganized osteocyte-canalicular system in Dmp1-null mice with procion red injection compared with the well-organized control osteocytes (left) using confocal microscopy at 40× at 565 nm excitation and 610 nm emission. (b) SEM images of the acid-etched, resin-casted osteocyte-canalicular system. Note the differences between the control (left) and the Dmp1-null (right) in distribution, size and surface of osteocytes. (c) TEM images of sagittal sections of osteocyte canaliculi and dendrites (control, left; Dmp1-null, right).
Hypophosphatemia is one of the most prominent defects in Dmp1-null mice. To determine the effects of restoring serum phosphate to control levels, we fed a high-phosphate diet (2%, Harlan Teklad) to these mice (Fig. 6a). This diet rescued the radiological appearance of rickets (Fig. 6a) owing to a correction of the mineralization defect at the level of the Dmp1-null growth plate (Fig. 6b), with marked improvement in the bone formation rate (Supplementary Fig. 2 online). Although the osteomalacia improved with the high-phosphate diet, the bone phenotype was not completely rescued (Fig. 6c, right; Supplementary Fig. 2). These observations are consistent with similar phosphate supplementation rescue studies in Hyp mice18 and in human vitamin D–resistant rickets19, where complete healing of the rachitic phenotype occurs with only partial resolution of the osteomalacia. Taken together, these data suggest that the rickets feature of this phenotype is due to the hypophosphatemia, whereas the majority of the osteomalacia is due to a lack of functional DMP1 in the osteocyte and its microenvironment, resulting in defective mineralization. Thus, these observations suggest that DMP1 has both direct effects (on osteocytes) and indirect effects (through phosphate) on mineralization.
Figure 6.
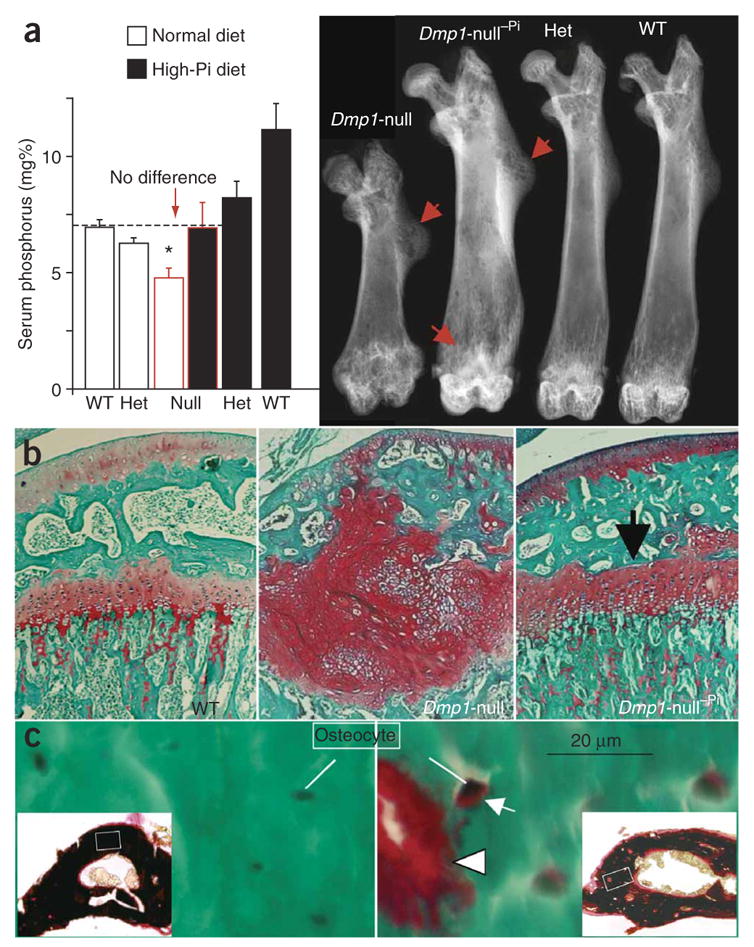
High-phosphate diet rescues the rickets but not the osteomalacic feature of the Dmp1-null phenotype. (a) Restoration of phosphate homeostasis by high-phosphate diet for 4 weeks (left) leads to rescue of rickets in Dmp1-null mice as shown by autoradiography (right). mg% = 1 mg/100 ml. Dmp1-null−Pi indicates an animal on a high-phosphate diet. ‘Het’ = heterozygote. (b) Confirmation of rickets rescue using safranin-O staining of growth plates. (c) High-phosphate diet has a limited effect on the Dmp1-null osteomalacia phenotype. Goldner stain shows abundant osteoid (red) is still present on bone edges (arrowhead) and surrounding osteocytes (arrow). Goldner staining is validated by von Kossa staining (black, mineral; red, osteoid; insets show low magnification). *Indicates statistically significant difference (P < 0.05).
In summary, our studies define new functional roles for the osteocyte and show that DMP1 is critical for osteocyte maturation. These observations are highlighted by our findings that genetic removal of Dmp1 from the skeletal matrix (in mice) and loss-of-function DMP1 mutations (in human ARHR kindreds) concurrently lead to independently altered skeletal mineralization and disturbed phosphate homeostasis associated with increased FGF23 production, both due to defective osteocyte function.
METHODS
ARHR families
All affected individuals provided written, informed consent in accord with the Indiana University and the Children’s Hospital of Eastern Ontario Institutional Review Boards. Both kindreds were of Lebanese descent. Serum FGF23 was assessed with an Intact FGF23 ELISA (Kainos). Bone biopsies were assessed for osteomalacia using Goldner’s stain and fluorescence microscopy using standard protocols5,20. Genomic DNA extracted from blood samples was amplified by PCR and assessed by DNA sequencing for each DMP1 exon.
Protein studies
cDNAs of wild-type human DMP1 and both mutants were subcloned into pcDNA3.1(+)V5/His vector (Invitrogen) to create the V5- and 6XHis-tagged expression constructs, which were transiently transfected into HEK293 cells for protein blot analyses. Cells were lysed with Cell Lysis Buffer (Cell Signaling Technologies) plus protease inhibitor AEBSF (1 μg/ml) on ice for 5 min and were then centrifuged to clear the lysates. Protein samples, and standards for molecular mass determination, were electrophoresed on 15% SDS-PAGE mini-gels (Bio-Rad) and electrotransferred onto polyvinylidine difluoride (PVDF) membranes (Bio-Rad). Membranes were incubated with 0.25 μg/ml of a horseradish peroxidase–conjugated antibody to V5 (Invitrogen). Blots were visualized by enhanced chemiluminescence (ECL) (Amersham). Control transfections consisting of vector alone showed no reacting bands.
Serum and urine concentrations of calcium, phosphorus, creatinine and serum alkaline phosphatase activity were measured using standard methods. Serum intact PTH was determined by immunoradiometric assay (N-tact*; Incstar). 1,25-(OH)2D levels were measured using radioimmunoassays (1,25-dihydroxyvitamin D Osteo SP; Incstar). All samples were obtained from mice or fasted humans. TmP/GFR was calculated according to the Walton and Bijvoet nomogram21 using a 2-h urine sample and a serum sample that was obtained after 1 h.
Mice
All animal studies were in accord with the guidelines of the University of Missouri-Kansas City animal review board. The Dmp1-null mice were generated with exon 6 deleted as described previously22. A CD-1 background was used in this study. Previous examination of a mixed background of C57BL/6 and 129 Sv found the same skeletal phenotype, regardless of strain15. Furthermore, there were no apparent differences between heterozygous and wild-type mice in any parameters measured to date.
The mice were fed autoclaved Purina rodent chow (5010, Ralston Purina) containing 1% calcium, 0.67% phosphorus and 4.4 international units (IU) vitamin D/g (regular diet). To normalize the blood phosphate level of the Dmp1-null mice, the animals were fed a rescue chow (Harlan Teklad, cat. TD.87133) containing 2% phosphorus, 1.1% calcium and 2.2 IU/g vitamin D from 21 d of age.
Preparation and analyses of bone samples
Procedures for bone sample preparation and high-resolution X-ray, TEM and SEM were described previously15,23. For STEM or TEM images, thin sections were cut and stained with uranyl acetate and lead citrate and examined using a Philips CM12 in STEM mode. For resin-casted osteocyte-lacunocanalicular SEM, the surface of methyl-methacrylate embedded bone was polished, acid etched with 37% phosphoric acid for 2–10 s, washed with 5% sodium hypochlorite for 5 min and then coated with gold and palladium and examined by FEI/Philips XL30 Field emission environmental SEM. Standard methods for safranin-O staining of growth plates, Goldner’s Masson Trichrome staining, immunohistochemistry and in situ hybridization using digoxigenin-labeled antisense RNA (cRNA) probes have been described previously24. To analyze the role of osteocytes in mineralization, mice were injected 5 d apart with calcein (5 mg/kg intraperitoneal (i.p.)), alizarin red (20 mg/kg i.p) and again with calcein. The animals were killed 2 d after the final injection. The 50-mm non-decalcified samples from these animals were photographed using a Nikon PCM-2000 confocal microscope coupled to an Eclipse E-800 upright microscope for fluorochrome labeling combined with DAPI staining of nuclei of osteocytes. Analysis of alkaline phosphatase activity in bone was performed according manufacturer’s instructions (Sigma).
Visualization of the osteocyte-canalicular system by procion red
We injected this small–molecular weight dye (0.8%, 0.01 ml/g; Sigma) through the mouse tail vein while mice were under anesthesia using Avertin (5 mg/kg body weight) 10 min before the animals were killed. Fresh bone was fixed in 70% ethanol and sectioned to 50 mm for photography using confocal microscopy.
Quantification of mRNA
Measurement of Fgf23 mRNA was performed using fluorescently labeled TaqMan MGB primers combined with iTaq CYBR with a ROX detection Kit (Bio-Rad). Real-time detection of Gapdh mRNA signal was also performed as the internal control for the amplification of Fgf23 mRNA (Supplementary Table 2 online). Data were collected quantitatively and the CT number was corrected by CT readings of corresponding Gapdh controls. Data were then expressed as a multiple of values from experimental controls.
Serum and urine assays
Serum and urine calcium were measured using a colorimetric calcium kit (Stanbio Laboratory). Serum and urine phosphorus were measured by the phosphomolybdate–ascorbic acid method as previously described8. Serum FGF23, 1,25-(OH)2D and PTH levels were measured by a full-length FGF23 ELISA kit (Kainos Laboratories), a 1,25-Dihydroxy vitamin D EIA kit (Immunodiagnostic Systems Limited) and a mouse intact PTH ELISA kit (Immutopics), respectively. Urine samples were collected in mouse metabolic cages for 16 h, and renal phosphorus clearance (RPC) was calculated with as (urine Pi × urinary volume)/(serum Pi × time of collection) as previously described25. Urine creatinine was measured with a Creatinine Assay Kit (Cayman Chemical Company).
Supplementary Material
Table 1.
Comparisons of Biochemistry Data for ARHR and Dmp1-null Mouse
| Human ARHR | Mouse Dmp1-null | |||||
|---|---|---|---|---|---|---|
| VALUE | AGE | SAMPLE SIZE | VALUE Mean!S.E. | AGE | SAMPLE SIZE | |
|
Ionized Calcium (ARHR) mmol/L
Total Calcium (Dmp1-null mice) mmol/L |
F1-1 1.21 (N: 1.1 – 1.3)
F1-2 NA F1-3 1.16 F2-1 1.19 |
21 years
NA 5 years 32 years |
3 | 2.30 ± 0.05 (2.45 ± 0.05)*
2.00 ± 0.05 (2.13 ± 0.05)* 1.90 ± 0.05 (1.85 ± 0.05) |
2 weeks
7 weeks 4-6 months |
11 (12)
5 (7) 7 (11) |
| Phosphorus mmol/L | F1-1 0.9 (N: 1.2 – 1.8)
F1-2 0.7 F1-3 0.8 F2-1 0.9 |
7 years
11 months 5 years 9 years |
4 | 1.94 ± 0.06 (2.97 ± 0.10)**
1.18 ± 0.14 (2.3 5± 0.09)** 1.26 ± 0.13 (1.94 ± 0.06)** |
2 weeks
7 weeks 4–6 months |
11 (12)
5 (7) 11 (14) |
|
TmP/GFR (ARHR) mmol/L
Renal Pi Clearance (Dmp1-null mice) mL/min |
F1-1 0.81 (N: ″1.0)
F1-2 0.62 F1-3 0.61 F2-1 0.78 |
7 years
11 months 9 years 9 years |
4 | 0.052 ± 0.007 (0.032 ± 0.003) | 4–6 months | 6 (6) |
| Intact PTH pmol/L | F1-1 6.9 (N: 1.6 – 6.9)
F1-2 NA F1-3 4.9 F2-1 4.6 |
21 years
NA 5 years 32 years |
3 | 56.5 ± 9.5 (4.9 ± 1.9)**
23.0 ± 2.6 (4.4 ± 0.5)** |
8 weeks
4–6 months |
7 (10)
6 (9) |
| 1, 25 (OH)2D pmol/L | F1-1 74 (N: 40 – 140)
F1-2 NA F1-3 71 F2-1 77 |
21 years
NA 5 years 32 years |
3 | 82.2 ± 25.9 (114 ±25.4) | 8 weeks | 4 (5) |
| Alkaline Phosphatase U/L | F1-1 276 (N: 150 – 380)
F1-2 836 F1-3 269 F2-1 330 |
7 years
11 months 5 years 9 years |
4 | 267.42±81.03 (100.46±43.70) | 8 weeks | 4 (6) |
| FGF23 pg/ml | See Fig. 1c | 8381 ± 807 (122 ± 16.5)**
713 ± 121 (43 ± 5)** 864 ± 96.6 (100 ± 8.0)** |
2 weeks
7 weeks 4–6 months |
7 (7)
5 (7) 6 (11) |
||
| Urinary Calcium / Creatinine mol/molCr | 1-1 0.20 (N: #0.6)
F1-2 0.33 F1-3 0.19 F2-1 0.06 |
7 years
11 months 9 years 9 years |
4 | 0.13 ± 0.02 (0.12 ± 0.02) | 4–6 months | 5 (5) |
N = normal ranges for age
NA = not available
For the Dmp1-null mouse data, controls are in ()
=p<0.05
=p<0.01
Table 2.
Primer sequences used for Real-time PCR
|
FGF23:
Forward: CTG CTA GAG CCT ATC CGG AC Reverse AGT GAT GCT TCT GCG ACA A |
|
GAPDH:
Forward: GGT GTG AAC CAC GAG AAA TA Reverse: TGA AGT CGC AGG AGA CAA CC |
Acknowledgments
We greatly appreciate the participation of all kindred members. We acknowledge the advice and experimental assistance of P.S.N. Rowe from the Kansas University Medical Center at Kansas City. The authors appreciate the use of the University of Missouri-Kansas City SEM Facility (J.D. Eick, Director). This study was supported by US National Institutes of Health grants to J.Q.F. (DE13480; AR051587; AR046798), K.E.W. (DK063934), M.K.D. (AR027032), L.D.Q. (AR-45955) and L.F.B. (AR046798); a Canadian Institutes for Health Research Investigator Award and a Canadian Child Health Clinician Scientist Program Award to L.M.W.; Shriners of North America (F.R.); a sub-award from the Center of Biomedical Research Excellence in Protein Structure and Function (COBRE-PSF) supported by the National Center for Research Resources (NCRR) to S.L.; Indiana Genomics Initiative funds to K.E.W. and a Chancellor Fellowship from the University of Missouri-Kansas City to Y.L.
Footnotes
Note: Supplementary information is available on the Nature Genetics website.
AUTHOR CONTRIBUTIONS L.M.W. performed clinical assessment of kindreds; K.W., S.I.D. and X.Y. performed the human genetic studies; F.R. provided patient biopsies; J.Q.F., Y.L., Y.X., S.Z., H.R. and L.F.B. characterized the Dmp1-null osteocyte phenotype; S.L., B.Y., M.D. and L.D.Q. provided the mouse FGF23 data and J.Q.F., L.M.W., L.F.B. and K.W. composed the manuscript.
COMPETING INTERESTS STATEMENT The authors declare competing financial interests (see the Nature Genetics website for details).
Reprints and permissions information is available online at http://npg.nature.com/reprintsandpermissions/
References
- 1.Frost HM. In vivo osteocyte death. J Bone Joint Surg Am. 1960;42A:138–143. [PubMed] [Google Scholar]
- 2.Palumbo C, Palazzini S, Zaffe D, Marotti G. Osteocyte differentiation in the tibia of newborn rabbit: an ultrastructural study of the formation of cytoplasmic processes. Acta Anat (Basel) 1990;137:350–358. doi: 10.1159/000146907. [DOI] [PubMed] [Google Scholar]
- 3.Pead MJ, Lanyon LE. Indomethacin modulation of load-related stimulation of new bone formation in vivo. Calcif Tissue Int. 1989;45:34–40. doi: 10.1007/BF02556658. [DOI] [PubMed] [Google Scholar]
- 4.Toyosawa S, et al. Dentin matrix protein 1 is predominantly expressed in chicken and rat osteocytes but not in osteoblasts. J Bone Miner Res. 2001;16:2017–2026. doi: 10.1359/jbmr.2001.16.11.2017. [DOI] [PubMed] [Google Scholar]
- 5.Ling Y, et al. DMP1 depletion decreases bone mineralization in vivo: an FTIR imaging analysis. J Bone Miner Res. 2005;20:2169–2177. doi: 10.1359/JBMR.050815. [DOI] [PMC free article] [PubMed] [Google Scholar]
- 6.The Hyp Consortium. A gene (PEX) with homologies to endopeptidases is mutated in patients with X-linked hypophosphatemic rickets. Nat Genet. 1995;11:130–136. doi: 10.1038/ng1095-130. [DOI] [PubMed] [Google Scholar]
- 7.Tenenhouse HS. X-linked hypophosphataemia: a homologous disorder in humans and mice. Nephrol Dial Transplant. 1999;14:333–341. doi: 10.1093/ndt/14.2.333. [DOI] [PubMed] [Google Scholar]
- 8.Liu S, et al. Pathogenic role of Fgf23 in Hyp mice. Am J Physiol Endocrinol Metab. 2006;291:E38–E49. doi: 10.1152/ajpendo.00008.2006. [DOI] [PubMed] [Google Scholar]
- 9.The ADHR Consortium. Autosomal dominant hypophosphataemic rickets is associated with mutations. FGF23 Nat Genet. 2000;26:345–348. doi: 10.1038/81664. [DOI] [PubMed] [Google Scholar]
- 10.Fisher LW, Fedarko NS. Six genes expressed in bones and teeth encode the current members of the SIBLING family of proteins. Connect Tissue Res. 2003;44(Suppl):33–40. [PubMed] [Google Scholar]
- 11.D’Souza RN, et al. Gene expression patterns of murine dentin matrix protein 1 (Dmp1) and dentin sialophosphoprotein (DSPP) suggest distinct developmental functions in vivo. J Bone Miner Res. 1997;12:2040–2049. doi: 10.1359/jbmr.1997.12.12.2040. [DOI] [PubMed] [Google Scholar]
- 12.Feng JQ, et al. The Dentin matrix protein 1 (Dmp1) is specifically expressed in mineralized, but not soft, tissues during development. J Dent Res. 2003;82:776–780. doi: 10.1177/154405910308201003. [DOI] [PubMed] [Google Scholar]
- 13.Ito N, et al. Comparison of two assays for fibroblast growth factor (FGF)-23. J Bone Miner Metab. 2005;23:435–440. doi: 10.1007/s00774-005-0625-4. [DOI] [PubMed] [Google Scholar]
- 14.Ye L, et al. Deletion of dentin matrix protein-1 leads to a partial failure of maturation of predentin into dentin, hypomineralization, and expanded cavities of pulp and root canal during postnatal tooth development. J Biol Chem. 2004;279:19141–19148. doi: 10.1074/jbc.M400490200. [DOI] [PubMed] [Google Scholar]
- 15.Ye L, et al. Dmp1-deficient mice display severe defects in cartilage formation responsible for a chondrodysplasia-like phenotype. J Biol Chem. 2005;280:6197–6203. doi: 10.1074/jbc.M412911200. [DOI] [PMC free article] [PubMed] [Google Scholar]
- 16.Zhang K, et al. E11/gp38 selective expression in osteocytes: regulation by mechanical strain and role in dendrite elongation. Mol Cell Biol. 2006;26:4539–4552. doi: 10.1128/MCB.02120-05. [DOI] [PMC free article] [PubMed] [Google Scholar]
- 17.Butler WT, Brunn JC, Qin C, McKee MD. Extracellular matrix proteins and the dynamics of dentin formation. Connect Tissue Res. 2002;43:301–307. doi: 10.1080/03008200290000682. [DOI] [PubMed] [Google Scholar]
- 18.Eicher EM, Southard JL, Scriver CR, Glorieux FH. Hypophosphatemia: mouse model for human familial hypophosphatemic (vitamin D-resistant) rickets. Proc Natl Acad Sci USA. 1976;73:4667–4671. doi: 10.1073/pnas.73.12.4667. [DOI] [PMC free article] [PubMed] [Google Scholar]
- 19.Marie PJ, Glorieux FH. Relation between hypomineralized periosteocytic lesions and bone mineralization in vitamin D-resistant rickets. Calcif Tissue Int. 1983;35:443–448. doi: 10.1007/BF02405074. [DOI] [PubMed] [Google Scholar]
- 20.Glorieux FH, et al. Normative data for iliac bone histomorphometry in growing children. Bone. 2000;26:103–109. doi: 10.1016/s8756-3282(99)00257-4. [DOI] [PubMed] [Google Scholar]
- 21.Smith R, Walton RJ, Woods CG. Letter: Osteoporosis of ageing. Lancet. 1976;1:40. doi: 10.1016/s0140-6736(76)92937-8. [DOI] [PubMed] [Google Scholar]
- 22.Feng JQ, et al. The Dentin matrix protein 1 (Dmp1) is specifically expressed in mineralized, but not soft tissues during development. J Dent Res. 2003;82:776–780. doi: 10.1177/154405910308201003. [DOI] [PubMed] [Google Scholar]
- 23.McKee MD, Glimcher MJ, Nanci A. High-resolution immunolocalization of osteopontin and osteocalcin in bone and cartilage during endochondral ossification in the chicken tibia. Anat Rec. 1992;234:479–492. doi: 10.1002/ar.1092340404. [DOI] [PubMed] [Google Scholar]
- 24.Feng JQ, et al. Dentin matrix protein 1, a target molecule for Cbfa1 in bone, is a unique bone marker gene. J Bone Miner Res. 2002;17:1822–1831. doi: 10.1359/jbmr.2002.17.10.1822. [DOI] [PubMed] [Google Scholar]
- 25.Rowe PS, et al. MEPE, a new gene expressed in bone marrow and tumors causing osteomalacia. Genomics. 2000;67:54–68. doi: 10.1006/geno.2000.6235. [DOI] [PubMed] [Google Scholar]
Associated Data
This section collects any data citations, data availability statements, or supplementary materials included in this article.