

Abstract
Biochemical and structural analysis of membrane proteins often critically depends on the ability to overexpress and solubilize them. To identify properties of eukaryotic membrane proteins that may be predictive of successful overexpression, we analyzed expression levels of the genomic complement of over 1,000 predicted membrane proteins in a recently completed Saccharomyces cerevisiae protein expression library. We detected statistically significant positive and negative correlations between high membrane protein expression and protein properties such as size, overall hydrophobicity, number of transmembrane helices, and amino acid composition of transmembrane segments. Although expression levels of membrane and soluble proteins exhibited similar negative correlations with overall hydrophobicity, high-level membrane protein expression was positively correlated with the hydrophobicity of predicted transmembrane segments. To further characterize yeast membrane proteins as potential targets for structure determination, we tested the solubility of 122 of the highest expressed yeast membrane proteins in six commonly used detergents. Almost all the tested proteins could be solubilized using a small number of detergents. Solubility in some detergents depended on protein size, number of transmembrane segments, and hydrophobicity of predicted transmembrane segments. These results suggest that bioinformatic approaches may be capable of identifying membrane proteins that are most amenable to overexpression and detergent solubilization for structural and biochemical analyses. Bioinformatic approaches could also be used in the redesign of proteins that are not intrinsically well-adapted to such studies.
Keywords: membrane proteins, detergents, yeast, protein overexpression, structural genomics, structure determination, hydrophobicity, transmembrane segments, FOS-choline, solubilization
Introduction
Integral membrane proteins present a significant problem for the ongoing intensive efforts to expand the availability of three-dimensional protein structures.1 Whereas membrane proteins comprise up to 30% of the proteome and perform crucial functions in a wide variety of cellular processes, they are poorly represented among available high-resolution crystal structures.2 This lack of structural data has significantly hindered progress towards gaining a detailed understanding of how membrane proteins carry out their functions. Most currently available high-resolution membrane protein structures have been obtained using proteins derived from prokaryotes (see the comprehensive lists of membrane protein crystal structures at http://www.mpibp-frankfurt.mpg.de/michel/public/memprotstruct.html and http://blanco.biomol.uci.edu/Membrane_Proteins_xtal.html). However, many important classes of eukaryotic membrane proteins, such as G-protein coupled receptors and receptor tyrosine kinases are entirely absent or poorly represented among available structures.
The most severe difficulties in structure determination of membrane proteins arise from the processes of expression, purification, and crystallization.1; 3; 4; 5. Compared with soluble proteins, membrane proteins are difficult to overexpress at high levels in a form that yields high quality crystals. Thus, the first eukaryotic transmembrane protein structures that were solved were obtained using proteins derived from native tissues. It is only very recently that the first structures of eukaryotic membrane proteins have been determined using recombinantly expressed proteins, and in each case yeast was used as the heterologous host.6; 7; 8. Until the challenge of obtaining usable protein through recombinant expression is met, determination of eukaryotic membrane protein structures will be restricted to the small subset of such proteins that are expressed at high levels in native tissues. Recombinant expression is also necessary to obtain structures of mutant forms of membrane proteins that are important for understanding the mechanisms of their functions.
Another major obstacle to structural studies of membrane proteins arises from the need to solubilize these proteins in detergent for purification and biophysical characterization. The chosen detergent must effectively solubilize the protein without inhibiting function, without causing irreversible denaturation, and without interfering with purification or crystallization. Currently, there is little basic understanding of the detailed interactions between proteins and detergents that could serve as the basis for a rational protocol for deciding which detergents would be suitable for use with particular proteins, and even empirical rationales for choosing detergents to solubilize a given membrane protein are lacking. In some cases, it is possible to initially solubilize a protein in one detergent, and then exchange it into a different detergent; thus it may be desirable to identify detergents that are most generally useful in achieving the solubilization of a wide variety of membrane proteins. The problems associated with detergent selection are particularly acute in a high-throughput context where extensive screening of dozens of detergents for use with each of a large number of proteins is not feasible.
The difficulty of overexpressing and solubilizing membrane proteins also impedes their biochemical characterization. Demonstrating or characterizing the biochemical function of a particular polypeptide chain requires separation of that chain from other polypeptides, which, in the case of membrane proteins, almost always involves the use of detergents. Establishing conditions for general, genome-wide solubilization of membrane proteins is an important step in extending mass-spectrometry-based proteomic analyses to these proteins.9; 10; 11 Furthermore, biochemical genomics, the use of genomic expression libraries for identification of unknown genes encoding proteins with assayable biochemical functions (see Gelperin et al.12), has not generally been applied to membrane-associated activities, in part because of the difficulty of establishing uniform conditions for solubilization of the genomic complement of membrane proteins in functional form.
There is currently little available information on membrane protein expression, solubilization, purification, and crystallization on a genomic scale. Membrane proteins have generally been excluded from most structural genomics pipelines, consistent with reports that the presence of predicted transmembrane helices in a protein is strongly correlated with failure to determine the structure in a high-throughput context.5; 13; 14 Data on expression is available from several projects that have conducted cloning and expression of entire proteomes in bacteria,13; 14; 15 however there are currently few published analyses of such data specifically devoted to membrane proteins.16; 17 In addition, several medium-scale projects have attempted to gather statistics on expression and detergent solubility of prokaryotic membrane proteins.18; 19 Since the traditional one-at-a-time approach for membrane protein structure determination has proven to be so difficult, the availability of genome-wide data on expression and solubilization could enhance the efficiency of structure determination efforts by making it possible to identify those membrane proteins that will be most experimentally tractable or by informing rational approaches for mutagenesis of membrane proteins aimed at improving expression or solubilization.
Recently we cloned and expressed a nearly complete genomic complement of yeast Saccharomyces cerevisiae proteins in a homologous yeast host.12 A total of 5,573 open reading frames (ORFs) cloned into a PGAL1-regulated expression vector were tested for expression, including 1,092 predicted membrane proteins. This collection is called the MORF (Movable ORF) library. We classified the expression level of each protein as either high, medium, low, or not detected. Among predicted membrane proteins in this library were 263 that could be expressed at levels comparable to the most highly expressed soluble proteins (≥1 mg/L), indicating that they are good candidates for structural experiments. In this report we identify protein properties that correlate with the recombinant expression potential of yeast membrane proteins, the first such analysis covering nearly all of the predicted membrane proteins of a eukaryotic organism. In order to evaluate the effectiveness of various detergents in solubilizing a large set of proteins, we selected 122 highly expressed membrane proteins and tested their solubility patterns in six commonly used detergents. These experiments have uncovered significant differences in the abilities of different detergents to solubilize yeast membrane proteins, and have allowed us to identify protein properties associated with solubility in some detergents.
Results
Protein characteristics that exhibit similar correlations with levels of soluble and membrane protein expression
As described previously, we tested the expression of 5,573 S. cerevisiae proteins, including 1,092 predicted integral membrane proteins12. Each protein in this study was expressed in yeast as a fusion protein with a 19 kDa C-terminal tag containing a 6-His sequence, an HA epitope, a rhinovirus 3C protease recognition site, and a ZZ (protein A IgG-binding) domain. Levels of protein expression were determined by immunoblotting using anti-HA antibodies, and were scored on a four-level scale: no detectable expression, low, medium, or high expression. To identify factors that affect the potential for high-level recombinant expression of yeast integral membrane proteins, we compared predicted membrane proteins scored as high-expressing (263 proteins) to those scored as low-expressing (378 proteins). Membrane proteins that were not expressed at detectable levels (132 proteins) were omitted from our analysis because of the possibility that their failure to express resulted from problems with cloning, yeast transformation, or ORF annotation, rather than from the intrinsic characteristics of the protein.
We examined the percentage of high expressing proteins in categories defined according to 9 different general protein characteristics (Table 1). Six protein characteristics exhibited significant correlations with membrane protein expression level: size, hydropathy (GRAVY score)20, native expression level (molecules per cell),21 isoelectric point, codon adaptation index, and the percentage of aromatic residues in the total protein (Figure 1). As indicated in Figure 1, in each of these six cases a similar correlation was observed between the relevant protein property and expression levels of both membrane and soluble proteins.
Table 1.
Protein characteristics tested for association with expression
| General protein characteristics |
| Codon usage, codon adaptation index |
| Molecules per cell under chromosomal expression |
| Percentage of total protein residues that are aromatic |
| Isoelectric point |
| Size (kDa) |
| GRAVY score (overall protein hydrophobicity) |
| Homolog in yeast or other organism |
| Cellular localization |
| Predicted to contain a signal peptide |
| Membrane protein characteristics |
| Number of predicted transmembrane segments |
| N- and C-terminal orientation across membrane |
| Average transmembrane segment length |
| Percentage of protein in transmembrane segments |
| Percentage of transmembrane residues that are hydrophobic (WFLIVMY) |
| Percentage of transmembrane residues that are charged/polar (EDKRHNQST) |
| Percentage of transmembrane residues that are aromatic (WYF) |
Figure 1. Protein expression dependence on general protein properties.
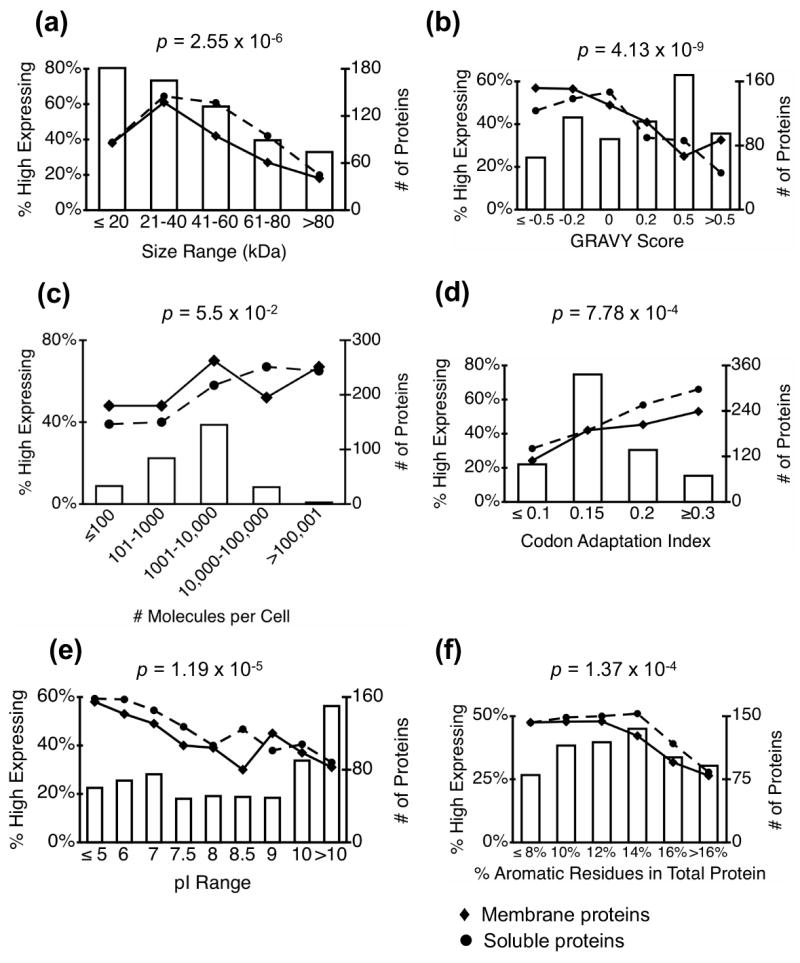
Bar graphs show the total number of predicted membrane proteins (high expressers + low expressers, right axis) in each bin; line plots show the proportion of high expressers for membrane proteins (♦ solid line) and soluble proteins (●, dashed line) as a function of the specified protein property. The indicated p-values refer to membrane protein plots> They were determined by a chi-squared test for trend in proportions as described in Materials and Methods.
One of the strongest predictors of protein expression level for both soluble and membrane proteins is protein size, such that smaller proteins are generally more likely to be highly expressed than larger proteins. Less than 20% of membrane proteins larger than 80 kDa are highly expressed, compared with more than 40% of proteins smaller than 60 kDa (Figure 1a). The size-dependent decrease in expression levels of membrane proteins is observed at a somewhat smaller size range (41–60 kDa) than for soluble proteins, where it is not observed until the proteins reach sizes of 61–80 kDa. For the smallest size range of proteins (≥ 20 kDa), expression actually increases with increasing size. Less than 40% of soluble and membrane proteins in this smallest range are highly expressed, compared with more than 60% of membrane and soluble proteins in the 21–40 kDa range. This may reflect the higher percentage of reading frames in the smallest size category that are classified as “dubious” are not likely to be efficiently expressed in cells.
A negative correlation between recombinant overexpression and protein hydrophobicity that has previously been noted for proteins in general 13; 22 14 appears to hold for yeast membrane proteins as well (Figure 1b).
We observe an overall correlation between native expression level and the level of protein in the overexpression MORF library, however this is a general trend with many exceptions. Fully 30–40% of soluble and membrane proteins in the lowest native expression category can be expressed to the highest levels from the MORF vector.
No correlation was observed between expression levels of a protein and 1) the presence a homolog of the protein in yeast or other organisms; 2) known or predicted cellular localization; or 3) whether the protein contains a predicted a signal peptide targeting it to the secretory pathway. To test for an association between expression level and protein function or physiological process, we used the SGD GO Term Finder23 to identify gene ontology (GO) categories that were overrepresented in either expression category. We found only one significant association between a GO category and expression level: v-SNARE and t-SNARE proteins involved in transit of proteins through the secretory pathway tended to be highly expressed. 3 of 10 annotated t-SNARE proteins and 7 of 14 annotated v-SNARE proteins were in the highest- expressing class of proteins, while none of the SNARE proteins were in the lowest expressing-class. Despite this particular case, the functions and localizations of membrane proteins do not generally impact the ability to express high levels of proteins in our system.
Membrane-specific properties affecting levels of protein overexpression
We tested for an association between level of expression and seven properties that are specific to membrane proteins, focusing on the number and characteristics of transmembrane segments (Table 1; Figure 2). As reported previously12, there is an inverse correlation between expression and the number of transmembrane segments in a protein and level of expression. This is examined in more detail in Figure 2a. Approximately 50% of proteins with fewer than 5 transmembrane helices were expressed to the highest levels, whereas less than 20% of the proteins with 7 or more transmembrane helices were expressed at these high levels. However, the decrease in expression level with increasing number of transmembrane segments is not monotonic over all the full range of numbers of transmembrane segments.
Figure 2. Protein expression dependence on protein size and number of transmembrane segments.
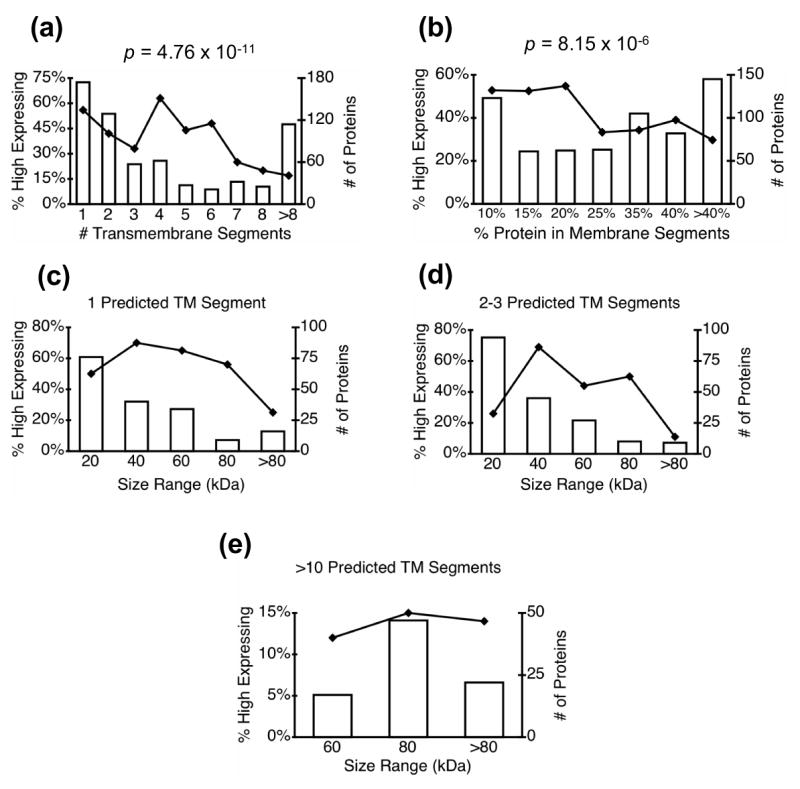
Bar graphs show the total number of predicted membrane proteins (high expressers + low expressers, right axis) in each bin; line plots show the proportion of high expressing membrane proteins as a function of the specified property. The indicated p-values were determined as described in Materials and Methods. In panels c-e, the effects of protein size were examined for proteins that contain set numbers of predicted transmembrane segments.
Since the size of an integral membrane protein is to some degree correlated with the number of transmembrane segments in the protein, we also examined the relationship between the percentage of the protein found in membrane spanning regions and expression level (Figure 2b). Over half of the predicted transmembrane proteins with 20% or less of their residues in transmembrane segments were highly expressed, whereas the fraction of high-expressing proteins drops to approximately 30% for proteins with more than 20% of their residues in transmembrane segments. In order to further distinguish between the effects of size and transmembrane helices on expression, we examined the effects of overall size on expression for proteins with a given number of transmembrane segments (Figure 2c-e). The negative correlation between size and high expression is maintained for proteins with 1–3 transmembrane segments (Figure 2c-d) but not for proteins with more than 10 transmembrane segments (Figure 2e). For proteins with other numbers of transmembrane segments, the numbers of proteins in each size range was not sufficient to allow detection of significant correlations.
The relationship between expression level and sequence in transmembrane segments is distinctly different than that between expression and overall protein sequence in that there is a significant positive correlation between expression levels and the hydrophobicity of predicted transmembrane segments (Figure 3a). Fewer than 40% of proteins with less than 70% hydrophobic amino acids in their transmembrane segments are highly expressed, while nearly 60% of proteins with more than 70% hydrophobic residues in their transmembrane segments are highly expressed. This effect is even more striking when viewed in terms of the percentage of charged and polar residues in the transmembrane regions (Figure 3b). Proteins with transmembrane segments comprised of less than 8% charged or polar residues express at high levels twice as frequently as proteins with more than 18% of such residues. This is in marked contrast to the negative effect of overall protein hydrophobicity on expression levels shown in Figure 1b.
Figure 3. Protein expression dependence on hydrophobicity of predicted transmembrane segments.
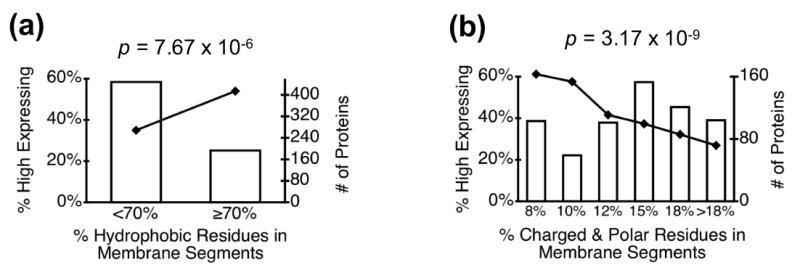
Bar graphs show the total number of predicted membrane proteins (high expressers + low expressers, right axis) in each bin; line plots show the proportion of high expressing membrane proteins as a function of the specified property.
We found no correlation between expression and any of the other membrane-specific parameters we tested, including average transmembrane segment length, percentage of transmembrane residues that are aromatic, and topological orientation of protein N- and C-termini with respect to the membrane (Table 1, data not shown).
Detergent solubility patterns of membrane proteins
Despite the importance of detergent solubilization for membrane protein biochemistry and structural biology, there are few general principles available to guide researchers in the selection of the appropriate detergent for a specific protein.3; 24 To investigate the interactions of detergents with different proteins, we determined the solubility of a set of 122 high-expressing predicted membrane proteins in six commonly used detergents: Triton X-100 (TX-100), lauryldimethylamine-N-oxide (LDAO), FOS-choline 12 (FC-12, dodecylphosphocholine), tetraethyleneglycol monooctyl ether (C8E4), n-octyl-β-D-glucoside (OG), and n-dodecyl-β-D-maltoside (DDM). Four of the detergents used, LDAO, DDM, OG, and C8E4, are among the most commonly used detergents in membrane protein crystallography (see the online list maintained by Hartmut Michel at http://www.mpibp-frankfurt.mpg.de/michel/public/memprotstruct.html). FC-12, though not commonly used for crystallography, has been used in NMR studies of membrane proteins, has shown promising results in our laboratory (N. Fedoriw, K. Robinson, K. Clark, and M.E. Dumont, unpublished results), and is being used in a number of structural and biochemical studies in other laboratories.18; 25; 26; 27; 28; 29 For comparison, we also included Triton X-100, a detergent used extensively in biochemical studies of membrane proteins.
To establish standard conditions for testing protein solubilization, we considered two major parameters: the critical micelle concentration (cmc) and the molar ratio of detergent to protein. To maximize the effectiveness of solubilization, all detergents were present in solubilization trials at concentrations several times higher than their cmc values (see Materials and Methods). To ensure that the amounts of detergent added for solubilization were not limiting, we performed titration experiments varying the ratio of cell lysate volume to detergent volume (Figure 4). In preliminary tests of three trial proteins using the standard detergent concentrations and standard amounts of cell lysate (see Material and Methods), we found maximum solubility at detergent:lysate ratios of 15:1 (μl detergent solution:μl lysate) with little additional change at increased detergent concentrations. Thus, we used this ratio for all further solubility tests.
Figure 4. Titrations testing detergent:lysate ratio for solubilizing conditions.
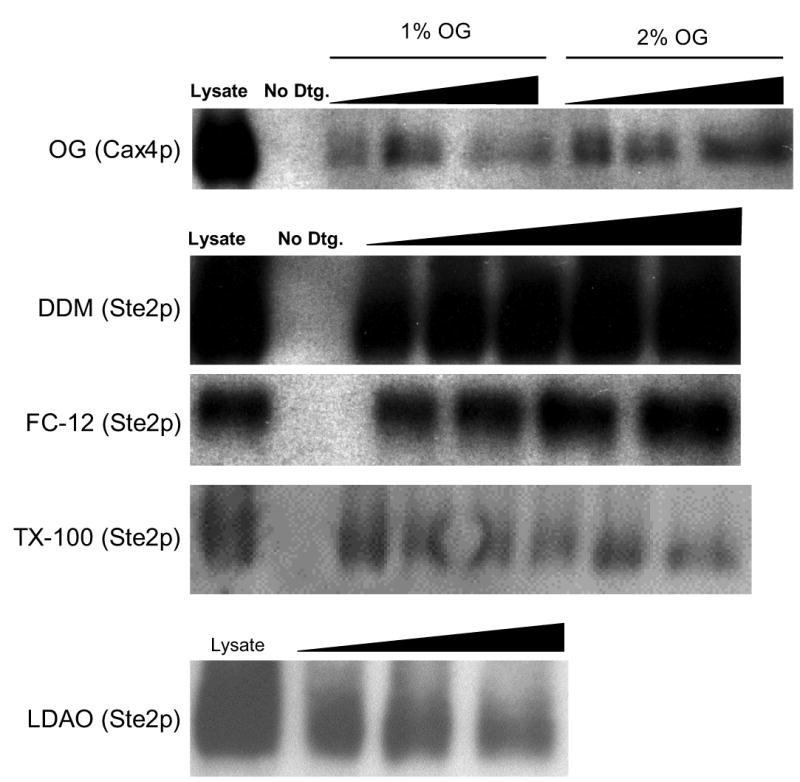
Little variation in solubility was observed for most detergents over a broad range of detergent:lysate volume ratios. Each panel shows the results of a representative immunoblot comparing total lysate to supernatants from centrifuged samples treated with detergent-free buffer or varying ratios of detergent:lysate solutions. The black triangles indicate the increasing ratios of volumes of stock detergent to lysate across the lanes of the gel. The actual ratios used were: 1% and 2% OG- 6:1, 17:1, 40:1; 1% DDM- 9:1, 10:1, 13:1, 18:1, 30:1; 1% FC12- 5:1, 8:1, 17:1, 40:1. Results for titrations with C8E4 are not shown, since none of initial trial proteins were significantly soluble in this detergent.
Of the 122 proteins tested, only nine (7.4%) exhibited more than 25% solubility in the absence of detergent. (A listing of the solubilities of individual tested proteins is available as supplementary data.) Since we selected membrane proteins for our experiments based only on TMHMM predictions, this confirms previous reports of a low rate of false positive identifications for the TMHMM algorithm.30 TMHMM predicted a total of 1,155 transmembrane proteins in the MORF collection, in contrast to HMMTOP, which predicted 2018 membrane proteins, most likely including a greater number of false positives. Of the nine proteins that were soluble without detergent, two (Pan5p, Grx2p) are known cytosolic proteins31; 32 and were falsely predicted by TMHMM to each contain a single transmembrane segment. Another protein, YHR138Cp, also predicted to contain a single transmembrane segment, is homologous to the cytosolic protein Pbi2p,33 and, thus, is also likely to be a false positive prediction of TMHMM. Two additional proteins, Gas4p and Kar2p, that are each predicted to contain one transmembrane segment, have been reported to be only peripherally associated with the membrane.34; 35. This leaves four proteins (Tvp15p, Cho1p, Ssu1p, Uip3p; ~3% of the total) that are predicted to contain multiple transmembrane segments and are annotated in SGD as authentic membrane proteins, but show at least partial solubility in the absence of detergent. The basis for this discrepancy is unknown.
Nearly all of the remaining proteins fell into only a few solubility patterns (Table 2, Figure 5). Only three proteins were classified as being insoluble (specifically, less than 50% soluble) in all detergents, but all three of these were still ~25% soluble in FC-12. The number of predicted transmembrane segments in these proteins ranged from 1 (in Dap2p) to 12 (in Alg7p) and there was no apparent similarity among them. Six proteins (Yur1p, Spc2p, Erp1p, Erp3p, Erp4p, YOR105Wp) were insoluble in all but one detergent, and that detergent was always FC-12. One of these six proteins, YOR105Wp, is a short ORF that has been classified as “dubious”. The remaining five ORFs in this class (Yur1p, Spc2p, Erp1p, Erp3p, Erp4p) are proteins that are predicted to contain 1–2 transmembrane segments and have been localized to the Golgi or endoplasmic reticulum (ER). Erp1p, Erp3p, and Erp4p are p24-class ERP proteins involved in ER to Golgi transport.36; 37; 38
Table 2.
Detergent solubility patterns
| Solubility pattern | # of proteins | % total |
|---|---|---|
| All 6 detergents | 35 | 31.0% |
| All except C8E4 | 6 | 5.3% |
| All except C8E4 and OG | 24 | 21.2% |
| Zwitterionic detergents and DDM | 12 | 10.6% |
| Zwitterionic detergents only | 18 | 15.9% |
| Only 1 detergent* | 6 | 5.3% |
| Insoluble in all^ | 3 | 2.7% |
| Miscellaneous | 4 | 3.5% |
This detergent is always FC-12
Always 25%-50% soluble in FC-12
Figure 5. Representative detergent solubility patterns.
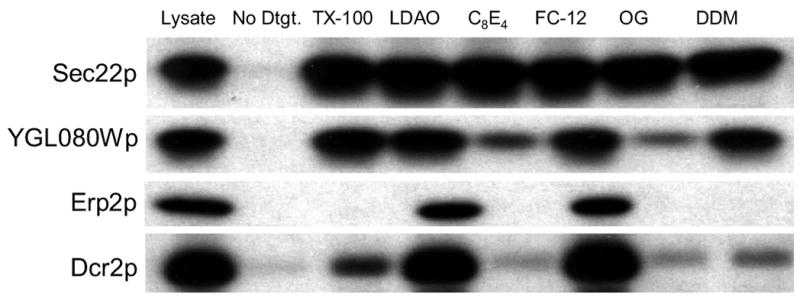
Each panel shows the results of an immunoblot for one protein comparing total lysate to the supernatant of solubilized samples or a non-solubilized negative control after centrifugation at 109,000×g for 1 hour. Fully solubilized samples show a band intensity equal to the lysate control, while poorly solubilized samples show a weak band intensity. The solubility of the samples was scored on a scale of 0–4, with 4 indicating full solubilization, as described in Materials and Methods.
Of the 113 proteins that showed broader solubility, 57% were soluble in at least four different detergents (Table 2). The two most common solubility patterns we observed were solubility in all six detergents (31% of proteins tested) and solubility an all detergents except C8E4 and OG (21% of proteins tested). With a few exceptions, the proteins that could be solubilized in the less efficient detergents tended to also be soluble in the more efficient detergents (Figure 6), indicating that solubility patterns are not dominated by specific protein-detergent interactions.
Figure 6. Overlap of soluble protein sets among six different detergents.
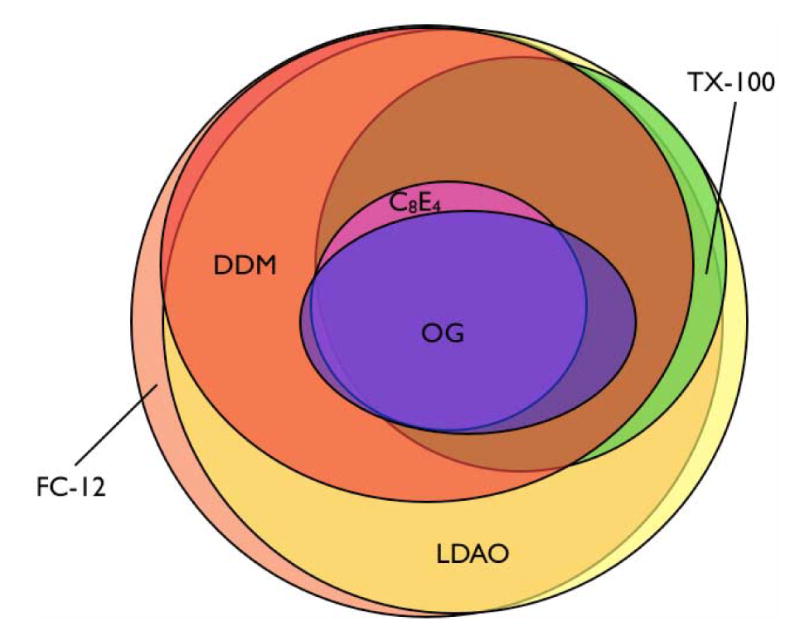
The Venn diagram visually illustrates overlapping solubilities among all six detergents tested. Three proteins were insoluble in all detergents, and one protein, Pmp2p, was soluble in all detergents except FC-12 and DDM; these proteins are not represented in the diagram.
The structures of the detergents appeared to be related to their solubilization efficiency (Figure 7): the zwitterionic detergents LDAO and FC-12 were the most effective at solubilizing, while the short chain detergents C8E4 and OG were the least effective. Zwitterionic detergents are known to solubilize membrane proteins more efficiently than non-ionic detergents.24; 39 The poor solubilization efficiency of C8E4 and OG, compared with DDM, is somewhat unexpected, given their broad use in membrane protein crystallography.
Figure 7. Solubilization efficiency of detergents.
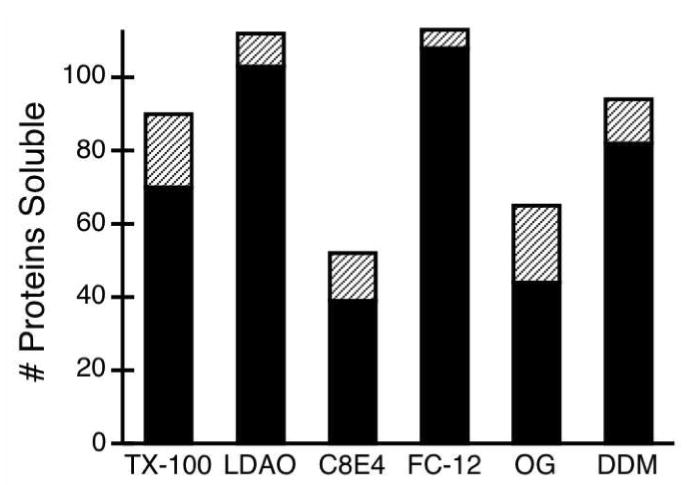
Black bars indicate the number of proteins at least 50% soluble in a given detergent (score of 3 or 4) out of a possible 113 proteins. Hatched bars show the number of proteins that were marginally soluble in a given detergent (score of 2). The zwitterionic detergents LDAO and FC-12 were the most effective solubilizers.
We used an approach similar to the one described above for protein expression to look for associations between protein characteristics and solubility in particular detergents. Because LDAO and FC-12 solubilized nearly all of the proteins tested, it is apparent that few protein characteristics affect solubility in these detergents and we therefore did not analyze these data. Furthermore, when we tested the protein characteristics listed in Table 1 for associations with protein solubilities in the remaining four detergents, TX-100, DDM, OG, and C8E4, we found no significant correlations.
Solubilities in the two least-effective detergents, OG and C8E4, were inversely correlated with protein size and number of transmembrane segments, and were also affected by the amino acid composition of the transmembrane segments, although the statistical significance of these correlations is limited by the small sample sizes. The most significant finding was that the solubilities of the tested proteins in these two detergents progressively decreased with increasing number of predicted transmembrane segments and larger size (Figure 8a and 8b). Proteins with transmembrane segments composed of more than 10% charged and polar amino acids were also somewhat less likely to be soluble than proteins with less hydrophilic transmembrane regions (Figure 8c) and proteins with more than 70% hydrophobic residues in predicted transmembrane segments were nearly twice as likely to be solublilized by OG and C8E4 than proteins with less than 70% hydrophobic residues (Figure 8d). No other significant correlations were detected between solubilities of different proteins in OG and C8E4 and the properties listed in Table 1, including subcellular localization of proteins.
Figure 8. Dependence of solubility on protein properties.
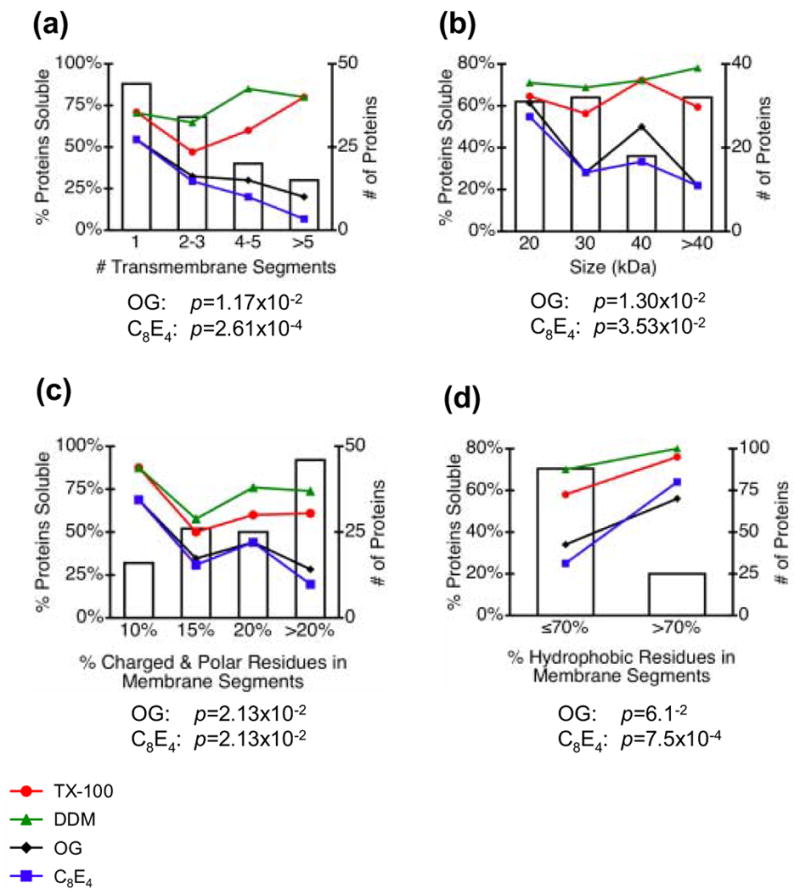
Bar graphs show the total number of proteins tested for solubility in each bin; line plots show the percentage of proteins soluble for DDM (▲, green), TX-100 (●, red), OG (♦, black) and C8E4 (■, blue) as a function of the specified protein characteristic. Correlations between DDM and TX-100 solubility and these protein properties were not statistically significant; p-values for OG and C8E4 were determined by a chi-squared test for trend in proportions as described in Materials and Methods.
The limited solubilities of some proteins in OG and C8E4 could be caused either by the relatively short lengths of the acyl chains of these detergents, or by the specific chemical configurations of their hydrophilic and hydrophobic moieties. To distinguish between these possibilities, we examined the effect of varying acyl chain lengths within different families of detergents on the ability to solubilize selected proteins that exhibited moderate solubilities in the original set of tested detergents. Several tested proteins exhibited increased solubilities with increased detergent chain lengths. Cho1p, Ost6p, and Sec66p exhibit only slight solubilities in OG, but are more readily solubilized by nonyl and decyl glucosides (Figure 9a). However, these proteins are not completely solubilized even in the longer chain detergents, suggesting either that they are intrinsically slowly or inefficiently solubilized or that they exist in heterogeneous states in the cell lysates. Pmc1p shows greater solubility in longer chain polyoxyethylene detergents (Figure 9b), but several other proteins, including Ost6p and the product of the YGL080w gene showed little or no increased solubility in the longer chain members of the polyoxyethylene family (Figure 9b). Several proteins tested with the families of FOS-choline and maltoside detergents showed increased solubilities as chain lengths increased up to 14 carbons (Figure 9c, d).
Figure 9. Effects of detergent tail lengths on membrane protein solubilization.
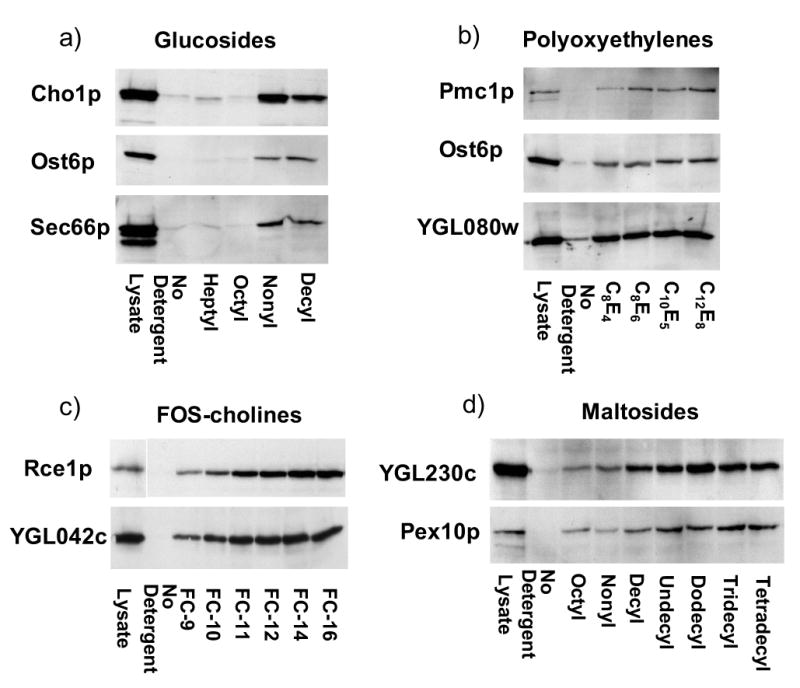
Proteins exhibiting limited solubility in OG and C8E4 were further tested for solubilities in families of related detergents with different tail lengths as described in Materials and Methods. In each case, the total protein in an equivalent amount of lysate is shown in the left-hand lane. Panels show experiments in the following detergent families: a. glucosides, b. polyoxyethylenes, c. FOS-choline series, d. maltosides.
Discussion
The ability to obtain useful amounts of solubilized membrane proteins will be critical for structural and biochemical analyses of the large numbers of these proteins present in all genomes. However, because of the difficulty of membrane protein biochemistry, most previous analyses of protein production on a genomic scale have focused on soluble proteins. Because of the differences between post-translational modification systems of different organisms and the complete absence of successful X-ray structure determinations of eukaryotic membrane proteins expressed in bacterial hosts, there are significant advantages to purification of eukaryotic membrane proteins from a homologous eukaryotic expression system. Thus, we have investigated the ability to overexpress the genomic complement of predicted transmembrane proteins of the yeast Saccharomyces cerevisiae in a yeast host. Our study of expression focused on a comparison between the 263 most highly expressed and the 378 lowest expressed predicted membrane proteins in a nearly complete genomic collection of cloned yeast ORFs.12 Among these 263 highly expressed proteins are 90 with human orthologs (as annotated in SGD), and over 40 with published activity assays. Furthermore, we have assembled a database of the detergent solubilities of a representative subset of approximately half of the high-expressing membrane proteins (see supplementary data). Considering the general difficulty of expressing, purifying, and determining the structures of membrane proteins, such a priori knowledge of the highest expressing, most readily solubilized membrane proteins in a genome allows efforts in structure determination and biochemical characterization to be focused on the subset of target ORFs with the highest likelihood of success. Our results also point to general characteristics of membrane proteins that may be useful in predicting the success of heterologous membrane production in yeast, as well as, possibly other expression systems.
We have identified parameters that specifically affect membrane protein expression, as well as parameters that affect membrane and soluble protein expression in similar ways. The association of protein size, isoelectric point, codon usage, and native number of molecules per cell with the ability to overexpress the general genomic complement of yeast proteins and, in some cases, with expression in other systems has been noted previously 12; 13 5; 22. However, the correlation of expression with isoelectric point and size was not observed for bacterial expression of C. elegans proteins 14. In addition to these properties, we find a negative correlation between the overall percentage of aromatic amino acids in both soluble and transmembrane proteins and their levels of overexpression that has not been reported previously. While the physical explanations for the relationships between these protein properties and expression levels are not known, the similarity of the correlations for membrane and soluble proteins indicates that none of these properties affect biosynthetic or degradative processes unique to membrane proteins.
In a previous analysis of the potential for overexpression of 372 E. coli inner membrane proteins with cytoplasmic C-termini in a homologous E. coli host, no significant correlations were reported between any protein properties and level of overexpression 16. The difference between these results and the correlations we have uncovered may be explained by any of several considerations: 1) Differences between the processes of membrane protein expression in comparing E. coli with yeast or in comparing proteins with cytoplasmic C-termini with the general population; 2) Differences between the sensitivity and dynamic range of the detection method we used (immunoblotting) compared with the GFP fluorescence used by Daley et al.;16 3) Differences in the measures of statistical significance used in the two studies. Whereas Daley et al. only presented correlation coefficients, the p values we report are capable of detecting even moderate correlations that are statistically significant.
The likelihood of being able to express high levels of both soluble and transmembrane proteins in the yeast system decreases significantly with overall increased hydrophobicity of the protein as measured by the GRAVY score and number of predicted transmembrane segments. Similar trends have been detected in previous studies of expression 12; 13 5; 22. However, in contrast to this negative correlation between expression and overall hydrophobicity, we find a significant positive association between levels of expression and the hydrophobicity of the amino acid sequences within predicted transmembrane segments (Figures 3a, b). This means that the behavior of transmembrane segments making up only a small fraction of overall sequence information in a protein can be a limiting factor affecting expression levels. The positive correlation between hydrophobicity of transmembrane segments and expression could reflect increased efficiency of translation provided by altered association with ribosomal components or signal recognition apparatus, increased efficiency of integration into membranes via the translocon, decreased degradation due to enhanced stability of folding, or preferential localization to particular membrane subdomains.
Despite the diversity of the machinery mediating co-translational membrane insertion in different cellular compartments that might have been expected to lead to different expression efficiencies for proteins with different intracellular trafficking patterns, no correlation was detected between the potential for overexpression and subcellular localization, N- and C-terminal topology, or the presence of a signal peptide. This suggests that there is reserve capacity to allow overexpression of proteins with various topologies in diverse cellular compartments.
Toxicity of overexpressed proteins is not a barrier to successful membrane protein expression in our system, since we have found that overexpression of membrane proteins is not significantly more toxic than overexpression of the general population of yeast proteins. We previously reported that only 88 proteins (1.6%) out of the total collection of 5,573 were lethal when tested for growth on solid media (2% raffinose + 2% galactose), and that, despite this toxicity, 67 of these proteins were present at detectable levels after a 4 hour induction in liquid media.12 An additional 320 proteins in the collection (5.7% of the total) caused slow growth. Among predicted membrane proteins, 1.7% (19 proteins) were lethal and 6.0% (66 proteins) caused slow growth. As was the case with the entire collection, most lethal membrane proteins could still be produced at detectable levels under our induction conditions (79% of lethal membrane proteins vs. 76% of all lethal proteins). We also detected no significant correlation between expression level and protein toxicity: 15 (5.7%) high expressing membrane proteins and 26 (6.9%) of low expressing membrane proteins were lethal or caused slow growth. A recent study of 567 overexpressed yeast membrane proteins found that 93% of these proteins caused growth defects17. These researchers measured growth in liquid media on microtiter plates and were thus able to detect effects on growth not apparent in our previously reported results for growth on solid medium. Despite this, viewed in the context of our focus on producing high levels of protein for purification, our results confirm that growth inhibition due to protein overexpression is not a major obstacle.
Several lines of evidence suggest that membrane proteins are expressed in the MORF system in functional forms. First, overexpressed membrane proteins with C-terminal fusions in general appear to insert correctly into the membrane. A recent study reported the experimentally determined transmembrane orientations of the C-termini of 468 yeast membrane proteins expressed from multicopy plasmids as fusions to large C-terminal tags, under control of a strong promoter.40 The authors found that the C-terminal orientations of their overexpressed membrane proteins matched results from other published reports in nearly all cases where there was independent data. Second, in our previously published report on the MORF library, we showed that glycoproteins, including many membrane proteins, are efficiently processed in this collection, especially in comparison with a similar collection expressing N-terminally tagged proteins.12 Third, we detected ATPase activity in membranes isolated from three strains expressing known membrane ATPases (Figure 10). Fourth, numerous yeast membrane proteins have previously been shown to be functional when overexpressed with C-terminal tags41; 42; 43; 44; 45; 46; 47; 48; 49; 50; 51; 52. Finally, we do not observe any accumulation of insoluble aggregates when proteins expression is induced.
Figure 10. Three known membrane ATPases are expressed in active form.
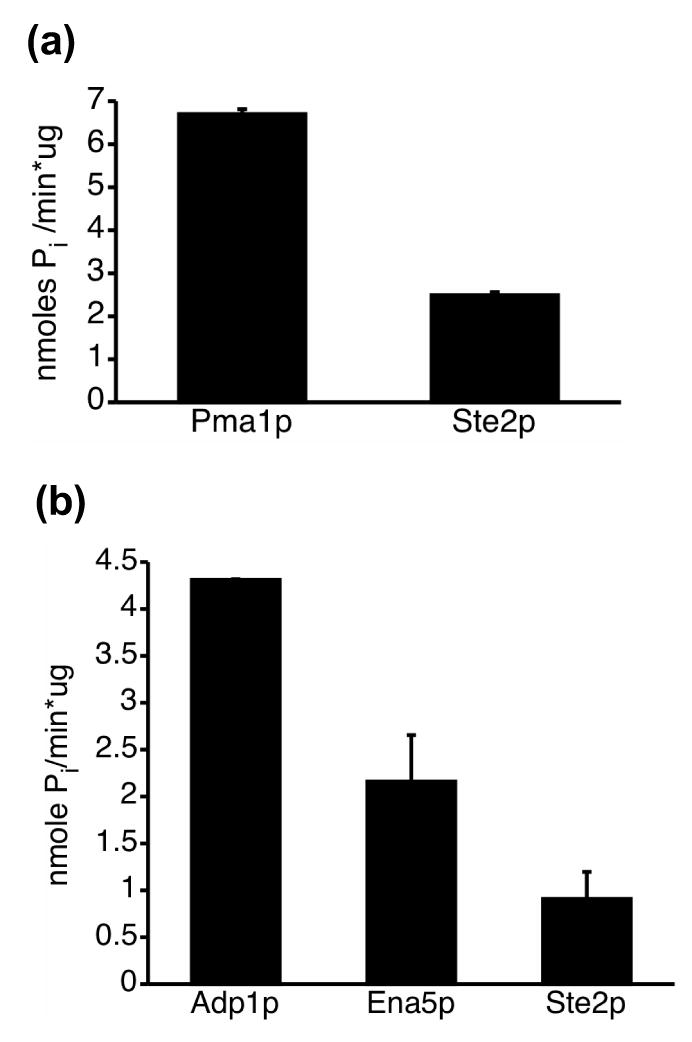
Membranes isolated from strains expressing the known membrane ATPases Pma1p, Adp1p, and Ena5p, exhibit specific ATP hydrolysis activities above the activity found in membranes isolated from a control strain expressing the pheromone receptor Ste2p. Each assay was performed in duplicate as described in Materials and Methods. a. Pma1p and the Ste2p control were assayed at pH 6. b. Adp1p, Ena5p, and the Ste2p control were assayed at pH 7.5.
We have characterized the detergent solubilities of half of the most highly expressed predicted membrane proteins in a nearly comprehensive yeast protein expression library (see supplementary data). These tests provide a measure of the ability of detergents to solubilize proteins directly from yeast membranes, an important first step in protein purification. However, given the diversity of the targeted ORFs, examining the suitability of the tested detergents for subsequent steps of purification, for protein crystallization, or for maintenance of native structure, was beyond the scope of the present study. In our tests, the zwitterionic detergents LDAO and FC-12 were the most efficient at solubilizing yeast membrane proteins, consistent with results of previous studies with smaller sets of proteins.18; 39 The high efficiency of FC-12 suggests that this could be a useful detergent for structural work or high-throughput biochemical and proteomic applications. FC-12 has been used successfully in several NMR structural studies.25; 26; 53 One membrane protein crystal structure has been reported in FC-14.54 The non-ionic detergents DDM and TX-100 were less effective than the zwitterionic detergents, but were capable of solubilizing more than 60% of the tested proteins. Since DDM has the same hydrocarbon tail structure as LDAO and FC-12, its bulky and non-ionic head group appears to interfere with its solubilizing ability relative to these zwitterionic detergents. Among non-ionic detergents however, DDM was the most efficient, and since non-ionic detergents may be less denaturing than zwitterionic detergents24, DDM could represent the best compromise between solubilization efficiency and functional preservation in a high-throughput context.
Of the detergents commonly used for x-ray crystallography, OG and C8E4 were the least generally effective for solubilization of our representative set of membrane proteins. Despite the relatively high cmc values of these two detergents (Table 3), the relative insensitivity of solubilization efficiency to changes in the relative amounts of lysate and detergent over the range we used (Figure 4) indicates that their ineffectiveness is not due to low numbers of micelles. Instead, their reduced effectiveness is likely to be the result of their shorter hydrophobic tail lengths or altered head-group properties. The differences we observe in solubilization by the three different tested detergents that all contained 12-carbon tails (LDAO, FC-12, and DDM) confirm the role of the detergent head group as a determinant of effective protein solubilization. However, solubilization trials that we conducted with families of similar detergents with different chain lengths also show that, at least in some cases, solubilization of proteins from yeast lysates can be improved by the use of detergents with longer acyl chains. Notably, we encountered cases in which limited solubilities of certain proteins in a commonly used detergent, OG, could be significantly improved by using nonyl glucoside, a less commonly used detergent that differs from OG only by the presence of one additional carbon in the acyl chain.
Table 3.
Critical micelle concentrations (CMC) of detergents
| Detergent | cmc (mM)* | cmc (%(w/v))* |
|---|---|---|
| C8E4 | 8.0 | 0.25 |
| OG | 18.0 | 0.53 |
| DDM | 0.17 | 0.0087 |
| FC-12 | 1.5 | 0.047 |
| LDAO | 1.0 | 0.023 |
| TX-100 | 0.23 | 0.015 |
Source: Anatrace catalog, available at http://www.anatrace.com/downloads.htm
We find that proteins with the highest content of hydrophobic amino acids in their predicted transmembrane segments are the most efficiently solubilized by the detergents OG and C8E4. Since these two detergents have short hydrophobic tails, this would appear to contradict simple models of membrane protein solubilization in which the most strongly hydrophobic detergents would be required to solubilize the most hydrophobic transmembrane segments. Instead, it may be the case that the most hydrophobic transmembrane segments partition effectively into the interior of micelles of even short-chain detergents whereas transmembrane segments with more polar sequences partition less well into micelles. Our results suggest that micelles comprised of long-chain detergents are more tolerant of different ranges of protein hydrophobicity than micelles of short-chain detergents.
Although to date there have been few reported successes with membrane proteins in structural genomics projects55, our results show that expression and solubilization of membrane proteins can, in fact, benefit from high-throughput approaches for identifying promising structural targets from a genomic complement of membrane proteins. The use of high-throughput approaches also allowed us to evaluate properties of membrane ORF sequences that can serve as the basis for a priori selection of protein targets with the highest likelihood of successful expression and solubilization.
Modification of sequences of transmembrane proteins based on the correlations we have described may also provide a rational strategy for improving expression and solubilization of target proteins for structure determination, although in each case the functional effect of the mutations would need to be assessed. In a previous study, Kiefer and colleagues were able to design mutant G protein coupled receptors with substantially improved expression by using a multiple linear regression approach to correlate sequences of the loop regions with levels of expression of eleven receptors.56 However unlike proteins in our system, these proteins were expressed into inclusion bodies. Other groups have attempted to improve the thermostability of membrane proteins by the introduction of mutations in the transmembrane regions.57; 58 Our results suggest that increasing the proportion of hydrophobic amino acids in transmembrane segments of membrane proteins or decreasing the overall content of aromatic residues could be used similarly to improve expression as a step toward improving the success rate for the difficult process of structure determination of membrane proteins.
Materials and methods
Identification and topology prediction of membrane proteins
Our approach to identifying probable membrane proteins was a modification of the procedure used to identify membrane proteins in our initial analysis of membrane protein expression in our S. cerevisiae library.12 Two different transmembrane helix prediction programs were used to identify and classify membrane proteins in the yeast genome. TMHMM is reported to be the best program for distinguishing membrane proteins from non-membrane proteins, especially on a genomic scale.30; 59; 60 We used TMHMM v. 2.061 (http://www.cbs.dtu.dk/services/TMHMM/) to predict 1,155 integral membrane proteins in the MORF collection. From this set of 1,155 proteins, we removed 63 that were predicted by the Phobius program62 (http://phobius.binf.ku.dk/) to have only a signal peptide and no transmembrane segments; this left us with a total of 1,092 proteins predicted to have one or more transmembrane helices. While TMHMM is reported to be the most accurate for distinguishing membrane proteins from soluble proteins, it is not necessarily the best for determining the actual topology of a membrane protein.60; 63; 64 We used HMMTOP65 predictions (http://www.enzim.hu/hmmtop/) as our best guess of the topology of the membrane proteins in our collection. In two cases (Ste2p and Pmc1p) we were aware of good data suggesting a topology different from the HMMTOP prediction and we used the empirically determined topologies in our analysis.
Overexpression of membrane proteins for solubilization experiments
Membrane proteins were expressed in strains from the MORF S. cerevisiae library.12 ORFs in this collection are cloned into a multicopy PGAL1-regulated plasmid fused C-terminally to a 19 kDa His6-HA-ZZ tag. Yeast cultures in SD –Ura (containing 2% dextrose) were grown to an OD600 of approximately 2 and used to inoculate fresh 4 mL cultures in –Ura 2% raffinose medium. These cultures were grown for 15 hours to an OD of approximately 1.2 and induced with 2 mL of 3×YPGalactose medium (yeast extract, peptone, galactose), resulting in a final concentration of 1×YP and 2% galactose. All yeast cell growth was performed at 30°C. After 6 hours, yeast cells were harvested by removing them from the culture medium, washing in 1 mL ice-cold water and freezing the cell pellets at –70° C.
Yeast cells were resuspended in lysis buffer (50 mM Tris pH 7.5, 1 mM EDTA, 1M NaCl, 1× complete protease inhibitor cocktail (Roche), 2.5 μg/mL pepstatin, 1 mM DTT) at a volume of 300 μl lysis buffer per unit OD600 at harvest. Cells were broken with 0.5 mm Zirconia/Silica beads (Biospec) by vortexing 10 times for 20 sec at 4° C, with 1 min. pauses on ice. Lysed samples were centrifuged in a microcentrifuge at 4° C and 150 × g for 5 min. The supernatant was transferred to a fresh tube and frozen at –70° C. Bradford assays66 of lysates from 10 proteins indicated that the average total protein content in lysates was 460 μg/ml.
Detergent solubilization of membrane proteins
An aliquot of 9 μl of lysate (approximately 4.2 μg total protein) was added to 141 μl of detergent solution or buffer without detergent. The buffer consisted of 20 mM Hepes pH 7.5, 500 mM NaCl, and 10% glycerol. Detergent solutions consisted of buffer and one of the following detergents (concentrations are w/v): 1% Triton X-100 (TX-100, Pierce), 1% lauryldimethylamine-N-oxide (LDAO, Anatrace), 2% tetraethyleneglycol monooctyl ether (C8E4, Anatrace), 1% FOS-choline 12 (FC-12, Anatrace), 2% n-octyl-β-D-glucoside (OG, Anatrace), or 1% n-dodecyl-β-D-maltoside (DDM, Anatrace). Samples were solubilized at room temperature for 1 hour and then centrifuged at 21° C in a Beckman Ti 42.2 rotor at 30,000 rpm (109,000 x g) for 1 hour. After centrifugation, 16 μl of supernatant or control sample was mixed with 4 μl of SDS loading buffer, heated for 5 minutes at 37° C and electrophoresed on a 26-well Criterion 8–16% SDS polyacrylamide gel (BioRad). Immunoblotting was performed using rat anti-HA primary antibody (clone 3F10, Roche) and HRP goat anti-rat secondary antibody (Jackson) for detection. Unless indicated, all additional detergents were purchased from Anatrace.
For each protein, the intensity of the signals on immunoblots from the detergent-solubilized samples were compared with the no-spin, no-detergent, total protein control and scored on a scale of 0–4, with 0 representing no signal and 4 representing a band intensity equal to the control (Figure 6). A score of 0–1 indicates insolubility in a particular detergent, while a score of 3–4 indicates nearly complete solubility in that detergent. Samples scored as 2 were marginally soluble; only samples with a score of 3 or 4, corresponding to over 50% solubility, were considered soluble in our analysis.
Database construction
Annotations for the proteins in our datasets were obtained from the following sources: size, pI, codon usage indices, aromaticity, and GRAVY scores were obtained from the Saccharomyces Genome Database (SGD);67 localization data and number of molecules per cell were obtained from SGD and the UCSF Yeast GFP Fusion Localization Database (http://yeastgfp.ucsf.edu/);21; 68 homolog data were obtained from the SGD file of best hits against model organisms, which was generated with NCBI BLASTP; properties of transmembrane regions were determined by using a Perl script to parse HMMTOP output files and protein sequences obtained from SGD. Hydrophobic amino acids were classed based on the whole-residue hydrophobicity scales of Wimley and White.69
Statistical analysis
A chi-square test for trend in proportions or Fisher’s Exact Test was used to test for an association between protein properties and expression or detergent solubility. 2 × k contingency tables were generated for each protein variable, with k being the number of variable categories (such a sub-cellular localization), or the number of bins into which numerical variables were divided (such as ranges for hydrophobicity scores). Bins were chosen to represent biologically reasonable increments of the variables, as well as to ensure a reasonable distribution of our sample set among the bins, but our conclusions were found to be insensitive to modest variations in binning. When a tested protein feature had only two possible categories, such as the presence or absence of a signal peptide, Fisher’s Exact Test was used to calculate p-values; in all other cases a chi-square trend test was used.
The null hypothesis for the statistical tests was that expression or solubility was independent of the tested protein property. More specifically, the p-value represents the probability of obtaining the distribution of cell counts in a particular contingency table by chance, given the expected distribution determined by the totals of the columns and rows of the table. For the chi-square trend test, the alternative hypothesis was that expression or solubility was dependent on the given protein characteristic, and that dependence was directional based on the numerical (as opposed to purely categorical) ordering of the property being tested. We used a significance cutoff of p<0.05, meaning that we accepted a 95% probability of correctly rejecting the null hypothesis.
These tests were carried out using the R statistical computing environment, version 2.1.0 (R Core Development Team, http://www.r-project.org/). We used the functions fisher.test and prop.trend.test for the two statistical tests. For prop.trend.test, the number of high expressers or soluble proteins is the number of events (x), the number of total proteins per bin is the number of trials (n), and the upper boundary of each bin is one element of the score vector.
ATPase assays
Following cell lysis as described above and centrifugation at 150 x g for 5 min., the supernatant was transferred to a fresh tube and centrifuged at 24,600 x g for 45 minutes at 4°C. The supernatant was removed and membranes were resuspended in resuspension buffer (50 mM Tris pH 7.5, 500 mM NaCl, 10% Glycerol, 1 mM EDTA) at 25 μl per OD-ml of original cell culture (50% of the original volume of lysis buffer added to harvested cell pellets). Membranes were stored at –20°C. Protein concentration in membrane preparations was measured by Bradford assay.66
ATPase assays were performed by the addition of 5 μl resuspended membranes (~1.5 μg protein) to 95 μl ATPase cocktail (see below) containing 10 mM ATP, followed by mixing and incubation at 37° C for 10 minutes. Reactions were stopped by the addition of 100 μl 10% SDS; as a negative control, each reaction was done in parallel with a reaction to which the SDS was added before incubation. 100 μl of Taussky & Shorr phosphate detection reagent70 was added, color was developed for 2 minutes, and the OD700 was measured. The activity was determined by subtracting the OD700 of the positive reaction from that of the negative control. This value was converted to nmoles of phosphate using a standard curve.
The ATPase cocktail at pH 6 contained 50 mM MES buffer, 9 mM MgSO4, and 10 mM NaN3, and was adjusted to pH 6 with KOH. ATP was added to the cocktail immediately before use. The assay buffer at pH 7.5 contained 50 mM Tris instead of MES buffer. The Taussky and Shorr reagent was prepared as described in Taussky and Shorr70.
Supplementary Material
Acknowledgments
This work was supported in part by NIH grant HG02311 to Eric Phizicky and U54 GM074899 to the Center for High Throughput Stuctural Biology, P.I. George DeTitta.
Abbreviations
- TX-100
Triton X-100
- LDAO
lauryldimethylamine-N-oxide
- C8E4
tetraethyleneglycol monooctyl ether
- FC-12
FOS-choline 12®
- OG
n-octyl-β-D-glucoside
- DDM
n-dodecyl-β-D-maltoside
- cmc
critical micelle concentration
- ORF
open reading frame
- SGD
Saccharomyces Genome Database
Footnotes
Publisher's Disclaimer: This is a PDF file of an unedited manuscript that has been accepted for publication. As a service to our customers we are providing this early version of the manuscript. The manuscript will undergo copyediting, typesetting, and review of the resulting proof before it is published in its final citable form. Please note that during the production process errorsmaybe discovered which could affect the content, and all legal disclaimers that apply to the journal pertain.
References
- 1.Loll PJ. Membrane protein structural biology: the high throughput challenge. J Struct Biol. 2003;142:144–53. doi: 10.1016/s1047-8477(03)00045-5. [DOI] [PubMed] [Google Scholar]
- 2.White SH. The progress of membrane protein structure determination. Protein Sci. 2004;13:1948–9. doi: 10.1110/ps.04712004. [DOI] [PMC free article] [PubMed] [Google Scholar]
- 3.Wiener MC. A pedestrian guide to membrane protein crystallization. Methods. 2004;34:364–72. doi: 10.1016/j.ymeth.2004.03.025. [DOI] [PubMed] [Google Scholar]
- 4.Werten PJ, Remigy HW, de Groot BL, Fotiadis D, Philippsen A, Stahlberg H, Grubmuller H, Engel A. Progress in the analysis of membrane protein structure and function. FEBS Lett. 2002;529:65–72. doi: 10.1016/s0014-5793(02)03290-8. [DOI] [PubMed] [Google Scholar]
- 5.Canaves JM, Page R, Wilson IA, Stevens RC. Protein biophysical properties that correlate with crystallization success in Thermotoga maritima: maximum clustering strategy for structural genomics. J Mol Biol. 2004;344:977–91. doi: 10.1016/j.jmb.2004.09.076. [DOI] [PubMed] [Google Scholar]
- 6.Jidenko M, Nielsen RC, Sorensen TL, Moller JV, le Maire M, Nissen P, Jaxel C. Crystallization of a mammalian membrane protein overexpressed in Saccharomyces cerevisiae. Proc Natl Acad Sci U S A. 2005;102:11687–91. doi: 10.1073/pnas.0503986102. [DOI] [PMC free article] [PubMed] [Google Scholar]
- 7.Long SB, Campbell EB, Mackinnon R. Crystal structure of a mammalian voltage-dependent Shaker family K+ channel. Science. 2005;309:897–903. doi: 10.1126/science.1116269. [DOI] [PubMed] [Google Scholar]
- 8.Tornroth-Horsefield S, Wang Y, Hedfalk K, Johanson U, Karlsson M, Tajkhorshid E, Neutze R, Kjellbom P. Structural mechanism of plant aquaporin gating. Nature. 2006;439:688–94. doi: 10.1038/nature04316. [DOI] [PubMed] [Google Scholar]
- 9.Wu CC, Yates JR., 3rd The application of mass spectrometry to membrane proteomics. Nat Biotechnol. 2003;21:262–7. doi: 10.1038/nbt0303-262. [DOI] [PubMed] [Google Scholar]
- 10.Santoni V, Molloy M, Rabilloud T. Membrane proteins and proteomics: un amour impossible? Electrophoresis. 2000;21:1054–70. doi: 10.1002/(SICI)1522-2683(20000401)21:6<1054::AID-ELPS1054>3.0.CO;2-8. [DOI] [PubMed] [Google Scholar]
- 11.Navarre C, Degand H, Bennett KL, Crawford JS, Mortz E, Boutry M. Subproteomics: identification of plasma membrane proteins from the yeast Saccharomyces cerevisiae. Proteomics. 2002;2:1706–14. doi: 10.1002/1615-9861(200212)2:12<1706::AID-PROT1706>3.0.CO;2-K. [DOI] [PubMed] [Google Scholar]
- 12.Gelperin DM, White MA, Wilkinson ML, Kon Y, Kung LA, Wise KJ, Lopez-Hoyo N, Jiang L, Piccirillo S, Yu H, Gerstein M, Dumont ME, Phizicky EM, Snyder M, Grayhack EJ. Biochemical and genetic analysis of the yeast proteome with a movable ORF collection. Genes Dev. 2005;19:2816–26. doi: 10.1101/gad.1362105. [DOI] [PMC free article] [PubMed] [Google Scholar]
- 13.Christendat D, Yee A, Dharamsi A, Kluger Y, Savchenko A, Cort JR, Booth V, Mackereth CD, Saridakis V, Ekiel I, Kozlov G, Maxwell KL, Wu N, McIntosh LP, Gehring K, Kennedy MA, Davidson AR, Pai EF, Gerstein M, Edwards AM, Arrowsmith CH. Structural proteomics of an archaeon. Nat Struct Biol. 2000;7:903–9. doi: 10.1038/82823. [DOI] [PubMed] [Google Scholar]
- 14.Luan CH, Qiu S, Finley JB, Carson M, Gray RJ, Huang W, Johnson D, Tsao J, Reboul J, Vaglio P, Hill DE, Vidal M, Delucas LJ, Luo M. High-throughput expression of C. elegans proteins. Genome Res. 2004;14:2102–10. doi: 10.1101/gr.2520504. [DOI] [PMC free article] [PubMed] [Google Scholar]
- 15.Lesley SA, Kuhn P, Godzik A, Deacon AM, Mathews I, Kreusch A, Spraggon G, Klock HE, McMullan D, Shin T, Vincent J, Robb A, Brinen LS, Miller MD, McPhillips TM, Miller MA, Scheibe D, Canaves JM, Guda C, Jaroszewski L, Selby TL, Elsliger MA, Wooley J, Taylor SS, Hodgson KO, Wilson IA, Schultz PG, Stevens RC. Structural genomics of the Thermotoga maritima proteome implemented in a high-throughput structure determination pipeline. Proc Natl Acad Sci U S A. 2002;99:11664–9. doi: 10.1073/pnas.142413399. [DOI] [PMC free article] [PubMed] [Google Scholar]
- 16.Daley DO, Rapp M, Granseth E, Melen K, Drew D, von Heijne G. Global topology analysis of the Escherichia coli inner membrane proteome. Science. 2005;308:1321–3. doi: 10.1126/science.1109730. [DOI] [PubMed] [Google Scholar]
- 17.Osterberg M, Kim H, Warringer J, Melen K, Blomberg A, von Heijne G. Phenotypic effects of membrane protein overexpression in Saccharomyces cerevisiae. Proc Natl Acad Sci U S A. 2006;103:11148–53. doi: 10.1073/pnas.0604078103. [DOI] [PMC free article] [PubMed] [Google Scholar]
- 18.Eshaghi S, Hedren M, Nasser MI, Hammarberg T, Thornell A, Nordlund P. An efficient strategy for high-throughput expression screening of recombinant integral membrane proteins. Protein Sci. 2005;14:676–83. doi: 10.1110/ps.041127005. [DOI] [PMC free article] [PubMed] [Google Scholar]
- 19.Korepanova A, Gao FP, Hua Y, Qin H, Nakamoto RK, Cross TA. Cloning and expression of multiple integral membrane proteins from Mycobacterium tuberculosis in Escherichia coli. Protein Sci. 2005;14:148–58. doi: 10.1110/ps.041022305. [DOI] [PMC free article] [PubMed] [Google Scholar]
- 20.Kyte J, Doolittle RF. A simple method for displaying the hydropathic character of a protein. J Mol Biol. 1982;157:105–32. doi: 10.1016/0022-2836(82)90515-0. [DOI] [PubMed] [Google Scholar]
- 21.Ghaemmaghami S, Huh WK, Bower K, Howson RW, Belle A, Dephoure N, O'Shea EK, Weissman JS. Global analysis of protein expression in yeast. Nature. 2003;425:737–41. doi: 10.1038/nature02046. [DOI] [PubMed] [Google Scholar]
- 22.Goh CS, Lan N, Douglas SM, Wu B, Echols N, Smith A, Milburn D, Montelione GT, Zhao H, Gerstein M. Mining the structural genomics pipeline: identification of protein properties that affect high-throughput experimental analysis. J Mol Biol. 2004;336:115–30. doi: 10.1016/j.jmb.2003.11.053. [DOI] [PubMed] [Google Scholar]
- 23.Dwight SS, Harris MA, Dolinski K, Ball CA, Binkley G, Christie KR, Fisk DG, Issel-Tarver L, Schroeder M, Sherlock G, Sethuraman A, Weng S, Botstein D, Cherry JM. Saccharomyces Genome Database (SGD) provides secondary gene annotation using the Gene Ontology (GO) Nucleic Acids Res. 2002;30:69–72. doi: 10.1093/nar/30.1.69. [DOI] [PMC free article] [PubMed] [Google Scholar]
- 24.le Maire M, Champeil P, Moller JV. Interaction of membrane proteins and lipids with solubilizing detergents. Biochim Biophys Acta. 2000;1508:86–111. doi: 10.1016/s0304-4157(00)00010-1. [DOI] [PubMed] [Google Scholar]
- 25.MacKenzie KR, Prestegard JH, Engelman DM. A transmembrane helix dimer: structure and implications. Science. 1997;276:131–3. doi: 10.1126/science.276.5309.131. [DOI] [PubMed] [Google Scholar]
- 26.Arora A, Abildgaard F, Bushweller JH, Tamm LK. Structure of outer membrane protein A transmembrane domain by NMR spectroscopy. Nat Struct Biol. 2001;8:334–8. doi: 10.1038/86214. [DOI] [PubMed] [Google Scholar]
- 27.Li XD, Villa A, Gownley C, Kim MJ, Song J, Auer M, Wang DN. Monomeric state and ligand binding of recombinant GABA transporter from Escherichia coli. FEBS Lett. 2001;494:165–9. doi: 10.1016/s0014-5793(01)02334-1. [DOI] [PubMed] [Google Scholar]
- 28.Loll PJ, Tretiakova A, Soderblom E. Compatibility of detergents with the microbatch-under-oil crystallization method. Acta Crystallogr D Biol Crystallogr. 2003;59:1114–6. doi: 10.1107/s0907444903008175. [DOI] [PubMed] [Google Scholar]
- 29.West M, Park D, Dodd JR, Kistler J, Christie DL. Purification and characterization of the creatine transporter expressed at high levels in HEK293 cells. Protein Expr Purif. 2005;41:393–401. doi: 10.1016/j.pep.2005.02.019. [DOI] [PubMed] [Google Scholar]
- 30.Kall L, Sonnhammer EL. Reliability of transmembrane predictions in whole-genome data. FEBS Lett. 2002;532:415–8. doi: 10.1016/s0014-5793(02)03730-4. [DOI] [PubMed] [Google Scholar]
- 31.White WH, Gunyuzlu PL, Toyn JH. Saccharomyces cerevisiae is capable of de Novo pantothenic acid biosynthesis involving a novel pathway of beta-alanine production from spermine. J Biol Chem. 2001;276:10794–800. doi: 10.1074/jbc.M009804200. [DOI] [PubMed] [Google Scholar]
- 32.Pedrajas JR, Porras P, Martinez-Galisteo E, Padilla CA, Miranda-Vizuete A, Barcena JA. Two isoforms of Saccharomyces cerevisiae glutaredoxin 2 are expressed in vivo and localize to different subcellular compartments. Biochem J. 2002;364:617–23. doi: 10.1042/BJ20020570. [DOI] [PMC free article] [PubMed] [Google Scholar]
- 33.Slusarewicz P, Xu Z, Seefeld K, Haas A, Wickner WT. I2B is a small cytosolic protein that participates in vacuole fusion. Proc Natl Acad Sci U S A. 1997;94:5582–7. doi: 10.1073/pnas.94.11.5582. [DOI] [PMC free article] [PubMed] [Google Scholar]
- 34.Hamada K, Terashima H, Arisawa M, Yabuki N, Kitada K. Amino acid residues in the omega-minus region participate in cellular localization of yeast glycosylphosphatidylinositol-attached proteins. J Bacteriol. 1999;181:3886–9. doi: 10.1128/jb.181.13.3886-3889.1999. [DOI] [PMC free article] [PubMed] [Google Scholar]
- 35.Tokunaga M, Kawamura A, Kohno K. Purification and characterization of BiP/Kar2 protein from Saccharomyces cerevisiae. J Biol Chem. 1992;267:17553–9. [PubMed] [Google Scholar]
- 36.Springer S, Chen E, Duden R, Marzioch M, Rowley A, Hamamoto S, Merchant S, Schekman R. The p24 proteins are not essential for vesicular transport in Saccharomyces cerevisiae. Proc Natl Acad Sci U S A. 2000;97:4034–9. doi: 10.1073/pnas.070044097. [DOI] [PMC free article] [PubMed] [Google Scholar]
- 37.Lussier M, Sdicu AM, Camirand A, Bussey H. Functional characterization of the YUR1, KTR1, and KTR2 genes as members of the yeast KRE2/MNT1 mannosyltransferase gene family. J Biol Chem. 1996;271:11001–8. doi: 10.1074/jbc.271.18.11001. [DOI] [PubMed] [Google Scholar]
- 38.Mullins C, Meyer HA, Hartmann E, Green N, Fang H. Structurally related Spc1p and Spc2p of yeast signal peptidase complex are functionally distinct. J Biol Chem. 1996;271:29094–9. doi: 10.1074/jbc.271.46.29094. [DOI] [PubMed] [Google Scholar]
- 39.Navarrete R, Serrano R. Solubilization of yeast plasma membranes and mitochondria by different types of non-denaturing detergents. Biochim Biophys Acta. 1983;728:403–8. doi: 10.1016/0005-2736(83)90512-6. [DOI] [PubMed] [Google Scholar]
- 40.Kim H, Melen K, Osterberg M, von Heijne G. A global topology map of the Saccharomyces cerevisiae membrane proteome. Proc Natl Acad Sci U S A. 2006;103:11142–7. doi: 10.1073/pnas.0604075103. [DOI] [PMC free article] [PubMed] [Google Scholar]
- 41.Zhao R, Reithmeier RA. Expression and characterization of the anion transporter homologue YNL275w in Saccharomyces cerevisiae. Am J Physiol Cell Physiol. 2001;281:C33–45. doi: 10.1152/ajpcell.2001.281.1.C33. [DOI] [PubMed] [Google Scholar]
- 42.Ernst R, Klemm R, Schmitt L, Kuchler K. Yeast ATP-binding cassette transporters: cellular cleaning pumps. Methods Enzymol. 2005;400:460–84. doi: 10.1016/S0076-6879(05)00026-1. [DOI] [PubMed] [Google Scholar]
- 43.Mullner H, Deutsch G, Leitner E, Ingolic E, Daum G. YEH2/YLR020c encodes a novel steryl ester hydrolase of the yeast Saccharomyces cerevisiae. J Biol Chem. 2005;280:13321–8. doi: 10.1074/jbc.M409914200. [DOI] [PubMed] [Google Scholar]
- 44.Schmitz C, Kinner A, Kolling R. The deubiquitinating enzyme Ubp1 affects sorting of the ATP-binding cassette-transporter Ste6 in the endocytic pathway. Mol Biol Cell. 2005;16:1319–29. doi: 10.1091/mbc.E04-05-0425. [DOI] [PMC free article] [PubMed] [Google Scholar]
- 45.Iida K, Tada T, Iida H. Molecular cloning in yeast by in vivo homologous recombination of the yeast putative alpha1 subunit of the voltage-gated calcium channel. FEBS Lett. 2004;576:291–6. doi: 10.1016/j.febslet.2004.09.021. [DOI] [PubMed] [Google Scholar]
- 46.Lemaire C, Guibet-Grandmougin F, Angles D, Dujardin G, Bonnefoy N. A yeast mitochondrial membrane methyltransferase-like protein can compensate for oxa1 mutations. J Biol Chem. 2004;279:47464–72. doi: 10.1074/jbc.M404861200. [DOI] [PubMed] [Google Scholar]
- 47.Mitsui K, Ochi F, Nakamura N, Doi Y, Inoue H, Kanazawa H. A novel membrane protein capable of binding the Na+/H+ antiporter (Nha1p) enhances the salinity-resistant cell growth of Saccharomyces cerevisiae. J Biol Chem. 2004;279:12438–47. doi: 10.1074/jbc.M310806200. [DOI] [PubMed] [Google Scholar]
- 48.Mitsui K, Yasui H, Nakamura N, Kanazawa H. Oligomerization of the Saccharomyces cerevisiae Na+/H+ antiporter Nha1p: implications for its antiporter activity. Biochim Biophys Acta. 2005;1720:125–36. doi: 10.1016/j.bbamem.2005.11.005. [DOI] [PubMed] [Google Scholar]
- 49.Schnabl M, Oskolkova OV, Holic R, Brezna B, Pichler H, Zagorsek M, Kohlwein SD, Paltauf F, Daum G, Griac P. Subcellular localization of yeast Sec14 homologues and their involvement in regulation of phospholipid turnover. Eur J Biochem. 2003;270:3133–45. doi: 10.1046/j.1432-1033.2003.03688.x. [DOI] [PubMed] [Google Scholar]
- 50.Bajaj A, Celic A, Ding FX, Naider F, Becker JM, Dumont ME. A fluorescent alpha-factor analogue exhibits multiple steps on binding to its G protein coupled receptor in yeast. Biochemistry. 2004;43:13564–78. doi: 10.1021/bi0494018. [DOI] [PubMed] [Google Scholar]
- 51.Tam A, Schmidt WK, Michaelis S. The multispanning membrane protein Ste24p catalyzes CAAX proteolysis and NH2-terminal processing of the yeast a-factor precursor. J Biol Chem. 2001;276:46798–806. doi: 10.1074/jbc.M106150200. [DOI] [PubMed] [Google Scholar]
- 52.Dolence JM, Steward LE, Dolence EK, Wong DH, Poulter CD. Studies with recombinant Saccharomyces cerevisiae CaaX prenyl protease Rce1p. Biochemistry. 2000;39:4096–104. doi: 10.1021/bi9923611. [DOI] [PubMed] [Google Scholar]
- 53.Lauterwein J, Bosch C, Brown LR, Wuthrich K. Physicochemical studies of the protein-lipid interactions in melittin-containing micelles. Biochim Biophys Acta. 1979;556:244–64. doi: 10.1016/0005-2736(79)90046-4. [DOI] [PubMed] [Google Scholar]
- 54.Bass RB, Strop P, Barclay M, Rees DC. Crystal structure of Escherichia coli MscS, a voltage-modulated and mechanosensitive channel. Science. 2002;298:1582–7. doi: 10.1126/science.1077945. [DOI] [PubMed] [Google Scholar]
- 55.Lunin VV, Dobrovetsky E, Khutoreskaya G, Zhang R, Joachimiak A, Doyle DA, Bochkarev A, Maguire ME, Edwards AM, Koth CM. Crystal structure of the CorA Mg2+ transporter. Nature. 2006;440:833–7. doi: 10.1038/nature04642. [DOI] [PMC free article] [PubMed] [Google Scholar]
- 56.Kiefer H, Vogel R, Maier K. Bacterial expression of G-protein-coupled receptors: prediction of expression levels from sequence. Receptors Channels. 2000;7:109–19. [PubMed] [Google Scholar]
- 57.Zhou Y, Bowie JU. Building a thermostable membrane protein. J Biol Chem. 2000;275:6975–9. doi: 10.1074/jbc.275.10.6975. [DOI] [PubMed] [Google Scholar]
- 58.Xie G, Gross AK, Oprian DD. An opsin mutant with increased thermal stability. Biochemistry. 2003;42:1995–2001. doi: 10.1021/bi020611z. [DOI] [PubMed] [Google Scholar]
- 59.Moller S, Croning MD, Apweiler R. Evaluation of methods for the prediction of membrane spanning regions. Bioinformatics. 2001;17:646–53. doi: 10.1093/bioinformatics/17.7.646. [DOI] [PubMed] [Google Scholar]
- 60.Chen CP, Kernytsky A, Rost B. Transmembrane helix predictions revisited. Protein Sci. 2002;11:2774–91. doi: 10.1110/ps.0214502. [DOI] [PMC free article] [PubMed] [Google Scholar]
- 61.Krogh A, Larsson B, von Heijne G, Sonnhammer EL. Predicting transmembrane protein topology with a hidden Markov model: application to complete genomes. J Mol Biol. 2001;305:567–80. doi: 10.1006/jmbi.2000.4315. [DOI] [PubMed] [Google Scholar]
- 62.Kall L, Krogh A, Sonnhammer EL. A combined transmembrane topology and signal peptide prediction method. J Mol Biol. 2004;338:1027–36. doi: 10.1016/j.jmb.2004.03.016. [DOI] [PubMed] [Google Scholar]
- 63.Ideka M, Arai M, Lao DM, Shimizu T. Transmembrane topology prediction methods: a reassessment and improvement by a consensus method using a dataset of experimentally-characterized transmembrane topologies. In Silico Biol. 2002;2:19–33. [PubMed] [Google Scholar]
- 64.Lehnert U, Xia Y, Royce TE, Goh CS, Liu Y, Senes A, Yu H, Zhang ZL, Engelman DM, Gerstein M. Computational analysis of membrane proteins: genomic occurrence, structure prediction and helix interactions. Q Rev Biophys. 2004;37:121–46. doi: 10.1017/s003358350400397x. [DOI] [PubMed] [Google Scholar]
- 65.Tusnady GE, Simon I. The HMMTOP transmembrane topology prediction server. Bioinformatics. 2001;17:849–50. doi: 10.1093/bioinformatics/17.9.849. [DOI] [PubMed] [Google Scholar]
- 66.Bradford M. A rapid and sensitive method for the quantitation of micogram quantities of protein utilizing the principle of dye-binding. Anal Biochem. 1976;72:248–254. doi: 10.1016/0003-2697(76)90527-3. [DOI] [PubMed] [Google Scholar]
- 67.Balakrishnan R, Christie KR, Costanzo MC, Dolinski K, Dwight SS, Engel SR, Fisk DG, Hirschman JE, Hong EL, Nash R, Oughtred R, Skrzypek M, Theesfeld CL, Binkley G, Lane C, Schroeder M, Sethuraman A, Dong S, Weng S, Miyasato S, Andrada R, Botstein D, Cherry JM. Saccharomyces Genome Database. 2005 ftp://ftp.yeastgenome.org/yeast/
- 68.Huh WK, Falvo JV, Gerke LC, Carroll AS, Howson RW, Weissman JS, O'Shea EK. Global analysis of protein localization in budding yeast. Nature. 2003;425:686–91. doi: 10.1038/nature02026. [DOI] [PubMed] [Google Scholar]
- 69.Wimley WC, Creamer TP, White SH. Solvation energies of amino acid side chains and backbone in a family of host-guest pentapeptides. Biochemistry. 1996;35:5109–24. doi: 10.1021/bi9600153. [DOI] [PubMed] [Google Scholar]
- 70.Taussky HH, Shorr E. A microcolorimetric method for the determination of inorganic phosphorus. J Biol Chem. 1953;202:675–85. [PubMed] [Google Scholar]
Associated Data
This section collects any data citations, data availability statements, or supplementary materials included in this article.