

Abstract
When asked to imagine a visual scene, such as an ant crawling on a checkered table cloth toward a jar of jelly, individuals subjectively report different vividness in their mental visualization. We show that reported vividness can be correlated with two objective measures: the early visual cortex activity relative to the whole brain activity measured by functional magnetic resonance imaging (fMRI) and the performance on a novel psychophysical task. These results show that individual differences in the vividness of mental imagery are quantifiable even in the absence of subjective report.
1. Introduction
Visualize the sun rising above a rocky mountain range into a bright sky. How vivid is your mental picture on a scale from 1 to 5, where 1 is akin to a photograph, and 5 is a pictureless concept? Subjective measures have found a wide distribution in the vividness of the visual images that different individuals generate (Amedi, Malach, and Pascual-Leone, 2005; Hatakeyama, 1997; Marks, 1973; McKelvie, and Demers, 1979; McKelvie, 1994). We here seek to find whether this individual variability is objectively measurable – specifically, whether subjective reports are correlated with measures of blood flow (fMRI) and/or performance on a visual psychophysical task.
Accumulating evidence suggests that the neural substrates of visual imagery are similar to those of visual perception (Farah, 1988; Ganis, Thompson, and Kosslyn, 2004; Ishai, and Sagi, 1995; Kosslyn, Thompson, and Alpert, 1997; Kreiman, Koch, and Fried, 2000) – not surprisingly, therefore, the visual cortex is widely activated during imagery (Amedi, Malach, and Pascual-Leone, 2005; Ganis, Thompson, and Kosslyn, 2004; Kosslyn, and Alpert, et al, 1993; 1995; Kosslyn, Thompson, and Alpert, 1997; Mellet, and Tzourio, et al, 1995). A previous study has suggested that visual cortex activity and vividness of visual imagery have a trend of positive correlation (Amedi, Malach, and Pascual-Leone, 2005). Thus visual cortex activity is a promising candidate for an objective index of the subjective vividness.
If visual cortex activity correlates with reported vividness of visual imagery, then it is possible that performance on a psychophysical task which utilizes the visual cortex may also differentiate visualizers (Hatakeyama, 1997). To this end, we have developed a color perception and naming task as our probe. The reason for using this task, besides its dependence on the visual cortex, was based on an observation in our laboratory that those who were more visually oriented showed a diminished ability to identify a briefly displayed color word when the background screen color matched the word meaning. To test that hypothesis, we sought to systematically determine whether high visualization and poor performance on our color-naming task were indeed correlated.
2. Methods
2.1 Subjects
Eight subjects (6 Males, 2 Females, ages 25–31) participated in the following three experiments: subjective vividness rating, color naming task, and visualization task while being scanned by fMRI scanner. Two additional participants were excluded from the analysis because their accuracy in the color naming task was less than 35%, where chance performance was 25%.
2.2 Subjective vividness rating
We measured participants’ vividness of visual imagery (VVI) with a standardized battery of visualization questions (Marks, 1973) which are listed in the supporting online material. The average of the vividness ratings of the 16 questions was used. Note that a low VVI score means vivid imagery and a high score means vague imagery.
2.3 Color naming task
In the color naming task, we asked participants to report the identity of the words briefly flashed on a computer screen (Figure 2A). On each trial, the background screen color turned yellow, orange, or purple, and 32 msec later the word “yellow”, “orange”, “purple”, or no word appeared in a central rectangle for 32 msec. The words were always in black. Participants reported on the keyboard which of the three words they saw (or no word). Each participant completed 120 trials.
Figure 2. Word-color interference correlates with subjective and objective measures of visual imagery.
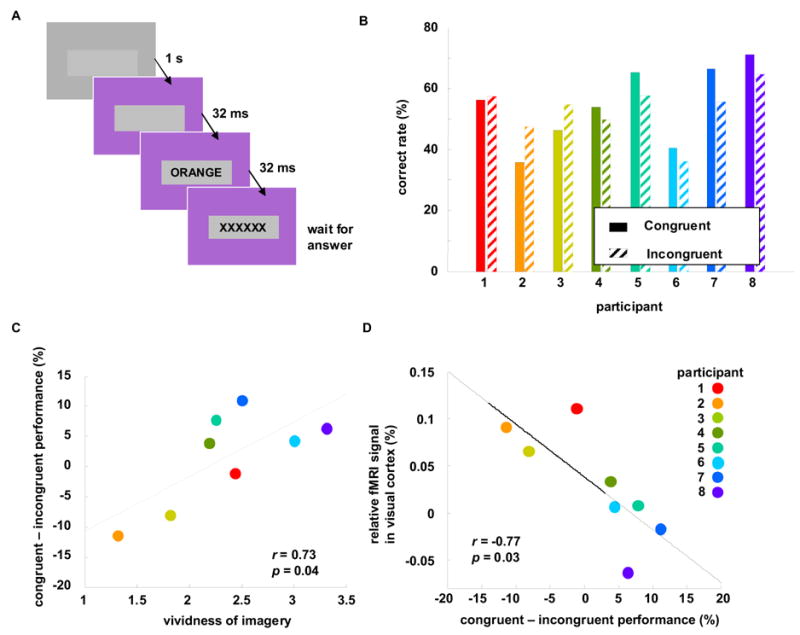
(A) Timeline of the color word identification task. On each trial, the background screen color turned from gray to yellow, orange, or purple, and 32 msec later the word “yellow”, “orange”, “purple”, or no word flashed for 32 msec in a central rectangle. Participants reported on the keyboard which of the three words they saw (or no word). (B) The performance in congruent trials (where word and background color were the same) and incongruent trials (word and background color were different). Participants are ordered as in Fig 1. (C) Correlation between vividness of visual imagery and the congruent-incongruent performance. The latter is defined as the difference between performances on congruent versus incongruent trials, as seen in B. (D) Correlation between the relative visual cortex activity and congruent-incongruent performance.
2.4 Visualization task
In the fMRI scanner, the participants were blindfolded with their eyes covered by sleeping masks. Each participant completed 24 trials. In the beginning of each trial, the participants were given auditory instructions to visualize themselves or another person either bench pressing or stair climbing. The participants were asked to begin visualization upon hearing an auditory “go” signal, and continue visualization until they heard an auditory ‘stop’ signal. The duration between ‘go’ and ‘stop’ was set to be 10 seconds. The next trial started 10 seconds after the ‘stop’ signal, resulting a 10-second rest phase (Figure 1A).
Figure 1. Relative activity in visual cortex correlates with subjective vividness rating.
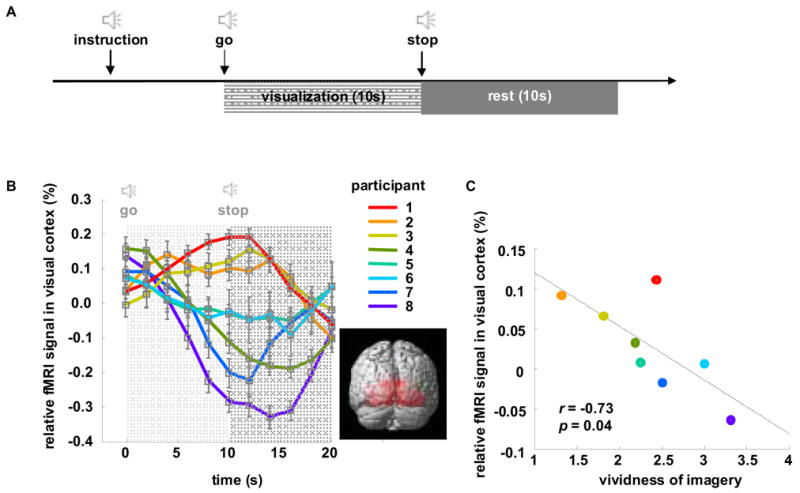
(A) Timeline of the visualization task. Participants began to visualize upon hearing the ‘go’ signal, and stopped visualization upon hearing the ‘stop’ signal, resulting a 10-second visualization phase and 10-second rest phase. All instructions are auditory. (B) Time course of the relative fMRI signal in visual cortex for 8 participants. Relative fMRI is taken as the BOLD signal in early visual cortex (Brodmann’s areas 17 and 18, illustrated in inset) minus the BOLD signal measured over all of gray matter. For plotting purposes, participants are ordered by their relative visual cortex activity averaged over the visualization window of 0 – 10 sec. The negative signal for some subjects is due in part to the subtraction of the whole brain activity – i.e., other regions can increase more than the visual cortex during the time window. (C) The relative visual cortex signal averaged over the visualization window correlates significantly with the subjective rating of vividness (p=0.04).
2.5 fMRI methods
Images were acquired with a 3T Siemens scanner. High-resolution T1-weighted scans were acquired using an MPRage sequence (Siemens) prior to the functional scan. Functional run details: echo-planar imaging, gradient recalled echo; repetition time (TR) = 2000 ms; echo time (TE) = 40 ms; flip angle = 90°; 64 × 64 matrix, twenty-nine 4 mm axial slices, yielding functional 3.4 mm × 3.4 mm × 4.0 mm voxels. Data analysis was performed using SPM2 (Wellcome Department of Imaging Neuroscience, University College London, United Kingdom; http://www.fil.ion.ucl.ac.uk/spm/spm2.html) and visualized using xjView (http://people.hnl.bcm.tmc.edu/cuixu/xjView). Motion correction to the first functional scan was performed using a six-parameter rigid-body transformation (Kao, Davis, and Gabrieli, 2005). The mean of the motion-corrected images was co-registered to each individual’s structural image using a 12-parameter affine transformation. Slice timing artifact was corrected, after which the images were spatially normalized to the MNI template by applying a 12-parameter affine transformation, followed by a nonlinear warping using basis functions. Images were then smoothed with an 8 mm isotropic Gaussian kernel and highpass filtered in the temporal domain (filter width of 128s) (King-Casas, Tomlin, et al, 2005).
We used as our region of interest the early visual cortex -- specifically, Brodmann areas 17 and 18 (Fig 1B inset), as defined in the database of MNI Space Utility (http://www.ihb.spb.ru/%7Epet_lab/MSU/MSUMain.html). This area contains 526 voxels. We calculated the relative fMRI signal in visual cortex as the following: The time series of fMRI signals were averaged across the 526 voxels in the visual cortex. The baseline of the averaged signal was calculated by moving average (with window size 200s). The averaged signal was then subtracted by the baseline (detrending). The detrended signal was divided by the baseline to obtain the percentage change of fMRI signal in visual cortex. We then subtracted this signal by the percentage change of signal of the whole brain gray matter and obtained the relative fMRI signal in visual cortex. The gray matter (containing 8451 voxels) is also defined by MNI Space Utility. The resulting signal is then averaged over the 10-second imagery window to obtain Figure 1C, Figure 2C and Figure 2D. We subtracted the visual cortex signal by the whole brain gray matter signal to determine the visual cortex activity relative to that of the whole brain. This subtraction – spatial baseline removal – can be viewed as the counterpart of the temporal baseline removal employed in most fMRI time series analysis. We felt this was important to isolate changes specific to visual cortex instead of changes in whole brain activity. We also repeated the analysis without removing the spatial baseline.
3. Results
3.1 Vividness of visual imagery correlates with fMRI activity in early visual cortex
The relative visual cortex activity starts to differentiate for different subjects during the visualization phase and then gradually converges during the rest phase (Figure 1B). We averaged the relative visual cortex activity over the visualization window (0 – 10 sec) for all participants and correlated it with their subjective VVI scores. We found a strong correlation (Figure 1C, r = −0.73, p = 0.04), demonstrating that higher relative visual cortex activity indexes more vivid imagery (a lower VVI score). This result suggests one can measure visual cortex activity to probe the vividness of a subjects’ imagery, thus obtaining a more objective measure of a previously subjective rating.
3.2 Performance on a novel psychophysical task correlates with vividness of imagery and visual cortex activity
On average, the eight participants displayed 54±3% accuracy in identifying which word was displayed, and 85±7% accuracy in identifying that no word was presented. We noted a small, seemingly random difference in accuracy between the trials in which the displayed word matched the background color (‘congruent’) and when it did not match (‘incongruent’): we will refer to this as the congruent–incongruent performance (Figure 2B). This difference was often small and could easily be dismissed as noise, but observation of the participants led us to notice that those who were more visually oriented (lower VVI score) seemed more likely to suffer diminished performance in congruent trials. To test this, we correlated VVI and the congruent–incongruent performance and found a good correlation (r=0.73, p=0.04, Figure 2C), indicating that subjects with stronger visual imagery are more susceptible to same-color interference. We then correlated visual cortex activity with the congruent–incongruent performance difference, and found high significance (Figure 2D, r= −0.77, p=0.03).
4. Discussion
These findings emphasize the importance of examining individual subject variability. For imaging data, averaging the relative visual cortex activity (Figure 1B) across subjects would have led to the conclusion that the visual cortex did not significantly change during visualization phase. Indeed, a conventional general linear model (GLM) and random effect analysis was done using SPM2 (see Methods) and the resulted t-values in visual cortex were not significant (data not shown). For behavior data, averaging the performance accuracy from the word-naming experiment (Figure 2B) would have erased the individual differences between the congruent and incongruent performances of the subjects. Only upon more detailed inspection of the individual fluctuations does a pattern emerge. Specifically, these data indicate that subjects who are more visual in subjective measures (VVI) and objective measures (bloodflow in visual cortex) are more susceptible to a color-naming interference. Note that this effect is the opposite of the Stroop effect (Stroop, 1935), in which incongruence between an ink color and the color-name leads to cognitive conflict and slower reaction times. Here, for the more visual subjects, incongruent colors make it easier to see a color word. These findings imply an increased interaction between brain areas that code for color perception and color naming in highly visual individuals. Areas potentially implicated in this increased language-imagery interaction are medial occipito-temporal cortex (in particular, human area V4 or areas just anterior to it (Zeki, and Watson, et al, 1991), in which lesions lead to achromotopsia, a deficit in color perception (Bouvier, and Engel, 2006)) and left occipital lobe (in which lesions cause color anomia, a deficit in color naming (De Vreese, 1991)). Whether this increased interaction results from increased visualization skills, or instead explains it, remains an open question.
Our findings may have applications in legal settings. It has been reported that false memories occur more easily for high visualizers than for low visualizers (Dobson, and Markham, 1993; Douglas, 1996; Wilson, and Barber, 1978). If an eyewitness is a high visualizer, her accuracy of recalling the actual crime scene may be compromised, especially during a forensic investigation procedure called the cognitive interview (CI), in which she is explicitly asked to visualize scenes from the perspective of a person or an object located in another position in the room (Geiselman, and Fisher, et al, 1986). Some authors thus suggest abandoning the imagery component of the CI (Ceci, and Bruck, 1995; Douglas, 1996). Our findings suggest that instead of abandoning the imagery, one might use our objective methods of evaluating imagery ability prior to the CI to flag witnesses who might be more susceptible to false recall. More broadly, and with further study, the objective methods introduced here might be used in forensic investigations to generate an index of the reliability of eyewitness recall.
Previously, the vividness of a person’s imagery has been accessible only through verbal report. Our study shows that we can read out an individual’s ‘private’ imagery vividness by measuring blood flow changes in early visual cortex. This finding is conceptually interesting because it shows that aspects of mental thought can be studied objectively with current technology (e.g. fMRI). It is also practically promising: though still more inconvenient to administer than self report, it opens the possibility that we can measure vividness by more than one method. Subjective rating is a standard method in psychology and psychophysics. However, there are few methods to check its truthfulness and validity (Prelec, 2004). In some cases people may lie if there is a conflict of interest (e.g. during forensic investigation). Thus an objective measure is at least beneficial and sometimes necessary. Finally, while it is true that the VVIQ is easier to administer than a neuroimaging experiment, in some cases (e.g. forensic investigation) objectivity may be sufficiently important that the cost of fMRI scan is trivial. In extreme cases (e.g., in studying vegetative patients), fMRI measures may be the only option. (Owen et al, 2006).
These findings may also lend a new interpretation to a recent study on synesthesia (Mattingley, and Rich, et al, 2001). In that study, a subject with synesthesia showed diminished performance in identifying a digit when the digit was presented against a background that matched her synesthetic color association. The authors of that study suggested that her ‘projection’ of the synesthetic color caused the digit to ‘blend’ into the background, making it more difficult to discern. However, an alternative hypothesis suggested by our finding is that high visualization capacity of the subject may have caused interference between the synesthetic digit and the background color.
Supplementary Material
Acknowledgments
We thank Chess Stetson for helpful feedback throughout. This work was supported by the Department of Neurobiology and Anatomy at University of Texas, Houston (DME) and NIH grant 5 T32 NS07467 (PRM).
Footnotes
Publisher's Disclaimer: This is a PDF file of an unedited manuscript that has been accepted for publication. As a service to our customers we are providing this early version of the manuscript. The manuscript will undergo copyediting, typesetting, and review of the resulting proof before it is published in its final citable form. Please note that during the production process errors may be discovered which could affect the content, and all legal disclaimers that apply to the journal pertain.
References
- Amedi A, Malach R, Pascual-Leone A. Negative BOLD differentiates visual imagery and perception. Neuron. 2005;5:859–872. doi: 10.1016/j.neuron.2005.10.032. [DOI] [PubMed] [Google Scholar]
- Bouvier SE, Engel SA. Behavioral deficits and cortical damage loci in cerebral achromatopsia. Cereb Cortex. 2006;2:183–191. doi: 10.1093/cercor/bhi096. [DOI] [PubMed] [Google Scholar]
- Ceci SJ, Bruck M. Jeopardy in the Courtroom: A Scientific Analysis of Children’s Testimony. American Psychological Association; 1995. [Google Scholar]
- De Vreese LP. Two systems for colour-naming defects: verbal disconnection vs colour imagery disorder. Neuropsychologia. 1991;1:1–18. doi: 10.1016/0028-3932(91)90090-u. [DOI] [PubMed] [Google Scholar]
- Dobson M, Markham R. Imagery ability and source monitoring: implications for eyewitness memory. Br J Psychol. 1993;(Pt 1):111–118. doi: 10.1111/j.2044-8295.1993.tb02466.x. [DOI] [PubMed] [Google Scholar]
- Douglas RN. Considering the Witness in Interviews. Psycoloquy . 1996:21. [Google Scholar]
- Farah MJ. Is visual imagery really visual? Overlooked evidence from neuropsychology. Psychol Rev. 1988;3:307–317. doi: 10.1037/0033-295x.95.3.307. [DOI] [PubMed] [Google Scholar]
- Ganis G, Thompson WL, Kosslyn SM. Brain areas underlying visual mental imagery and visual perception: an fMRI study. Brain Res Cogn Brain Res. 2004;2:226–241. doi: 10.1016/j.cogbrainres.2004.02.012. [DOI] [PubMed] [Google Scholar]
- Geiselman RE, Fisher RP, MacKinnon DP, Holland HL. Enhancement of Eyewitness Memory with the Cognitive Interview. Am J Psychol. 1986;3:385–401. [Google Scholar]
- Hatakeyama T. Adults and children with high imagery show more pronounced perceptual priming effect. Percept Mot Skills. 1997;3(Pt 2):1315–1329. doi: 10.2466/pms.1997.84.3c.1315. [DOI] [PubMed] [Google Scholar]
- Ishai A, Sagi D. Common mechanisms of visual imagery and perception. Science. 1995;5218:1772–1774. doi: 10.1126/science.7792605. [DOI] [PubMed] [Google Scholar]
- Kao YC, Davis ES, Gabrieli JD. Neural correlates of actual and predicted memory formation. Nat Neurosci. 2005;12:1776–1783. doi: 10.1038/nn1595. [DOI] [PubMed] [Google Scholar]
- King-Casas B, Tomlin D, Anen C, Camerer CF, Quartz SR, Montague PR. Getting to know you: reputation and trust in a two-person economic exchange. Science. 2005;5718:78–83. doi: 10.1126/science.1108062. [DOI] [PubMed] [Google Scholar]
- Kosslyn SM, Alpert NM, Thompson WL, Maljkovic V, Weise SB, Chabris CF, HamTon SE, Rauch SL, Buonanno FS. Visual mental imagery activates topographically organized visual cortex: PET investigations. J Cogn Neurosci . 1993:263–287. doi: 10.1162/jocn.1993.5.3.263. [DOI] [PubMed] [Google Scholar]
- Kosslyn SM, Thompson WL, Alpert NM. Neural systems shared by visual imagery and visual perception: a positron emission tomography study. Neuroimage. 1997;4:320–334. doi: 10.1006/nimg.1997.0295. [DOI] [PubMed] [Google Scholar]
- Kosslyn SM, Thompson WL, Kim IJ, Alpert NM. Topographical representations of mental images in primary visual cortex. Nature. 1995;6556:496–498. doi: 10.1038/378496a0. [DOI] [PubMed] [Google Scholar]
- Kreiman G, Koch C, Fried I. Imagery neurons in the human brain. Nature. 2000;6810:357–361. doi: 10.1038/35042575. [DOI] [PubMed] [Google Scholar]
- Marks DF. Visual imagery differences in the recall of pictures. Br J Psychol. 1973;1:17–24. doi: 10.1111/j.2044-8295.1973.tb01322.x. [DOI] [PubMed] [Google Scholar]
- Mattingley JB, Rich AN, Yelland G, Bradshaw JL. Unconscious priming eliminates automatic binding of colour and alphanumeric form in synaesthesia. Nature. 2001;6828:580–582. doi: 10.1038/35069062. [DOI] [PubMed] [Google Scholar]
- McKelvie SJ. The Vividness of Visual Imagery Questionnaire as a predictor of facial recognition memory performance. Br J Psychol. 1994;(Pt 1):93–104. doi: 10.1111/j.2044-8295.1994.tb02510.x. [DOI] [PubMed] [Google Scholar]
- McKelvie SJ, Demers EG. Individual differences in reported visual imagery and memory performance. Br J Psychol. 1979;1:51–57. doi: 10.1111/j.2044-8295.1979.tb02142.x. [DOI] [PubMed] [Google Scholar]
- Mellet E, Tzourio N, Denis M, Mazoyer B. A Positron Emission Tomography Study of Visual and Mental Spatial Exploration. J Cogn Neurosci. 1995;4:433–445. doi: 10.1162/jocn.1995.7.4.433. [DOI] [PubMed] [Google Scholar]
- Owen AM, Coleman MR, Boly M, Davis MH, Laureys S, Pickard JD. Detecting awareness in the vegetative state. Science. 2006;313(5792):1402. doi: 10.1126/science.1130197. [DOI] [PubMed] [Google Scholar]
- Prelec D. A Bayesian truth serum for subjective data. Science. 2004;306(5695):462–6. doi: 10.1126/science.1102081. [DOI] [PubMed] [Google Scholar]
- Stroop JR. Studies of interference in serial verbal reactions. J Exp Psychol. 1935:643–662. [Google Scholar]
- Wilson SC, Barber TX. The creative imagination scale as a measure of hypnotic responsiveness: applications to experimental and clinical hypnosis. Am J Clin Hypn. 1978;4:235–249. doi: 10.1080/00029157.1978.10403940. [DOI] [PubMed] [Google Scholar]
- Zeki S, Watson JD, Lueck CJ, Friston KJ, Kennard C, Frackowiak RS. A direct demonstration of functional specialization in human visual cortex. J Neurosci. 1991;3:641–649. doi: 10.1523/JNEUROSCI.11-03-00641.1991. [DOI] [PMC free article] [PubMed] [Google Scholar]
Associated Data
This section collects any data citations, data availability statements, or supplementary materials included in this article.