Abstract
The evolution of the crystal–melt interface was investigated during directional solidification of a dilute binary alloy, starting at the marginal stability time ti at which the planar interface first becomes unstable. The time delay between ti and the crossover time t0 at which the interface modulation becomes observable was determined experimentally. The interface morphology was analyzed as the cellular pattern appeared, and it was followed through the coarsening phase to the final steady-state dendritic pattern. The relevance of the initial instability for steady-state pattern selection was verified experimentally, and some aspects of the coarsening dynamics were measured and compared with theoretical predictions of Warren and Langer [Warren, J. A. & Langer, J. S. (1990) Phys. Rev. A 42, 3518–3525; Warren, J. A. & Langer, J. S. (1993) Phys. Rev. E 47, 2702–2712].
In the previous paper (1), the Warren–Langer (WL) approach (2, 3) to the theory of solidification instabilities was reviewed and was used to analyze the evolution of the crystal–melt interface in the binary alloy succinonitrile/coumarin 152 (SCN/C152). The experiments were described and were analyzed from the initiation of growth up to the marginal stability time ti, at which the first linear growth coefficient aq(t) crosses over from negative to positive. In this paper, we analyze the development of the cellular pattern beyond ti, determine the time required for the initial instability to develop sufficiently to become visible, and follow the evolution of the interface position and dendrite spacing as the final steady-state morphology is approached.
Onset of the Instability and the Crossover Time
When the pulling speed V in a directional solidification experiment exceeds the critical value VC, the planar interface eventually destabilizes and evolves into a cellular or dendritic pattern. The WL analysis (3) shows that the onset of morphological instability occurs at the marginal stability time ti, while the concentration field is still building up. The WL analysis also determines a crossover time t0 when the modulation amplitude becomes comparable to the mean wavelength λ0, as described in the preceding paper (1) at the end of the Theory section.
To obtain predictions for t0 and λ0, the amplitude evolution is calculated for a large range of modes, starting from thermal noise, which is orders of magnitude smaller than an observable amplitude. When the pulling motor is started at t = 0 the interface initially remains planar until ti, when the linear growth coefficient aq(t) crosses over from negative to positive for some q. Subsequently the interface becomes morphologically unstable for a continuously expanding range of wavelengths. It takes longer, however, for the modulation to grow until it becomes observable (and nonlinear) at t = t0.
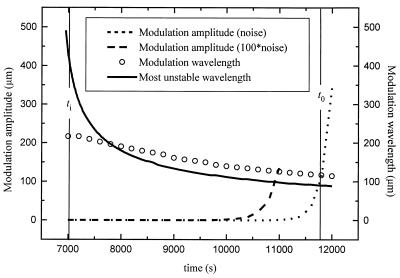
Fig. 1 shows WL theoretical results for the evolution of the modulation amplitude [assuming either thermal noise (dotted line) or a 100 times stronger noise term (broken line)], the predicted wavelength of the modulation (○), and 2π/qmax, the wavelength of the most unstable mode (solid line), all calculated between ti and t0. The crossover time t0 and wavelength λ0 are well defined because the modulation wavelength shifts only slowly while the modulation amplitude grows faster than exponentially, making the two curves cross almost perpendicularly in Fig. 1. The crossing point determines t0 and λ0. A change in the noise level by a factor of 100 changes t0 and λ0 by only about 10%. The wavelength of the most unstable mode differs from the modulation wavelength, because the latter is influenced by the noise spectrum and by the previous evolution of the linear growth coefficients. The wavelength of the most unstable mode decreases rapidly immediately after ti, but decreases slowly near t0.
Figure 1.
WL theoretical results for the evolution of the modulation amplitude [assuming thermal noise (dotted line) or a 100 times stronger noise term (broken line)], the wavelength of this modulation (○), and 2π/qmax, the wavelength of the most unstable mode (solid line), all calculated between the marginal stability time ti and the crossover time t0.
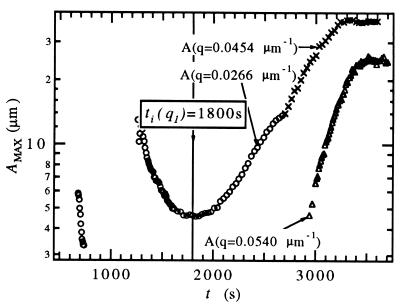
The transition from negative to positive linear growth coefficient (for a selected q value q1) at ti(q1) during the buildup of solute ahead of the planar interface, and the delay between the marginal stability time t, and a visible crossover from planar to cellular interface at t0, can be determined experimentally. Fig. 2 shows the amplitude of the largest Fourier component of the interface profile in experiments with the parameters C∞ = 0.22 wt%, G = 15.7 K/cm, and V = 1.04 μm/s. In experiment A (×, ○) the interface was first perturbed for 60 s at t = 600 s with q1 = 0.0226 μm−1, and the modulation of the planar interface was observed to decay exponentially, indicating a negative linear growth coefficient. At t = 1,200 s the interface was perturbed again for 60 s with the same q1 and the modulation initially decayed, but then started to grow. The time ti(q1) ≈ 1,800 s when the amplitude minimum occurs marks the transition from a negative to a positive linear growth coefficient for this q1, indicating that the interface has become morphologically unstable. (Note that ti, the time of marginal stability, corresponds to the smallest possible ti(q1) for any q1, so that ti ≤ 1,800 s.)
Figure 2.
Amplitude of the largest Fourier component of the interface modulation during the planar–cellular crossover of a planar interface, with perturbations applied at 600 s and 1,200 s (×, ○), and without perturbations (▵).
When the interface is not perturbed, as in experiment B (▵), no modulation of the planar interface is observed at t = 1,800 s, although the interface is already unstable. Interface modulation starts to become visible only at t ≈ 3,000 s, when the mode with q = 0.0540 μm−1 becomes the biggest mode in the Fourier spectrum of the interface profile and starts to grow exponentially. In experiment A, a halving of the wavelength of the largest Fourier component was observed to occur spontaneously at t ≈ 2,700 s, making the wavelengths of the largest Fourier components for t > 3,000 s comparable in both the perturbed and unperturbed experiments. These experiments illustrate that although the planar interface becomes morphologically unstable for t ≈ ti ≤ 1,800 s, this marginal stability occurs well before any instability can be observed in an unperturbed experiment.
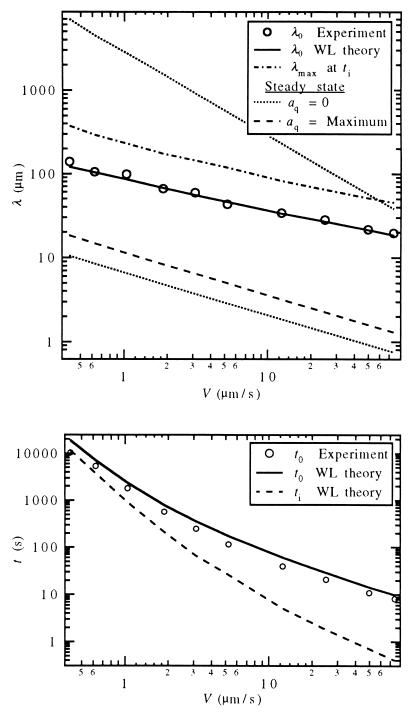
We have systematically measured the crossover time t0,exp and wavelength λ0,exp for pulling speeds ranging over two orders of magnitude in an SCN/C152 sample with C∞ = 0.43 wt% and G = 20.2 K/cm. Fig. 3 Upper shows the experimental λ0,exp (○), the WL calculation of λ0 (solid line), the most unstable mode λmax from a steady-state Mullins–Sekerka calculation (dot–dash line), and the two marginally stable modes under the Mullins–Sekerka steady-state assumptions (dotted line). The WL calculation agrees well with the observed crossover wavelength for all pulling speeds, as previously found by Warren and Langer (3). While λ0,exp lies within the range of unstable modes predicted by the Mullins–Sekerka analysis, λmax, the wavelength of the most unstable mode at steady state (indicated by the dashed line), is smaller than the observed wavelength for all pulling speeds studied by a factor of ≈5 (4). In addition, Fig. 3 Upper shows the mode that becomes marginally unstable first at ti in the WL theory (dot–dash line). The wavelength of this mode also differs from the experimental values by a factor of 2–3, indicating that the wavelength of the most unstable mode decreases during the delay from ti to t0 until the modulation becomes visible (see Fig. 1).
Figure 3.
Comparison of the WL theory and experiment for the initial instability. Crossover wavelength λ0 (Upper) and crossover time t0 (Lower)as a function of pulling speed V for SCN/C152 (G = 20.2 K/cm, C∞ = 0.430 wt%).
The experimental crossover time t0,exp, measured over nearly three orders of magnitude in V, is shown in Fig. 3 Lower. It agrees reasonably well with the WL calculation (solid line) but is systematically slightly shorter. This difference could be due to the fact that the initial noise level is larger than the thermal noise Warren and Langer assumed in their calculation, because an increased initial level of noise-induced modulations would decrease t0 (see Fig. 1). One possible source for an increased initial noise level at the interface is the contact line between the SCN crystal and the glass capillary, which can lead to a localized mechanical perturbation of the planar interface. Nevertheless, the WL theoretical marginal stability time ti (dashed line) is considerably shorter than both the experimental and the theoretical t0, except at the lowest velocity.
These experiments show that the WL linear stability analysis is a useful method for calculating the crossover wavelength λ0,exp, and that λ0,exp is not very sensitive to the amplitude and power distribution of the initial noise at the start of the experiment. The most unstable mode predicted by the steady-state theory deviates significantly from the experimental data, indicating that the introduction of time dependence into the Mullins–Sekerka linear stability analysis by WL is clearly necessary. The other WL refinement of the Mullins–Sekerka analysis—the introduction of an initiation mechanism for the modulation together with the calculation of modulation amplitudes beyond ti—is also necessary for the determination of λ0, because the wavelength of the most unstable mode, at both ti and t0 (not shown), deviates from the experimental results as well. The marginal stability time ti when one mode first becomes unstable provides a lower bound for the experimentally observed planar–cellular crossover time t0,exp, and the WL calculation of t0 provides a good upper bound for the observed t0,exp because it assumes the smallest possible level of spontaneous perturbation (thermal noise).
Coarsening and the Approach to Steady State
The last stage of the development of a cellular or dendritic array is the coarsening of the initial shallow cellular structure with average wavelength λ0,exp into a final steady-state pattern. This stage, while crucial for the determination of the microstructure of the fully solidified alloy, is highly nonlinear and not well understood. The initial cellular structure starts with an amplitude comparable to λ0,exp at the crossover time t0 but quickly coarsens as cells overgrow their neighbors; eventually, sidebranches start to appear behind the tips of the fastest growing cells that prevent other cells from growing further (see figure 2A of ref. 1). Even though in the process the interdendritic spacing changes by approximately an order of magnitude, a reproducible selection of the final steady-state dendritic spacing is observed in experiments where the pulling motor is started abruptly and kept at a constant pulling speed V. Recent experiments, however, showed that the steady-state growth conditions alone are not responsible for this selection (5). A range of spacings was observed to be stable under the same steady-state growth conditions, and the reproducible selection of one spacing out of this range of stable spacings was found to depend on the experimental history (i.e., the sequence of pulling speeds preceding the final V). In experiments where the pulling speed is constant, selection therefore has to occur during the planar–dendritic coarsening.
A linear stability analysis for dendritic arrays by WL showed that a uniform array at a given V is stable for a range of interdendritic spacings, and that outside of that range the array is most unstable against a doubling of the spacing (2, 3). [This predicted spatial period doubling instability has been observed experimentally (6).] For an unstable array, Warren and Langer then estimated a rate of doubling of the spacing. To model the coarsening process, the position and wavelength of the modulated interface at the calculated crossover time are taken as the initial position and spacing of a “dendritic” array, which then evolves according to the calculated doubling rate until a steady state is reached. Although this is a highly simplified model of the coarsening process, it is nevertheless capable of predicting the principal characteristics of the final steady-state array.
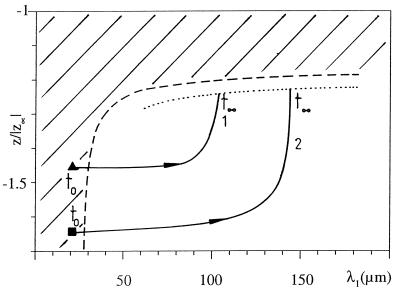
In Fig. 4 (adapted from ref. 3) the z position of the plane of the dendrite tips (z/z∞) is plotted schematically against the spacing between dendrites (λ1). The solid line 1 denotes the calculated evolution of a dendritic array starting from the crossover wavelength λ0 and position z0 at the crossover time t0 (denoted by the triangle). The WL dendritic stability analysis predicts that coarsening of the array spacing occurs faster than the approach to a steady state z position, which occurs after the spacing has stabilized, as indicated by the sharp upward turn of the theoretical curve near the end of its trajectory. The steady-state position is at larger z (and therefore higher T) than the position during the crossover, indicating an increase in the crystallization temperature of the dendrite tips during the coarsening.
Figure 4.
(Schematic) WL calculation of the dynamics of the tip position as a function of interdendritic spacing. Solid line 1 indicates the trajectory of the planar–dendritic transient. The dashed line denotes the limit of applicability of the theory. The dotted line marks possible-steady state solutions for the dendritic array. Solid line 2 shows another possible trajectory for different z0 and λ0 (adapted from ref. 3).
We have carried out preliminary experiments to measure the evolution of the dendrite tip positions and the spacing between dendrites during the coarsening. Because the temperature gradient in the experimental setup does not shift when the motor is started, we are able to measure the evolution of dendrite tip positions accurately. The spacing between dendrites, however, is not well defined because in the experiments the tips do not lie in one plane during the coarsening.
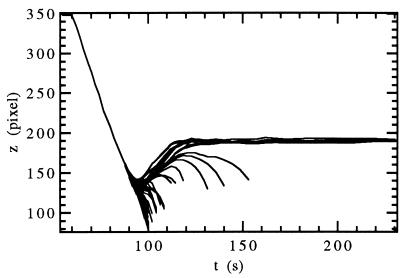
Qualitative comparisons to the WL predictions are still possible, using the experimentally observed evolution of the individual tip positions as shown in Fig. 5. (After the crossover time the lines separate to indicate the different positions of each dendrite tip.) Initially, the interface movement follows the WL calculation for a planar interface. The tip positions continue to move back when the instability becomes observable, reach a minimum position, and then move forward toward their final steady-state position for a dendritic array without overshooting, as predicted from the WL analysis. Dendrites that advance slowly are overgrown during the coarsening (indicated by lines that terminate) and never reach the steady-state position. Most of this coarsening takes place before any of the dendrite tips start to advance toward larger z, in agreement with the WL predictions, although some coarsening still takes place after all eventually surviving dendrites have reached their steady state z position at t ≈ 120 s. All of the overgrown dendrites have already fallen behind at this time, and eventually stop growing and move back toward smaller z at the pulling speed.
Figure 5.
Position of the planar interface and positions of all dendrite tips during the cellular–dendritic coarsening. (SCN/C152 at V = 24.91 μm/s, G = 11.7 K/cm, C∞ = 0.43 wt%).
One underlying assumption of the WL theory is that the coarsening dynamics are sensitive to the crossover wavelength and z position. This dependence was studied in a series of experiments where the initial pulling speed was set to different values. Before an instability occurred the pulling speed was switched to the same final value in all experiments and the subsequent initial instabilities and coarsening dynamics to a dendritic array were measured. Different crossover wavelengths and z positions at the same final motor speed were observed, and the coarsening was found to result in different final dendritic spacings. A smaller z position at the crossover time leads to a larger steady-state dendritic spacing, as shown schematically by line 2 in Fig. 4. While different interdendritic spacings can thus be reached during the coarsening under the same steady-state conditions, the dendrite tip radius remains unchanged, dependent only on the steady-state conditions. By selecting a sequence of pulling speeds to exploit the dynamics of the coarsening process, it is therefore possible to select (to a certain degree) these important characteristic length scales of the steady-state dendritic array independently.
Conclusions
We have investigated the evolution of a dendritic pattern in directional solidification experiments with the alloy SCN/C152, starting from a planar solid–liquid interface. Our experiments show that changes in the crossover wavelength λ0 can affect the steady-state interdendritic spacing even though the wavelength of the pattern changes by approximately one order of magnitude during the coarsening. The focus of our experiments therefore was a detailed understanding of the initial instability from the initial recoil of the planar front after crystal growth is started until an instability becomes observable.
Initially the planar interface remains morphologically stable until the marginal stability time ti is reached. Planar interface stability was tested directly through applied spatially periodic UV perturbations that induce sinusoidal modulations of the interface profile. The growth or decay of the modulation amplitude (after the perturbation is switched off) allows for a measurement of positive or negative linear growth coefficients for a large range of wave vectors. This quantitative determination of interface stability shows that the interface becomes continually less stable after crystal growth is started, as the solute concentration builds up ahead of the advancing interface. The measured linear growth coefficients are in good agreement with the WL time-dependent linear stability analysis. At ti a transition from a negative to a positive linear growth coefficient is observed as perturbation-induced modulations start to grow. In unperturbed experiments, however, no instability is observable at ti, because the instability takes time to evolve far enough to become observable, starting from an unobservably small amplitude of noise-induced modulations.
The evolution of the solute concentration field during the initial planar phase was also measured. The solute profile in the liquid ahead of the interface can be described well by an exponential with a time-dependent characteristic length in reasonable quantitative agreement with the WL calculations.
The measured wavelength at crossover (when instabilities become observable in an unperturbed experiment) is in good agreement with the WL time-dependent linear stability analysis, and the crossover time shows fair agreement with the WL analysis. This indicates that the time dependence of the solute field and a reasonable estimate for the initial noise level must be included in the Mullins–Sekerka linear stability analysis to yield agreement with experimental data, whereas nonlinear terms are not necessary in the stability analysis.
Acknowledgments
We thank J. S. Langer, J. A. Warren, C. Caroli, R. F. Sekerka, W. J. Rappel, S. R. Coriell, and R. Schaefer for helpful discussions and correspondence. This research was supported by the U.S. Department of Energy under Grant DE-FG02–84-ER45132.
ABBREVIATIONS
- WL
Warren–Langer
- SCN
succinonitrile
- C152
coumarin 152
References
- 1.Losert W, Shi B Q, Cummins H Z. Proc Natl Acad Sci USA. 1998;95:431–438. doi: 10.1073/pnas.95.2.431. [DOI] [PMC free article] [PubMed] [Google Scholar]
- 2.Warren J A, Langer J S. Phys Rev A. 1990;42:3518–3525. doi: 10.1103/physreva.42.3518. [DOI] [PubMed] [Google Scholar]
- 3.Warren J A, Langer J S. Phys Rev E. 1993;47:2702–2712. doi: 10.1103/physreve.47.2702. [DOI] [PubMed] [Google Scholar]
- 4.Trivedi R, Somboonsuk K. Acta Metall. 1985;33:1061–1068. [Google Scholar]
- 5.Ding G, Huang W, Lin X, Zhou Y. J Cryst Growth. 1997;177:281–288. [Google Scholar]
- 6.Losert W, Shi B Q, Cummins H Z, Warren J A. Phys Rev Lett. 1996;77:889–891. doi: 10.1103/PhysRevLett.77.889. [DOI] [PubMed] [Google Scholar]


