Abstract
A new method, the time of flight–electron-stimulated desorption ion angular distribution method (TOF-ESDIAD), is described. The method permits the mapping of the lateral momentum distribution of adsorbed species on their adsorption sites. Examples of the study of the rotation of chemisorbed PF3 molecules and the frustrated lateral translation of chemisorbed CO molecules, both on single-crystal metal surfaces, are given. The observed anisotropy of the frustrated translation of CO is postulated to occur as a result of the 2π* orbital alignment in chemisorbed CO along the close packed direction of the Cu(110) substrate.
The field of surface science has advanced immensely in the last 35 years, and this exciting period of development can be considered as the beginning of the modern era in this field (1). The modern era is characterized by studies of single-crystal surfaces, exposing adsorption sites of known structural geometry. The highly ordered surfaces are atomically clean and substantially free from surface defects. The current capability for surface investigations contrasts markedly with earlier work carried out on polycrystalline or amorphous surfaces exposing a mixture of different types of surface sites. Studies of the adsorption of atoms and molecules extend back to and beyond the historic studies of Langmuir, who first conceived that localized adsorption occurs on surfaces (2). Langmuir’s concept of localized chemical bonding on surface sites (chemisorption) firmly set one principal foundation stone necessary for the development of the modern era of surface science, which began about 40 years later.
The field of surface science embodies at least four distinct characteristics. (i) Measurements are made by using a wide range of physical techniques involving diffraction and/or emission from the surface of electrons, ions, atoms and molecules, and photons. These particles serve as probes in a wide variety of electronic and molecular surface spectroscopies and diffraction methods. (ii) Spatial resolution in the sub-Angstrom range and temporal resolution in the sub-picosecond range may now be achieved. (iii) Modern electronic theories of bonding and chemical reaction dynamics and kinetics are widely employed to model experimental results as well as to make predictions of surface phenomena. (iv) Technologies often drive the selection of systems for study because surface phenomena often control technological processes. Many examples of the technological importance of surface phenomena exist in the semiconductor device area, the field of heterogeneous catalysis, the field of corrosion control, and in areas of materials science, among others (3).
This article shows how a recently developed surface measurement method was used to probe the low-frequency motion of atoms and molecules on their adsorption sites. This new method complements a second established method, and both have been used to observe and measure the vibrational dynamics of a CO molecule chemisorbed on the Cu(110) surface, even in the zero-point energy limit. From measurements of this kind, one may now visualize the dynamical behavior of localized chemisorbed species as they receive small quantities of thermal energy from the solid to which they are bound. Because most surface chemistry is induced by the thermal excitation of adsorbed species, the ability to observe the onset of rotation and vibration of adsorbed species at low temperatures provides a deeper understanding of the potential energy surfaces that govern adsorbate chemical behavior. The shape of these potential energy surfaces is of central importance in governing surface diffusion and chemical reactions on the surface.
Experimental Method: Electron-Stimulated Desorption
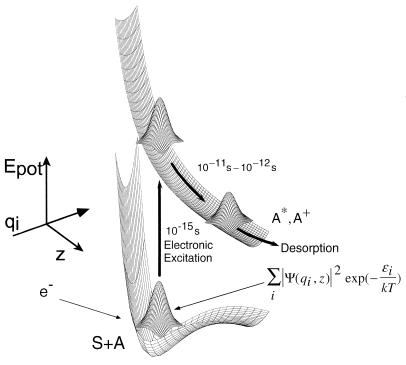
The phenomenon of electron-stimulated desorption (ESD) is employed for the study of the behavior of chemisorbed species on metal, semiconductor, and insulator crystals (4). As shown in Fig. 1, an adsorbed atom, A, localized on an atomic site, may be electronically excited to an upper state by electron impact, and in the example shown in Fig. 1, either an ionic species, A+, or an electronically excited species, A*, is ejected from the crystal surface along a repulsive potential energy surface. Because the adsorbed atom is in dynamic motion, swinging to-and-fro on its site, the probability density distribution before excitation extends laterally around the adsorption site. Rapid (10−15 s) electronic excitation of a single adsorbed atom caused by a single incident electron will sample only a small region of the initial state probability density distribution. Excitation of many identical species, A, on identical sites on a homogeneous single crystal surface, will sample the entire initial state probability density distribution. As a result, an energy distribution for A+ or A* will be observed originating from a variety of vertical electronic excitation steps to different locations on the repulsive upper-state potential energy surface. The yield of desorbing ions is strongly diminished by neutralization effects that occur by electron transfer near the solid surface as the ions gain velocity on their way from the surface. This picture of ESD, involving Franck–Condon excitations and subsequent ion neutralization, was postulated almost simultaneously in 1964 by Menzel and Gomer and by Redhead, and is designated the MGR mechanism (4).
Figure 1.
Schematic excitation process in electron stimulated desorption. Here, an adsorbed atom A is excited to a desorbing A+ or excited neutral, A*. The diagram captures the essence of the MGR mechanism and shows how the dynamical behavior of the adsorbate, A, may influence the A+ desorption process as various regions of the probability density distribution are sampled in fast Franck–Condon transitions to the upper state (4). As A+ or A* moves outward, electronic quenching effects reduce its surface concentration as schematically indicated by the drop in volume of the probability density distribution.
Ten years after the formulation of the MGR mechanism, we discovered that the positive ions ejected by ESD from adsorbed atoms and molecules on a single-crystal surface often escape in sharp beams that correlate in their symmetry of emission directions with the crystal lattice symmetry of the underlying adsorbent crystal (5, 6). We reasoned that these sharp beams were produced by the breaking of chemical bonds by the electronic excitation, and therefore that the ion emission directions could be used to infer the initial chemisorption bond direction that existed at the moment of excitation. The phenomenon producing the sharp ion desorption beams, and the apparatus used to measure these beams, is termed ESDIAD (electron-stimulated desorption ion angular distribution). It was realized rather soon after the discovery of ESDIAD that the emission directions of the ions were modified somewhat by interaction of the departing ions with the surface; approximate corrections for these “final state” effects can be made. In more recent work, in addition to positive ions, both electronically excited and highly vibrationally excited neutral desorbing species have been detected, as have negative ions. In addition, ultraviolet light and soft x-ray radiation have also been shown to be effective for inducing desorption, and the entire field is now termed DIET, which is an abbreviation for desorption induced by electronic transitions. More than 1,000 papers involving DIET have been published so far, and a large bibliography and review of selected DIET papers has been published recently (4).
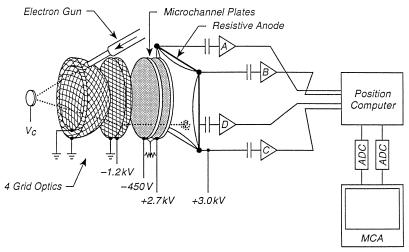
An apparatus that digitally sums up the ESDIAD events into a spatial distribution pattern is shown in Fig. 2. Here, a single crystal containing adsorbed species is bombarded by a focused beam of electrons from an electron gun. Individual desorption events are recorded by a microchannel plate (MCP) amplifier system in which a single desorbing particle, entering the front microchannel plate, generates an electron that is multiplied into about 106 electrons. These exit as a localized electron pulse from the back of the second plate and are then spatially detected by a resistive anode. This permits the determination of the trajectory of a single desorbing particle. About 106 to 107 desorption events are measured, and a statistical ESDIAD pattern, produced by summation of all of the individual desorption events, is obtained (7).
Figure 2.
Digital ESDIAD acquisition system. Here, adsorbed particles, charged or uncharged, are produced by an incident electron beam on the crystal at potential Vc and pass through hemispherical and planar grids to a pair of microchannel plates. A resulting burst of electrons originates from each single particle that arrives at the microchannel plate detector. The electron burst from the back of the second plate is detected and spatially located by a resistive anode system. About 106 to 107 desorption events are statistically summed in the final ESDIAD pattern (7).
A new version of the ESDIAD method has just been developed and involves the use of time of flight methods to measure the flight time of desorbing particles, making it possible to infer the initial lateral momentum distribution of the adsorbed molecule on its adsorption site (8). This TOF-ESDIAD method, involving a pulsed electron beam for excitation, permits the selection of narrow windows of flight time for the desorbing particles. The time-selective imaging of ESDIAD patterns for particles that escape in a narrow range of normal momenta can then be used to measure the lateral momentum distribution of the adsorbed atom or molecule in its initial probability density distribution (9). This permits one to map the statistical distribution of lateral momentum components possessed by the adsorbed molecule that exist at the instant of electronic excitation, as will be shown below. In other words, we have a method to observe and measure the molecular oscillations of chemisorbed species on their individual sites, opening up a new and very exciting capability to understand the dynamical behavior of adsorbed molecules.
ESDIAD Measurements of the Dynamical Behavior of an Adsorbate as Measured Before the Introduction of the New TOF-ESDIAD Method
PF3/Ni(111).
It was recognized early that molecular dynamical information was contained in the shape and in the temperature dependence of shape of the ESDIAD patterns, because the ESDIAD method samples the distribution of adsorbate coordinates that exist within the lower-state probability density distribution shown in Fig. 1. This is well illustrated by the use of ESDIAD to make the first observation of the thermal excitation of the rotation of a chemisorbed molecule, PF3 (10).
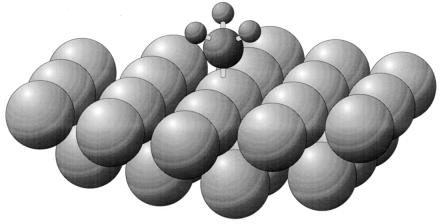
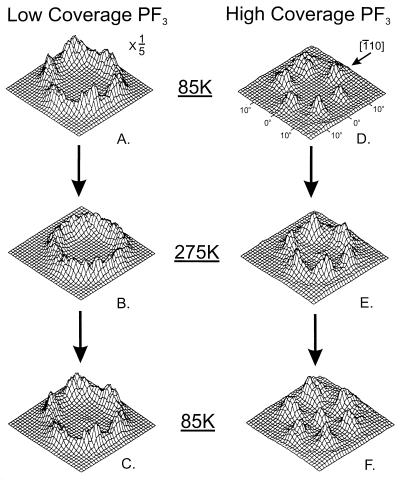
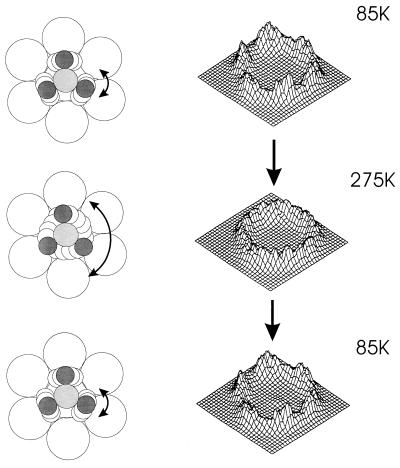
The PF3 molecule, chemisorbed on the Ni(111) surface, selects an atop bonding site by forming a Ni—P bond as shown in Fig. 3. The atop location of the Ni—P bond and its length have recently been measured by photoelectron diffraction spectroscopy, and the Ni—P bond length (2.07 Å) is closely similar to that found in the compound Ni(PF3)4 (2.10 Å) (11). The photoelectron diffraction method did not permit the determination of the location of the three F atoms of PF3. In contrast to the photoelectron diffraction method, ESDIAD is able to observe the orientation of the P—F bonds in the chemisorbed PF3 by measuring the direction of emission of F+ ions ejected (10), as shown in Fig. 4A. Here, at 85 K, and at a low coverage of PF3, six F+ beams are observed to be emitted in off-normal directions. These beams are directed in azimuths corresponding accurately to the six Ni nearest neighbor directions surrounding the atop adsorption sites containing the adsorbed PF3 molecules. These azimuthal crystal directions relative to the underlying Ni(111) crystal lattice have been determined in the ESDIAD apparatus by also using it to measure the low-energy electron diffraction (LEED) pattern from the Ni(111) substrate. Because chemisorbed PF3 possesses three outwardly directed P—F bonds, the six-beam F+- ESDIAD pattern must indicate that two symmetrically equivalent PF3 configurations are present together on the surface, and that at low temperatures the most probable directions for the P—F bonds are oriented within vertical planes that lie along the nearest neighbor Ni–Ni directions. In other words, with reference to the Ni crystal structure, two equivalent configurations of PF3 are energetically preferred at 85 K at low coverages. Here PF3–PF3 lateral interactions are not involved in orienting the molecules.
Figure 3.
Bonding configuration of PF3 chemisorbed on Ni(111) as determined from photoelectron diffraction. The F atoms have not been located in this analysis, and their azimuthal direction is schematic (11). [Reprinted from ref. 11, Copyright 1992, with kind permission of Elsevier Science-NL, Sara Burgerhartstraat 25, 1055 KV Amsterdam, The Netherlands.]
Figure 4.
Temperature and coverage dependence of the F+-ESDIAD pattern from PF3 chemisorbed on Ni(111). Temperature-dependent patterns are shown for low and high coverage cases. The hindered rotation found for PF3 at 275 K and at low coverages is not observed at high coverages because of PF3–PF3 interactions, which increase the barrier for rotation (10).
Fig. 4B shows the change in the ESDIAD pattern that occurs on warming the surface to 275 K. The six-beam F+-ESDIAD pattern converts to a ring-F+ pattern. Cooling back to 85 K (Fig. 4C) causes the ring pattern to freeze out into the original six-beam pattern. An analysis of the shape of the F+-ESDIAD pattern in the temperature range 95–360 K has been performed, and the energy barrier to the hindered rotation of the isolated PF3 molecule on Ni(111) has been measured to be 80 ± 20 cm−1 or 10 ± 3 meV; about 30 hindered rotational quantum states are confined by the energy barrier that controls the azimuthal motion of the molecule (10).
The measurements made in Fig. 4 A–C have been repeated at saturation coverage (0.25 ML) of PF3 and are shown in Fig. 4 D–F. Here, it is seen that the thermal excitation of PF3 rotation does not occur at 275 K, because the ring F+ pattern is not observed. The barrier to rotation of the molecule therefore has increased as a result of intermolecular PF3–PF3 interactions.
Fig. 5 schematically shows the behavior of chemisorbed PF3 on Ni(111) at low and high temperatures as the molecule absorbs thermal energy into its hindered rotational degree of freedom.
Figure 5.
Schematic dynamical behavior of isolated chemisorbed PF3 molecules on Ni(111) as rotational levels are populated.
The atop site bonding, the azimuthal orientation, and the presence of a barrier for molecular rotation have been studied theoretically, and results consistent with the experimental findings shown here have been found, except that the theoretical barrier height for rotation was estimated to be 400 cm−1 or 50 meV (12). In addition, the freezing of the rotational motion by PF3–PF3 intermolecular interactions has been theoretically justified through statistical studies (13).
ESDIAD Measurement of the Lateral Momentum Distribution of an Adsorbed Molecule by Using the New TOF-ESDIAD Method
CO/Cu(110).
The example of the use of ESDIAD to observe the rotation of the PF3 molecule was carried out in an apparatus that measured the angular distribution of ions by summing the desorbing F+ ESD directions throughout their full energy distribution. The analysis leading to the barrier height was based on the idea that the spatial orientation of the P—F bonds was being blurred by thermal motions that caused the molecule to first chatter within the potential energy well governing rotation, and then at higher rotational energies, to rotate throughout all azimuthal angles. Although this is approximately correct for the example of the rotating PF3 molecule, it neglects the role of the lateral momentum of the adsorbed molecule in determining the shape of the ESDIAD patterns. Therefore, we now illustrate the role of adsorbate momentum states by using a simpler molecule, chemisorbed CO.
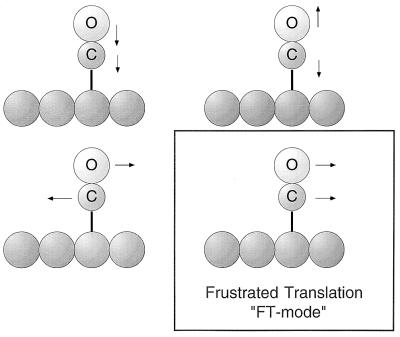
The chemisorbed CO molecule, when bound terminally to an atop metal atom site on a surface, will exhibit four vibrational modes as shown in Fig. 6. The first three modes involve mainly the stretching of the metal—C bond, the stretching of the C—O bond, and the frustrated rotational motion. These modes are all of high frequency and therefore are not significantly thermally excited at low temperatures. The frustrated translational, or “FT” mode, has the lowest frequency and is therefore the first mode to be vibrationally excited as the temperature is increased. This mode possesses lateral momentum in its zero-point motion and in its excited states.
Figure 6.
Fundamental vibrational modes of the terminally bonded CO molecule. The frustrated translational mode (FT) is the subject of the work described here.
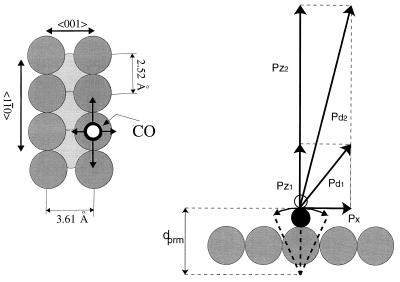
The role of lateral momentum in ESDIAD is illustrated by the diagram in Fig. 7. On the left is a schematic diagram of the location and average normal orientation of the chemisorbed CO molecule on an atop site on Cu(110) at low coverage. The molecule produces various ESD products (CO+, O+, and an excited neutral species, CO*) that are desorbed in characteristic energy distributions. We will focus on the desorbing neutral excited CO* species. This species is not influenced in its flight from the surface by the image forces that perturb ionic desorbing species. In Fig. 7 Right, the lateral momentum of the CO molecule in its lowest frequency-frustrated translational mode (before electronic excitation) is indicated by the vector, px. Two normal momentum vectors, pz1 and pz2, are shown, and these particular momentum vectors are experimentally selected in the new TOF-ESDIAD method from the normal energy distribution of the excited desorbing particles in the example. It may be seen that the resultant vectors, pd1 and pd2, are oriented at different angles to the normal as a result of the varying contribution of px to the resultant momentum vector for the trajectory of the desorbing CO* species. The CO* species with low normal momentum has its trajectory most influenced by the initial lateral momentum, px (8).
Figure 7.
The momentum vectors for CO in ESD. (Left) The drawing shows the location of the terminally bonded CO molecule on its atop Cu site on Cu(110). (Right) The drawing shows the resultant vectors, pd1 and pd2, for desorbing CO with two selected normal momenta, pz1 and pz2. It is assumed that the lateral momentum, px, is conserved upon excitation by electron impact (8, 9). The distance dprm is parametized in the analysis leading to Fig. 9. [Reprinted with permission from refs. 8 and 9 (Copyright 1987, American Institute of Physics.)]
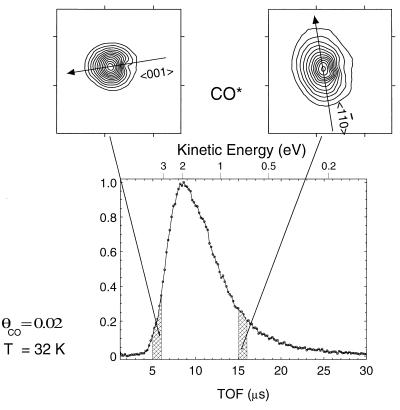
The TOF-ESDIAD method, employing a pulsed electron beam, separates desorbing species on the basis of their normal momenta and measures the ESDIAD patterns for species that desorb within a narrow window of normal momentum values that exists within a narrow window of flight times. Thus, the shape of the ESDIAD pattern will change as the TOF window is moved because of the varying contribution of the particle’s initial lateral momentum to the escaping particle’s trajectory, as seen schematically in Fig. 7. By analysis of the ESDIAD pattern shape as a function of the energy of the desorbing species, it is possible to measure the lateral momentum distribution of the particles in various selected azimuths and, hence, to plot out a map of the lateral momentum distribution or lateral vibrational energy distribution of the adsorbed species. Thus, one can separate bond directional effects observed in ESDIAD from lateral momentum effects by employing the TOF-ESDIAD method (8, 9).
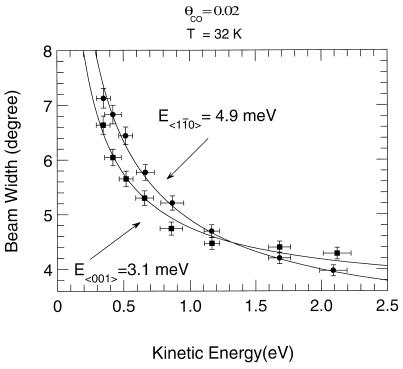
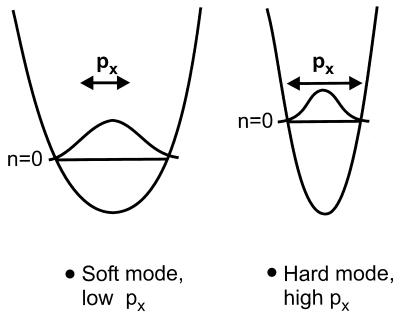
This is illustrated in Fig. 8, where ESDIAD patterns are plotted for CO* species as a function of the time of flight. For fast CO* species possessing short flight times, the ESDIAD pattern is slightly elongated in the 〈001〉 direction; as the flight time increases, the elongation shifts to the orthogonal 〈11̄0〉 direction, yielding a highly elliptical pattern of desorbing CO* species. This means that the frustrated translational mode of the CO molecule on its atop adsorption site exhibits a larger lateral momentum in the 〈11̄0〉 direction than in the 〈001〉 direction. A full analysis, yielding the characteristic frustrated translational energies in the two azimuthal crystal directions, is shown in Fig. 9. Frustrated translational energies of 4.9 meV (〈11̄0〉) and 3.1 meV (〈001〉) are obtained from the fits of the beam width in the two directions to the physical model in which angular effects resulting from lateral momentum and bond orientation are separated within the CO* energy distribution over the range 0.2 eV to 2.1 eV (9). In Fig. 8, it can be seen that at low translational energy, a slight ellipticity in the 〈001〉 direction is observed. This indicates that the spatial delocalization of the adsorbed CO is larger in the 〈001〉 direction. At relatively high normal energies of CO*, the measurements show that the lateral momentum of the CO is smaller in the 〈001〉 direction than in the 〈11̄0〉 direction. This behavior is expected because low-energy “soft” vibrational modes will possess higher amplitudes than higher-energy “hard” vibrational modes, as shown schematically in Fig. 10.
Figure 8.
TOF-ESDIAD patterns for CO* for two flight-time windows (8). The strong ellipticity of the 15- to 16-μs particles indicates that more lateral momentum is present for the (110) FT mode than for the (001) FT mode. [Reprinted with permission from ref. 8 (Copyright 1987, American Institute of Physics.)]
Figure 9.
Fit of the CO* beam width versus translational energy measurements to characteristic FT vibrational energies. The diagram schematically illustrates the FT momenta for CO in the two crystallographic azimuths (9). [Reprinted with permission from ref. 9 (Copyright 1987, American Institute of Physics.)]
Figure 10.
Schematic illustration of a soft and hard FT mode. The soft mode exhibits a high amplitude and a low zero-point energy compared with the hard mode.
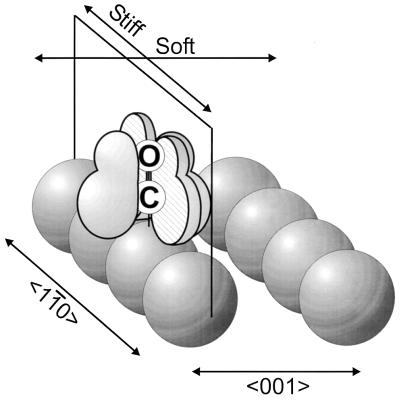
The origin of the anisotropy in the frustrated translational motion of atop CO on Cu(110) is not yet understood theoretically. The chemisorbed CO molecule is bonded to the Cu surface by donation from the 5σ orbital, located near the C atom, and also with the involvement of the 2π* orbitals, which lie alongside the C—O bond. We postulate that these 2π* orbitals align with the 〈11̄0〉 and 〈001〉 directions when adsorbed on the atop site (8, 9). Back donation of electrons from the metal surface to these orbitals might favor the donation of larger electron density into the 2π* orbitals aligned in the 〈11̄0〉 direction because of the proximity of the orbitals and Cu atoms. The larger electron density in the vertical plane parallel to the 〈11̄0〉 direction then could be responsible for the higher force constant for the FT mode in this direction, following earlier ideas (14). Alternatively, the aligned 2π* orbitals may participate differently in the repulsion of CO* species, leading to anisotropic ejection. The alignment of the 2π* orbitals is shown schematically in Fig. 11.
Figure 11.
Schematic picture of proposed 2π* orbital alignment for CO on Cu(110) (8, 9). [Reprinted with permission from refs. 8 and 9 (Copyright 1987, American Institute of Physics.)]
Experimental Confirmation of Anisotropy of the Frustrated Translational Motion of CO Chemisorbed on Cu(110)
Another method, helium atom scattering (HAS), has been employed over the last few years for the measurement of low frequency modes for chemisorbed molecules. To check the TOF-ESDIAD momentum-resolved measurements reported above, we collaboratively studied the CO/Cu(110) system by using the HAS method in Germany (J. Braun, J. Weckesser, J.A., D.M., J.T.Y., and C. H. Wöll, unpublished results). Precautions were carefully taken to ensure that the surface conditions in the HAS studies were very similar to the conditions of the TOF-ESDIAD measurements.
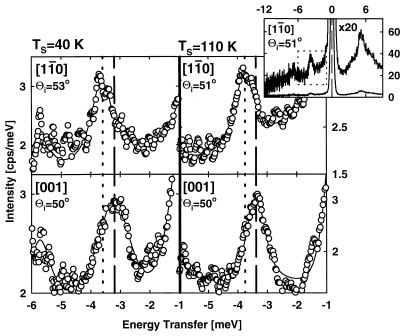
Fig. 12 shows HAS loss spectra for 0.07 ml of CO on Cu(110) at 40 K and 110 K surface temperature. In these measurements, HAS was studied along the two crystal azimuth directions, 〈11̄0〉 and 〈001〉. It may be seen from Fig. 12 that the anisotropy detected by TOF-ESDIAD is also visible in the HAS measurements. The frequency of the FT modes may be directly determined from the characteristic HAS loss energies, and the loss spectra in Fig. 12 are the first HAS measurements of anisotropic behavior of a chemisorbed species. Here, FT energies of 3.75 meV (〈11̄0〉) and 3.4 meV (〈001〉) have been measured.
Figure 12.
Helium atom scattering measurements in two azimuths for CO/Cu(110). The measurements are made for He energy losses shown in the energy range inside the dotted lines (Inset) (J. Braun, J. Weckesser, J.A., D.M., J.T.Y, and C. H. Wöll, unpublished results).
Table I summarizes the quantitative comparison of the two methods for measuring the anisotropic behavior of the CO/Cu(110) system. The comparison shows that the TOF-ESDIAD method yields a higher lateral translational energy in the 〈11̄0〉 direction than the HAS method, and the difference in the anisotropy ratio for the two measurements is just outside the error bar range for each. This results in a larger anisotropy ratio for this particular system by TOF-ESDIAD than by HAS. The reason for this variation currently is unknown.
Thermal Excitation of Low Frequency Modes as Studied by TOF-ESDIAD
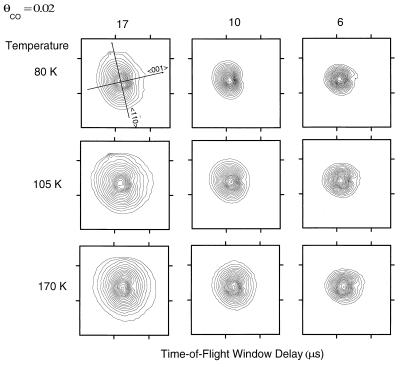
The TOF-ESDIAD measurements for CO/Cu(110), obtained at 32 K, sample primarily the zero-point energy of the FT modes. Thus, for the two orthogonal mode energies measured by TOF-ESDIAD at 32 K, only 16% and 31% of the oscillators are in the first excited FT vibrational state. Slight heating of the surface above 32 K will begin to populate the higher FT modes for the system, and experimental measurements of this effect over the temperature range 80–170 K are shown in Fig. 13. Two observations may be made from an examination of Fig. 13. The first is that heating the surface produces broadening of the CO* ESDIAD patterns in all directions; this broadening is more apparent for the CO* species with the longer flight times. This is an expected effect, because the longer flight times permit the CO* species to move laterally to a greater degree before they reach the detector. The second observation is that the anisotropy in momentum seems to disappear as the temperature is raised, whereas the spatial anisotropy tends to become more pronounced. Thus, for long flight times (17 and 10 μs) the pattern elongation in the 〈11̄0〉 direction almost disappears on warming. For the 6-μs flight time window, an elliptical pattern develops above 80 K with the elongation in the 〈001〉 direction.
Figure 13.
CO* TOF-ESDIAD patterns measured in different flight-time windows and at different surface temperatures. θCO = 0.02.
Because the short flight-time ESDIAD patterns are sensitive primarily to Cu—CO bond directionality rather than to initial-state lateral momentum, the 6-μs behavior reveals that the CO molecule moves within its FT motion in space through a larger amplitude in the 〈001〉 direction compared with the 〈11̄0〉 direction as the temperature is increased. This behavior is in complete accord with the observation in momentum space that the 〈001〉 FT mode is the soft mode compared with the harder orthogonal FT mode that exists along the close-packed Cu–Cu direction.
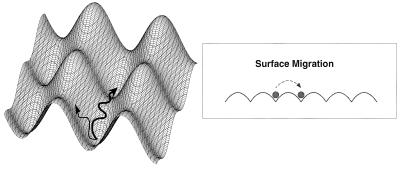
These results, taken together, provide a picture of the behavior of the onset of thermal excitation of the chemisorbed CO molecule. These observations of the anisotropy of the low-frequency FT modes are consistent with the recent observation that preferential surface migration directions exist for isolated CO molecules chemisorbed on Cu(110) (15) as schematically indicated in Fig. 14. Our speculations must await the connection of the anisotropic TOF-ESDIAD measurements to the recent experimental observation of anisotropic surface diffusion of CO on Cu(110).
Figure 14.
Schematic diagram of the motion of an adsorbed particle as it samples different directions on an anisotropic surface. Ultimately, the particle will diffuse with the highest probability to a neighboring empty site over the lowest potential energy barrier.
Table 1.
Comparison of anisotropy for orthogonal frustrated translational modes of CO chemisorbed on Cu(110)
| Method | E[FT-〈11̄0〉], meV | E[FT-〈001〉], meV | Anisotropy ratio |
|---|---|---|---|
| TOF-ESDIAD* | 4.9 ± 0.7 | 3.1 ± 0.5 | 1.58 ± 0.23 |
| HAS† | 3.75 ± 0.1 | 3.4 ± 0.1 | 1.11 ± 0.07 |
Ref. 9.
J. Braun, J. Weckesser, J.A., D.M., J.T.Y., and C. H. Wöll, unpublished results.
Acknowledgments
We thank the Air Force Office of Scientific Research (AFOSR) and Department of Energy Office of Basic Energy Sciences for support of this work. A special instrumentation grant from the DURIP Program of AFOSR is also acknowledged with thanks. We also thank Professor David Waldeck, University of Pittsburgh, Department of Chemistry, for constructive comments.
ABBREVIATIONS
- TOF-ESDIAD
time of flight–electron-stimulated desorption ion angular distribution
- HAS
helium atom scattering
- FT
frustrated translational
References
- 1.Duke C B, editor. Surface Science—The First Thirty Years. 299/300. Surface Science; 1994. [Google Scholar]
- 2.Suits C G, Way H E, editors. The Collected Works of Irving Langmuir. Oxford: Pergamon; 1960. [Google Scholar]
- 3.Yates, J. T., Jr., ed. (1996) Surface Chemistry: Advances and Technological Impact, Chem. Rev. 96. [DOI] [PubMed]
- 4.Ramsier R D, Yates J T., Jr Surf Sci Rep. 1991;12:243. [Google Scholar]
- 5.Czyzewski J J, Madey T E, Yates J T., Jr Phys Rev Lett. 1974;32:777. [Google Scholar]
- 6.Madey T E. Surf Sci. 1994;299/300:824. [Google Scholar]
- 7.Yates J T, Jr, Alvey M D, Kolasinski K W, Dresser M J. Nucl Inst Methods Phys Res. 1987;B27:147. [Google Scholar]
- 8.Ahner J, Mocuta D, Ramsier R D, Yates J T., Jr J Vac Sci Technol A. 1997;15:1548. [Google Scholar]
- 9.Ahner J, Mocuta D, Ramsier R D, Yates J T., Jr Phys Rev Lett. 1997;79:1889. [Google Scholar]
- 10.Alvey M D, Yates J T, Jr, Uram K J. J Chem Phys. 1987;87:7221. [Google Scholar]
- 11.Dippel R, Weiss K-U, Schindler K-M, Gardner P, Firtzsche V, Bradshaw A M, Asensio M C, Hu X M, Woodruff D P. Chem Phys Lett. 1992;199:625. [Google Scholar]
- 12.Chan A W E, Hoffmann R. J Chem Phys. 1990;92:699. [Google Scholar]
- 13.Zwanzig R. J Chem Phys. 1987;87:4870. [Google Scholar]
- 14.Richardson N V, Bradshaw A M. Surf Sci. 1979;88:255. [Google Scholar]
- 15.Briner B G, Doering M, Rust H-P, Bradshaw A M. Science. 1997;278:257. [Google Scholar]


