

Abstract
BACKGROUND
Aging is associated with a significant increase in atrial tachyarrhythmias, especially atrial fibrillation. A macroscopic repolarization gradient created artificially by a stimulus at one site prior to a premature stimulus from a second site is widely considered to be part of the experimental protocol necessary for the initiation of such arrhythmias in the laboratory. How such gradients occur naturally in aging atrial tissue has remained unknown.
OBJECTIVE
This study was to determine if the pattern of cellular connectivity in aging human atrial bundles produces a mechanism for variable early premature responses.
METHODS
Extracellular and intracellular potentials were recorded following control and premature stimuli at a single site in aging human atrial bundles. We also measured cellular geometry, the distribution of connexins, and the distribution of collagenous septa. A model of the atrial bundles was constructed based on the morphological results. Action potential propagation and the sodium current were analyzed following premature stimuli in the model.
RESULTS
Similar extracellular potential waveform responses occurred following early premature stimuli in the aging bundles and in the model. Variable premature conduction patterns were accounted for by the single model of aging atrial structure. A major feature of the model results was that the conduction events and the magnitude of the sodium current at multiple sites were very sensitive to small changes in the location and the timing of premature stimuli.
CONCLUSION
In aging human atrial bundles stimulated from only a single site, premature stimuli induce variable arrhythmogenic conduction responses. The generation of these responses is greatly enhanced by remodeling of cellular connectivity during aging. The results provide insight into sodium current-structural interactions as a general mechanism of arrhythmogenic atrial responses to premature stimuli.
Keywords: Aging atrium, Microfibrosis, Premature excitation, Decremental conduction, Arrhythmias, Cellular connectivity
Introduction
This paper focuses on the mechanisms of origin of conduction disturbances in human atrial bundles. Using the same site for regular and premature stimuli, we encountered the abrupt appearance of variable arrhythmogenic conduction responses in aging human bundles.1 When a single premature stimulus was critically timed near the refractory period, there was an abrupt change in propagation to one of two patterns: 1) a lateral shift of the leading edge of longitudinal propagation; and 2) reentry (two excitation deflections, separated by an interval of time, at a single site). These abrupt pattern changes were observed only in aging bundles that were structurally nonuniform; e.g., we did not observe these conduction abnormalities following premature stimuli in younger atrial bundles (1–20 years of age) that were structurally uniform.1
It is widely known that early premature stimuli initiate reentrant conduction disturbances in the presence of macroscopic gradients of repolarization.2–7 In experimental analyses of these conduction disturbances, the repolarization gradients have been produced primarily by delivering a premature stimulus (S2) at a location distal to the regular stimulus (S1).2–4 Also, 1-D cable models of the associated sodium current events have used this two-stimulus arrangement to create repolarization gradients.8 Here, all stimuli were given at a single site, so there was no macroscopic repolarization gradient induced by pacing first at one location and then at a second.
In the absence of an available model to account for the variable premature conduction abnormalities that we encountered, here we extend our initial experimental observations in an effort to establish by what mechanism the abnormal responses are produced by premature stimuli in aging atrial bundles. We begin with the following hypothesis: Nonuniform cellular connectivity created by variations in cellular geometry and microfibrosis results in localized repolarization gradients of structural origin, so that early premature stimuli from a single site produce variable sodium current responses and arrhythmogenic conduction abnormalities.
Testing our hypothesis requires both a structural and an ionic cellular model. We therefore analyzed aging human atrial bundles histologically, which provided an experimental quantitative basis for constructing an electrical model of aging atrial microstructure. We then combined the structural model with the Nygren et al.9 ionic model of the human atrial cell and computed the responses produced by premature stimuli delivered at varying times and at varying sites in the model.
The results show that corresponding waveforms arise from the simulation and from the experimental measurement of extracellular potentials. Also, the origin of premature-induced small multiphasic extracellular waveforms observed experimentally was provided from the microstructural model. The results demonstrate that both premature conduction patterns are accounted for by a single model of aging microstructure of atrial bundles. A striking feature was that the arrhythmogenic conduction and sodium current events were created by small changes in the location and in the timing of premature stimuli.
Methods
Electrical Measurements
The distal right atrial appendage was removed routinely for the cannulation procedure during coronary artery surgery of 18 patients 60–72 years old and, for comparative purposes, 9 bundles from younger patients (1–20 years old) were examined, as reported previously.1 The study was approved by an institutional review committee, and patient permission for examination of the removed tissue was given as part of the surgical consent form. None of the patients had a history of atrial arrhythmias. Intracellular action potentials were recorded with conventional glass microelectrodes at 4 to 6 sites in eight bundles 60–75 years old.1 Control (S1) and premature (S2) cathodal extracellular stimuli, 1 ms in duration and 2–4 times threshold current, were delivered at the same site. While the premature interval was reduced in 2 ms steps, six unipolar extracellular waveforms were recorded at 6,600 Hz with 50 μm diameter tungsten electrodes at varying distances from the stimulus in single pectinate bundles. When an abnormal response occurred repeatedly for 15–30 minutes, Φe measurements were made at an additional 15–20 sites.1
Morphological Methods
Ten pectinate bundles were fixed by immersion in phosphate-buffered 4% paraformaldehyde and embedded in paraffin. Double labeling with anti-connexin43 (Cx43) antibodies (Chemicon) and wheat germ agglutinin10 was applied for study of the distribution of Cx43 and myocyte cross-sectional area. Frozen sections from 3 pectinates were used for double labeling with antibodies against connexin40 (Chemicon) and Cx43, as well as for double labeling with Cx43 and pan-cadherin antibodies (Sigma). NIH Image 1.6 software was used to measure the cross-section area of 300 myocytes from photomicrographs of transverse sections of each bundle. The method of Gerdes et al.11 was used to measure cell lengths from photomicrographs of 320 cardiomyocytes isolated from 4 formalin-fixed bundles (66–69 years of age). Estimates of the variable lengths of collagen septa were performed in two dimensions from photomicrographs of longitudinal sections stained by the picrosirius red technique.12
Model of Microstructure
The sarcolemmal membrane was considered to be located on two surfaces separated by intracellular space, as done in previous cellular models.13 Individual myocytes were divided into segments consisting of two surfaces with x-y dimensions of 10 μm × 12 μm and separated by 11 μm, which resulted in each segment having a volume of 1,320 μm3. The total membrane area of each segment was 407 μm2 to approximate the irregular surface of cardiac myocytes.13 This area produced a surface-to-volume ratio of 0.31 μm−1. The segments were connected with low resistances to produce a cytoplasmic resistivity of 150 Ω-cm. Sarcolemmal capacitance was 1.113 μF/cm2, as in the Nygren et al. atrial cell model.9 To approximate variations in cell size, there were 8 to 29 segments per cell. Adjacent cells were not connected except at gap junctions. A basic unit was formed by fitting 56 myocytes together, and multiple units formed arrays 16 mm long and 3.9 mm wide (28,336 myocytes). To approximate the distribution of Cx43 and Cx40 plaques found histologically, side gap junctions were distributed every 10–30 μm along the lateral cell borders. End gap junctions represented intercalated disks that connected myocytes longitudinally (Figure 1B). Collagenous septa were represented by an absence of side-to-side cellular connections (Figure 1B and Table 1B). To date, experimental methods have not been available to measure the conductance of gap junction plaques (Gj) in tissue preparations. Therefore, to assign Gj values for side and end gap junctions, we did the following. Once the model was complete, we assigned different Gj values until the control longitudinal (LP) and transverse (TP) propagation velocities and extracellular waveforms best approximated the experimental results. This maneuver yielded Gj values of 0.75 μS for end gap junction plaques and 0.30 μS for side gap junction plaques (Figures 1B and 1C). It should noted that these Gj values apply to an atrial age model in which we tried to be faithful to the lengths and lateral separations of the collagenous septa estimated morphologically. This combination of collagenous septa and Gj values also produced TP and LP velocities that were within the range of the experimental data (Table 1C). However, we did not test other models in which the associated length and lateral distance separating collagenous septa were varied.
Figure 1.
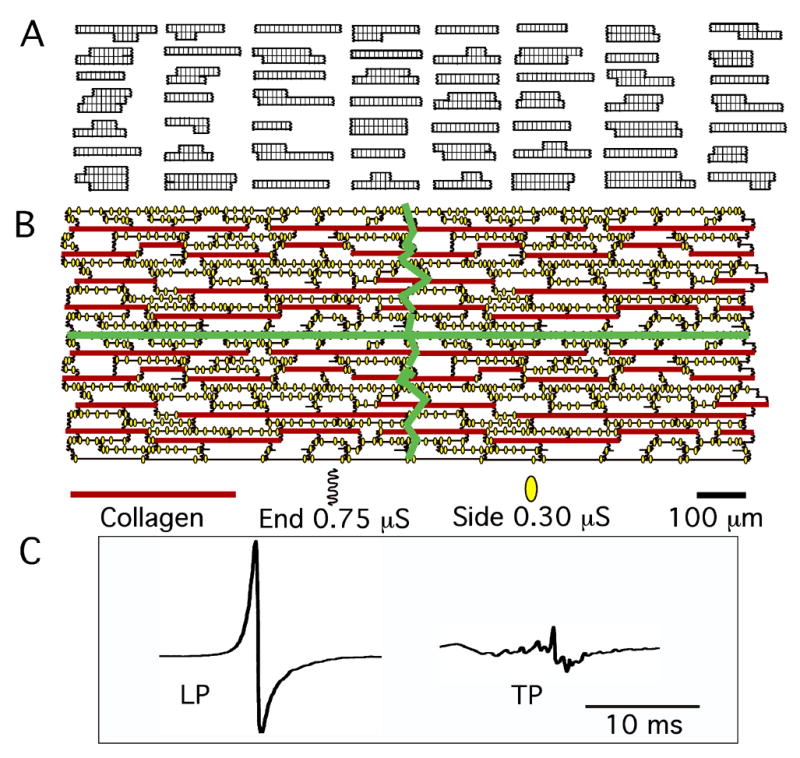
Atrial age microstructural model. A: 56 myocytes that formed a single unit of the model. B: Four units connected together. The green lines demarcate the four separate units. End and side gap junctions and their conductance values are shown, as well as the varying lengths of the collagen septa. C: Typical control longitudinal (LP) and transverse (TP) extracellular waveforms produced by model were quite similar to experimental Φe waveforms.
Table 1.
Experimental Morphologic and Atrial Age Model Parameters with Control Electrical Effects
| Experimental | Atrial Model | |
|---|---|---|
| A. Individual cells | ||
| Shape of myocytes | Variable: long and thin, short and wide, slightly irregular | Variable: long and thin, short and wide, slightly irregular |
| Average cross-section area | 212 μm2 | 198 μm2 |
| Average cell length | 137 μm (range: 90–215 μm) | 133 μm (range: 80–190 μm) |
| Average cell membrane area | No data | 7,326 μm2 |
| Average cell volume | No data | 23,814 μm3 |
| B. Collagenous septa (insulated boundaries) | ||
| Average length of septa | 315 μm (range: 90–830 μm) | 287 μm (range100–710 μm) |
| Average lateral distance between septa | 32 μm | 30 μm |
| C. Control anisotropic electrical effects | ||
| Average LP velocity* | 0.69 (range 0.55–0.78) m/s | 0.60 m/s |
| Average TP velocity | 0.082 (range 0.030–0.13) m/s | 0.076 m/s |
| Average LP/TP velocity ratio | 8.4 | 7.4 |
| LP extracellular potential waveforms | Large, biphasic, smooth | Large, biphasic, smooth |
| TP extracellular potential waveforms | Small, multiphasic | Small, multiphasic |
The average LP velocity of uniform anisotropic pectinates from patients 1–20 years old (n = 9) was 0.57 m/sec., and the average TP velocity was 0.12 m/sec.1
We used the Nygren et al.9 model of the human atrial cell for analysis of the sodium current. To approximate the range of dVm/dtmax values encountered experimentally, we used a maximum conductance constant for the sodium permeability (PNa) of 0.0028 nL/s. At eight stimulus locations in the 2-D cellular array, control (S1) and premature (S2) intracellular stimuli were delivered at the same site at 56 pA (6–8 times threshold) for 30 μs. The premature stimulus interval was shortened until no propagation occurred at sites located 8 mm longitudinally and 1 mm transversely from the stimulus. Then, multiple runs were performed until a 1-μs time difference of the premature stimulus produced propagation and no propagation at these locations. The time course of the following was recorded at 800 observation sites separated 100 μm longitudinally and 50 μm transversely: transmembrane potential, Vm; rate of change of Vm, dVm/dt; sodium current, INa; INa h inactivation gating factor consisting of the sum of the fast and slow components, h1 and h2;9 L-Type Ca2+ current, ICa,L; transient and sustained outward K+ currents, It and Isus; and the extracellular potential, Φe.12 Isochrone maps of excitation spread were drawn by hand from maps of the time of dVm/dtmax and/or the time of peak INa at the 800 observation sites. An adaptive time step (dt) was used to sample each segment of all cells at 1 μs whenever depolarization was present at any location in the matrix. When only repolarization was present, dt was gradually increased to 20 μs. One millisecond before the premature stimulus occurred, the time step was changed to 1 μs. Spatial discretization remained constant with dx = 10 μm and dy = 12 μm. For analysis of excitation sequences and for events within small regions, we analyzed the above noted variables at sites 50 μm apart in the age model.
Results
It is helpful to have in mind the results as whole, before each part of the picture is seen. The results will include the following: (1) the microstructure of the model used to explain the experimental observations; (2) the extension of the concept of decremental conduction to 2-D, and its close corollary, the resumption of degraded propagation, a phenomenon we call “conduction gating” because its occurrence is the “gate” by which the subsequent asymmetrical excitation sequence is initiated; (3) the fact that both experimental and modeling studies produced very similar extracellular waveforms at corresponding sites, which changed in very similar ways when stimuli were given with a critical degree of prematurity; (4) the explanation for the changes in the waveforms by means of a comprehensive model-generated map of the tissue region, showing the abrupt changes in pattern of propagation that occur when the second stimulus is given during the critical interval of prematurity, due to conduction gating; and, (5) the mechanism, in terms of underlying sodium current, by which the same region of tissue can be twice excited in an interval of 40–60 ms.
Experimental Propagation Results
All bundles had control resting potentials more negative than −73 mV, and the least negative takeoff potential of the earliest propagated responses was −63 mV. When the premature interval was progressively shortened, the control sequence of events persisted, but with slower conduction. When the refractory period was approached, further small decreases in the premature interval produced abrupt changes in the propagation response. One response consisted of the normal (control) large biphasic Φe deflection of longitudinal propagation changing to a complex waveform with multiple small deflections at locations 1–2 mm from the stimulus. Figure 2A, position 1 shows the large biphasic Φe deflection in the column on the left and the multiple small deflections in the column on the right. Concomitantly, lateral to the stimulus site, the normally small multiphasic Φe waveforms typical of transverse propagation in nonuniform anisotropic tissue changed to larger smooth biphasic waveforms typical of longitudinal propagation in a retrograde direction (Figure 2A, positions 2 and 3).
Figure 2.
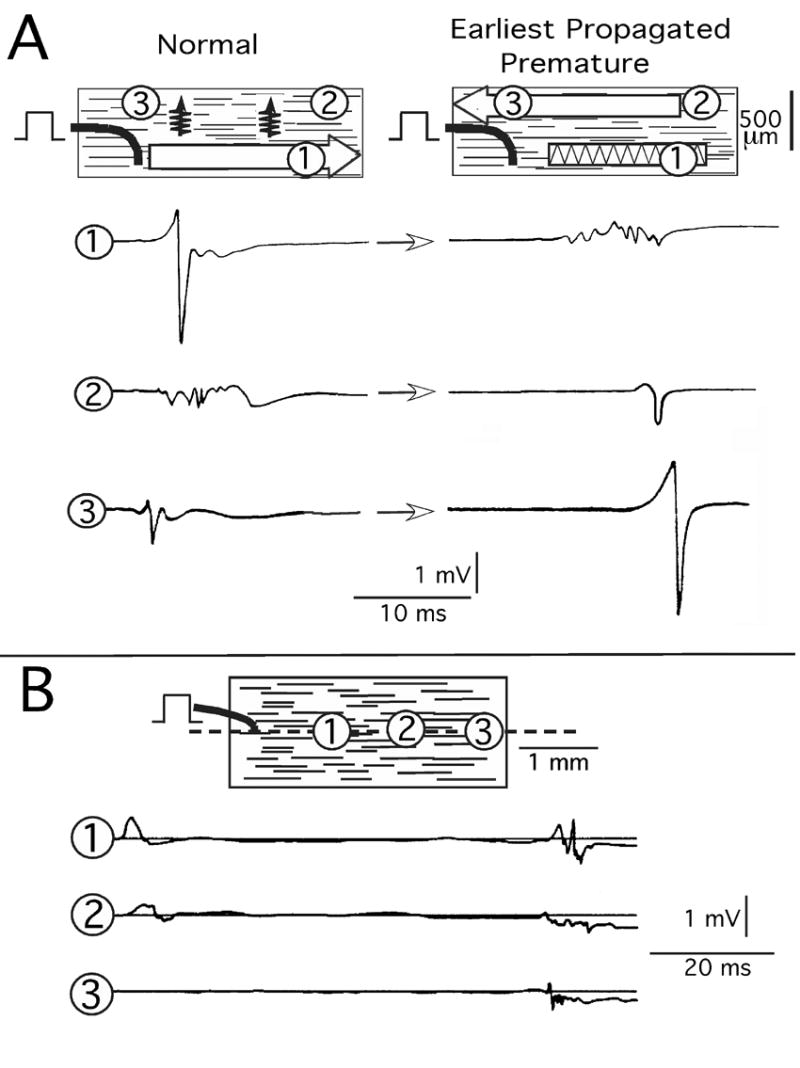
Experimental earliest premature propagation responses. A: Extracellular waveform (Φe) response with lateral shift of longitudinal propagation. B: Reentry response. Encircled numbers indicate sites of Φe waveform recordings. The premature interval in A was 215 ms, and in B it was 228 ms.
A second and different response was initiated by the biphasic Φe deflection of longitudinal propagation. However, this deflection decreased in amplitude and changed to a positive uniphasic deflection that disappeared 3 mm from the initiating site (Figure 2B). Conventional interpretation would be decremental longitudinal conduction to failure.1 However, after approximately 60 milliseconds, small multiphasic Φe deflections occurred in the same area with irregular propagation back toward the stimulus. The delayed waveforms indicated that some form of reentry had occurred within an area as small as 0.6 mm × 2.6 mm. Further shortening of the premature interval resulted in disappearance of the delayed deflections of reentry while the initial Φe decremental waveforms persisted. As previously reported for human and canine atria,1,14 intracellular action potentials measured at multiple sites in the region of the reentrant circuit of Figure 2B were 4–5 ms shorter at 50% repolarization in the area of decrement and reentry than in the area of the stimulus.1
Morphological Experimental Results as Basis for Model Parameters
Table 1 lists the values of the experimentally measured morphological parameters and the corollary values used in the model, as well as the control anisotropic electrical effects. Figure 3 illustrates typical morphological photomicrographs. The cross-sectional area of cells varied markedly, along with considerable variation of collagen in extracellular space (Panel A). Panel B illustrates the variation in shape and length of isolated myocytes. Connexin43 and connexin40 were distributed along the sides of most myocytes (Panel C), as were the cadherins (Panel D). This property of aging atrial bundles was similar to the elegant results of Kostin et al.,15 who found cellular lateralization of cadherins and connexins in atrial cells from patients with chronic atrial fibrillation. As emphasized by Saffitz and Kleber,16 this feature suggests a mechanical stabilizing factor for electrical coupling at lateral sites. Finally, collagenous septa separated groups of cells laterally by an average distance of 32 μm and longitudinally for distances from 90 μm to 830 μm. These lengths likely represent minimum values since our measurements of collagen septa were performed with individual longitudinal sections.
Figure 3.
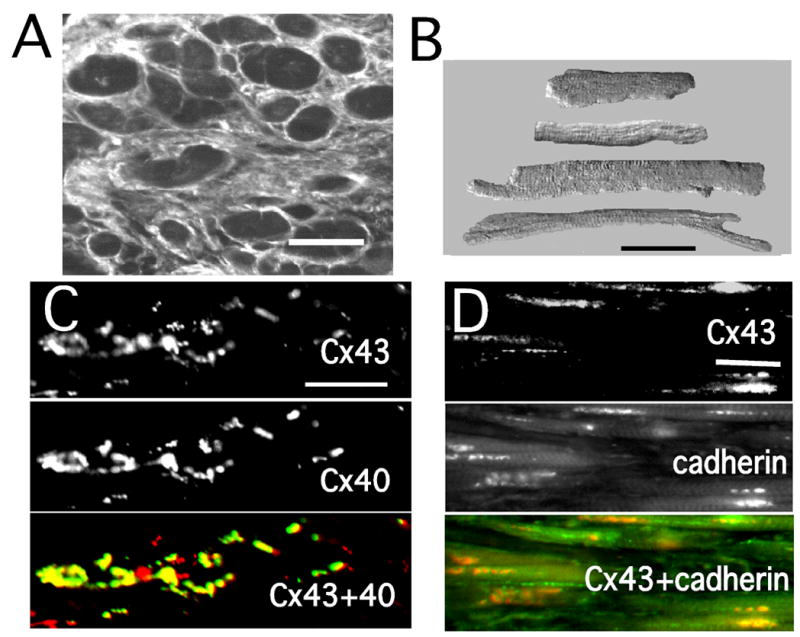
Representative experimental morphological results. A: Cross section of 72 year-old bundle. B: Isolated atrial myocytes of variable size and shape. C: Single and double labeling of connexin 43 (Cx43) and connexin40 (Cx40). D: Single and double labeling of Cx43 and cadherins (pan-cadherin antibody). All bars = 50 μm.
Figure 1 shows the model with the variable-sized myocytes that formed one unit of myocytes in Panel A. Panel B shows a composite of four units connected together, along with the distribution of end and side gap junctions and of collagenous septa. The model produced control LP and TP Φe waveforms quite similar to those recorded experimentally (Panel C), as well as similar control macroscopic anisotropic velocities (Table 1).
What Are the Earliest Premature Responses in a Uniform Anisotropic Sheet?
To compare to the atrial age model, we found it to be important to develop reference information about the earliest premature responses of the sodium current (INa) in an anisotropic structure without cellular discontinuities. Thus, we induced S1 and S2 stimuli at the same site in a 2-D anisotropic continuous medium. (The sheet had resistivities of 402 Ω-cm longitudinally and 3600 Ω-cm transversely.) With successful propagation, similar conduction events occurred in all directions at all premature intervals.
When reductions of the premature interval approached the refractory period, initial decremental followed by incremental conduction developed in all directions. This process of decrement followed by increment (conduction gating) proved to be a central element in the explanation of events seen in the realistic atrial responses. Figure 4A1 is a map demonstrating spatially the changes in peak INa during the earliest successful premature propagation response in the uniform anisotropic sheet. Decremental conduction (red and gray areas) occurred in all directions from the stimulus (asterisk) to the black oval line, at which incremental conduction began (green area). Panel A2 shows INa curves at sites progressively distal to the stimulus, which illustrates the similar events during propagation in all directions. That is, peak INa decreased monotonically to the black oval line (red curves), and beyond this line peak INa increased (black curves). With increasing distance from the premature stimulus, incremental propagation resulted in a rapid increase in peak INa near the stimulus site and thereafter continued to increase gradually toward a limiting value (170 μA/cm2). The increases in peak INa with distance from the premature stimulus site correlated with a progressively greater negative takeoff potential at sites undergoing activation during continued repolarization at the more distant sites. Thus, INa interactions with a continuous anisotropic structure failed to produce arrhythmogenic conduction abnormalities. Specifically, although decrement-increment occurred as a fundamental process following early premature stimuli, there was no spatial nonuniformity in propagation events.
Figure 4.
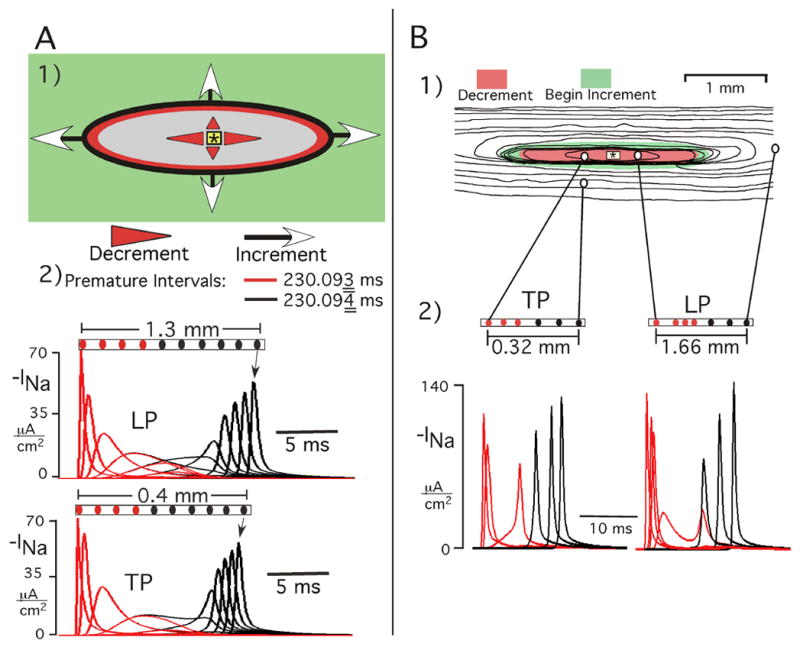
Decremental-incremental propagation (conduction gating) as a fundamental process initiated by early premature stimuli. A: Earliest successful premature response in a hypothetical continuous anisotropic sheet. Panel A1 shows a map that spatially represents INa events. Red and gray areas represent decremental conduction, and increment occurred in the green area. Panel A2 shows INa curves at sites progressively distal to stimulus (red = decrement, black = increment). Reduction of premature interval by 1 μs produced failure at the oval line. The INa curves for both premature intervals (red = 230.093 ms, black = 230.094 ms) are superimposed to illustrate the marked similarity of the decremental phase inside the black oval for both the successful and the failed response. For purposes of the graphs, negative INa is plotted. B: Spatial effects on INa of reducing the premature interval in atrial age model. Panels B1 and B2 show the excitation sequence with TP and LP INa curves following a premature stimulus interval that was 2 ms longer than refractory period. In the isochrone map, the isochrones are 3 ms apart, the red zone represents region of initial decrement of peak INa, and the green area is the surrounding zone in which increment began. The TP and LP INa curves in panel B2 are at the locations connected to the map in panel B1; red curves are decremental, black curves are incremental.
To ensure that the preceding was the earliest successful response, the premature interval was shortened 1 μs further, which resulted in decrement (red curves) continuing to occur in all directions, but with failure at the oval black line (Figure 4A2). This premature interval thereby identified the refractory period; i.e., the time at which a stimulus fails to produce excitation at a remote site.
Atrial Age Model Results
Effects of Reducing the Premature Stimulus Interval
All sites had a control Vm resting potential of −74.2 mV. The takeoff potential of the earliest propagated premature responses varied between −66.4 mV (refractory period 231.112 ms) and −65.4 mV (refractory period 222.638 ms), values similar to those measured experimentally (−63 mV).
When the refractory period was approached, decremental changes in peak INa appeared. An example is shown in Figure 4B for a premature interval 2 ms greater than the refractory period. The INa curves of TP and LP were initiated with decrement of peak INa followed by increment that began at sites distal to the stimulus in all directions of propagation. Thus, premature intervals that exceeded the refractory period by 2–5 ms produced conduction patterns and INa changes in the atrial age model that were similar to the earliest successful responses in the continuous medium (Figure 4A).
Lateral Shift of Longitudinal Propagation Produced by Earliest Successful Response
When the premature interval was within 1.75 ms down to 1 μs of the refractory period, abrupt changes occurred in the pattern of propagation in an area lateral to the stimulus site. One type of response of the extracellular waveforms occurred at 5 of 8 premature stimulus locations in the atrial age model (Figure 5A). At recording position 1, the control large biphasic Φe waveform of LP changed to a multiphasic low amplitude waveform. At positions 2 and 3, the control low amplitude multiphasic waveforms of TP changed to larger biphasic deflections. Note the relative timing of waveforms 2 and 3 in the column on the right, which was indicative of retrograde longitudinal propagation in an area lateral to the stimulus site. This earliest propagated response was remarkably similar to that of the experimental Φe waveforms of Figure 2A.
Figure 5.
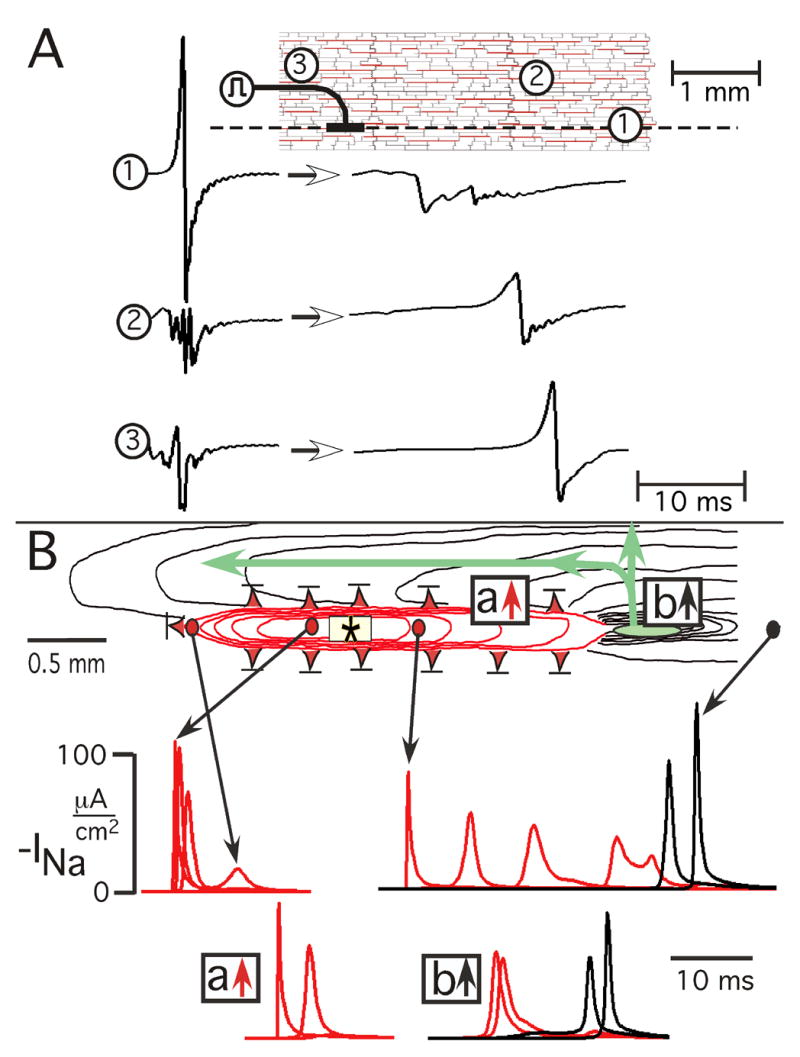
Lateral shift of longitudinal conduction produced by earliest successful response in atrial age model. A: Unipolar extracellular waveforms. Encircled numbers on model grid identify location of extracellular waveforms, and the dashed line is longitudinal axis of stimulus (symbol). Arrows between waveforms indicate change from control (left) to earliest premature successful response (right). B: Underlying pattern of excitation spread and associated sodium current events. Red isochrones represent decremental conduction, black isochrones represent incremental or stable propagation. Isochrones are 3 ms apart. Red triangles with bars indicate locations of failure of decremental conduction. Small green oval denotes location of initiation of incremental conduction. The time course of INa is shown below: the locations of the INa curves during initial LP are represented by arrows from circles. The locations of the INa curves of initial transverse conduction are identified by boxes in which red arrow denotes decrement to failure and black arrow denotes decrement followed by increment (a conduction gate). The events shown occurred at a premature stimulus interval of 222.639 ms, and conduction failed at a stimulus interval of 222.638 ms (refractory period).
From these sets of waveforms alone, whether of experimental or model origin, it was impossible to determine the whole sequence of events that led to their being present. In fact, the origin remained something of a mystery until a map of the entire 2-D pattern of events had been created using the model. When that 2-D map had been created, it showed the whole picture as follows. The associated spread of excitation and underlying sodium current events are shown in Figure 5B.
In one direction of LP (leftward), initial decremental conduction (red isochrone lines) occurred with failure (red triangle with bar) approximately one mm from the stimulus.
In the other longitudinal direction, decremental conduction occurred over a greater distance and initiated incremental conduction in a small area (green oval) 2 mm from the stimulus (conduction gate).
Along both sides of the region of longitudinal decremental conduction, transverse propagation decremented to failure (red triangles with bars).
As incremental transverse propagation moved laterally from the small initial incremental zone (green oval), the wavefront divided to produce retrograde longitudinal conduction in a region lateral to the stimulus.
The INa curves of Figure 5B indicate that decremental conduction occurred as an active regenerative process in all directions for variable distances from the stimulus site until the regenerative process either failed or increased as incremental propagation. When the premature interval was reduced 1 μs (from 222.639 to 222.638 ms), there was failure to propagate in the small area in which increment previously had occurred.
Reentry Produced by Earliest Successful Premature Response
A different premature response occurred with 3 of 8 stimulus sites in the atrial age model (Figure 6). The most prominent change from control to earliest premature extracellular waveforms occurred along the longitudinal axis of the stimulus. Panel A shows an example at a distance of 2 mm from the stimulus. The large control Φe biphasic waveform changed to a low amplitude uniphasic positive deflection (arrow). After a delay of approximately 40 ms, small multiphasic deflections occurred. These Φe waveform changes, as well as the spatial dimensions in which they occurred in the atrial age model, were very similar to the experimental Φe waveform changes of Figure 2B.
Figure 6.
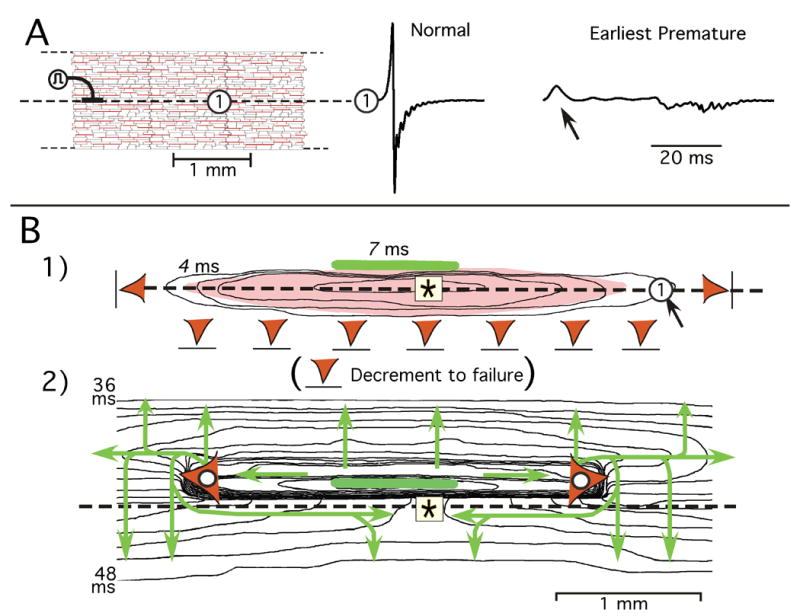
Reentry produced by earliest successful response in atrial age model. A: Representative premature extracellular waveform change along longitudinal axis of the stimulus. B: Underlying excitation sequence depicted in two sequential isochrone maps. Isochrones are separated by 2 ms. Panel B1 shows initial decremental conduction in all directions with failure (red triangles) in both longitudinal directions and in the inferior direction of transverse decrement. The elongated light-red area superimposed on isochrones represents region of INa turn-on during decrement; arrow pointing to the circle marks location of the Φe waveform in panel A. Green horizontal bar represents small area in which incremental propagation began. Panel B2 is an isochrone map of excitation spread from the area of initial incremental conduction. Each of the red triangles with white circles mark the location at which longitudinal conduction failed after being initiated in the area of the green bar. The green arrows show the direction of isochrone movement in each area. The events shown occurred at a premature stimulus interval of 231.113 ms; conduction failed at a stimulus interval of 231.112 ms (refractory period).
With the computer model it was possible to generate the full spatial map. The associated sequence of excitation spread that generated the Φe waveforms in Panel A is shown in sequential isochrone maps in Figure 6B.
Decrement of peak INa occurred in all directions during the first 7 ms following the premature stimulus (Figure 6B1). Failure of conduction occurred in both longitudinal directions and in the inferior transverse direction (red triangles with bars). Superimposed on the isochrone map in Panel B1, the light-red elongated area represents the region in which decrement of peak INa occurred from the stimulus site. The black arrow pointing to the circle marks the location at which the early Φe positive deflection in Panel A occurred. There was no turn-on of INa at this site during decrement, and the initial small positive deflection occurred at a location beyond the failure of decremental INa. Thus, the positive Φe deflection was produced by electrotonic longitudinal currents and it represented an “end-effect” produced by failure of longitudinal decremental conduction.
Incremental conduction began in the small area of the green horizontal bar in each isochrone map of Figure 6B. The following events summarize the sequence of excitation spread after the initiation of incremental conduction in this small area (Figure 6B2).
Longitudinal propagation occurred in a narrow zone extending from the initial incremental area. Then LP failed (red triangle with white circle).
Incremental transverse propagation occurred superiorly, although transverse propagation decremented to failure in the inferior direction.
As incremental transverse propagation continued superiorly, it expanded longitudinally to produce conduction around the area of LP failure.
After conduction occurred around the area of LP failure, the wavefront extended longitudinally in the retrograde direction along the axis of the stimulus to produce reentrant conduction at sites at which initial decremental conduction had occurred.
Because the spread of excitation on the left and right sides of the initial area of increment produced similar patterns, the retrograde reentrant wavefronts from both sides merged and moved transversely in the inferior direction.
Mechanisms of Structural Loading on Transmembrane Potential as a Determinant of Sodium Current During Reentry
A question arises about events of the sodium current secondary to directional differences in the transmembrane potential in the region in which initial decrement of transverse propagation failed inferiorly but was followed by increment superiorly. Figure 7A shows the time course of Vm, INa, and the inactivation variable h during initial transverse decrement to failure inferiorly in the region immediately below the area in which initial decremental TP changed to incremental conduction, as previously shown in the excitation sequences of Figure 6B. At the horizontal level of the stimulus (black circle), the Vm takeoff potential was −66.4 mV and Vm depolarized to +13 mV. This depolarization produced a peak INa of 132 μA/cm2, and the sodium channels rapidly inactivated from an initial h value of 0.4 to zero. At the next inferior site (green circle), from the same takeoff potential Vm depolarized to −34 mV, which produced minimal turn on of INa to a peak of 10 μA/cm2 (3% normal) in association with a slow decline of h with incomplete inactivation of INa. At position 3 (red circle), from the same takeoff potential Vm depolarized to −40 mV, which was insufficient to turn on INa.
Figure 7.
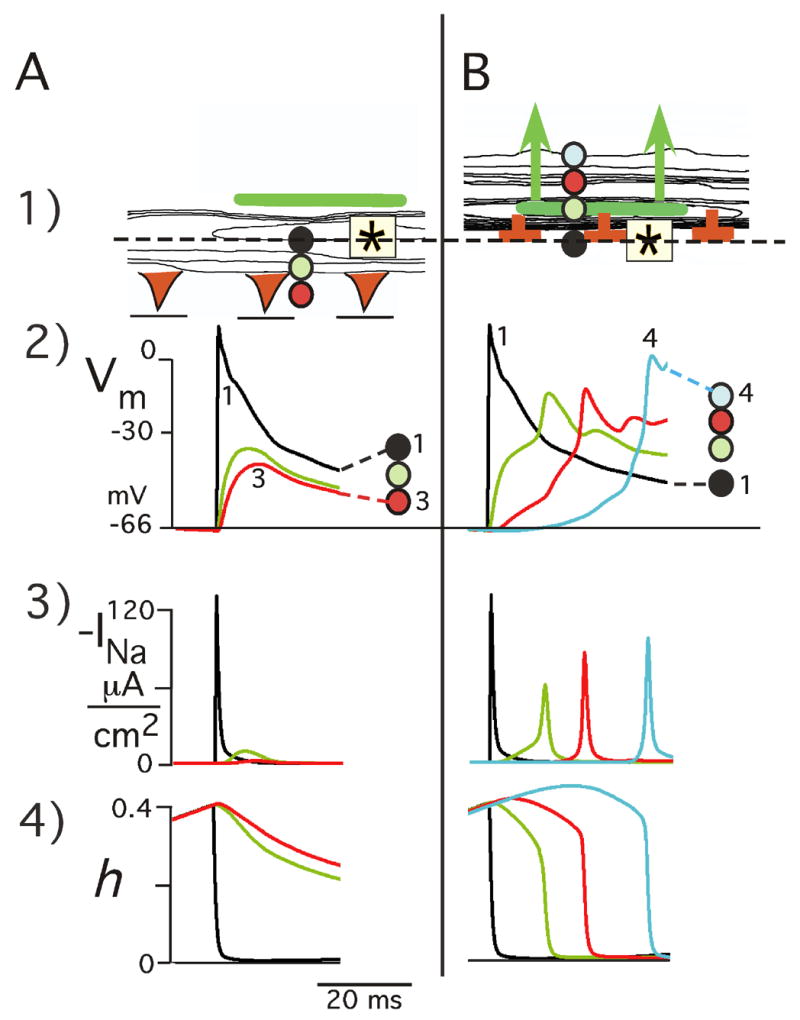
Structural loading effects on Vm and INa as mechanism of initial TP decrement followed by failure versus incremental successful propagation in reentry response. A: Initial TP decrement to failure inferiorly. Panel A1 shows an early part of the excitation sequence of Figure 6B1. Vm, INa, and the state of the sodium channel inactivation gate h are shown at 3 sties 50 μm apart in area beneath the zone of initial incremental conduction (green bar). B: Initial TP incremental conduction superiorly. The top of panel B1 shows the initial part of the excitation sequence of Figure 6B2. The associated time course of Vm, INa, and h is shown below for positions 1–4. The colored circles identify the Vm, INa, and h tracings with rspect to their locations 50 μm apart.
In the superior zone in which increment followed decremental TP (Figure 7B), the takeoff potential was the same as that which occurred inferiorly with failure of conduction. From the takeoff potential of −66.4 mV, there was an initial rise of Vm to −34 mV, which produced a “foot” in the upstroke of Vm (green curve) following which Vm depolarized rapidly to −11 mV. Associated with the initial Vm “foot”, INa also demonstrated a slowly rising foot followed by a rapid increase to 60 μA/cm2 (21% normal). The foot of the INa curve was related to a slow decline in h (0.40 to 0.28), followed by a rapid decrease in h to zero in association with the rapid rise of INa. The above directional TP differences occurred from the same takeoff potential, which emphasizes the delicate balance between microstructural stimulation and microstructural loading.
The question also arises as to what are the underlying spatial events of the transmembrane potential and sodium current in relation to the extracellular potential waveforms that indicate initial decrement to failure followed by reentry along the longitudinal axis of the stimulus. Figure 8 shows this relationship at 4 observation sites. In Panel A, each observation site is located in relation to the excitation sequence (isochrones of Figure 6B) during initial decremental propagation to failure (a) and during reentry (b).
Figure 8.
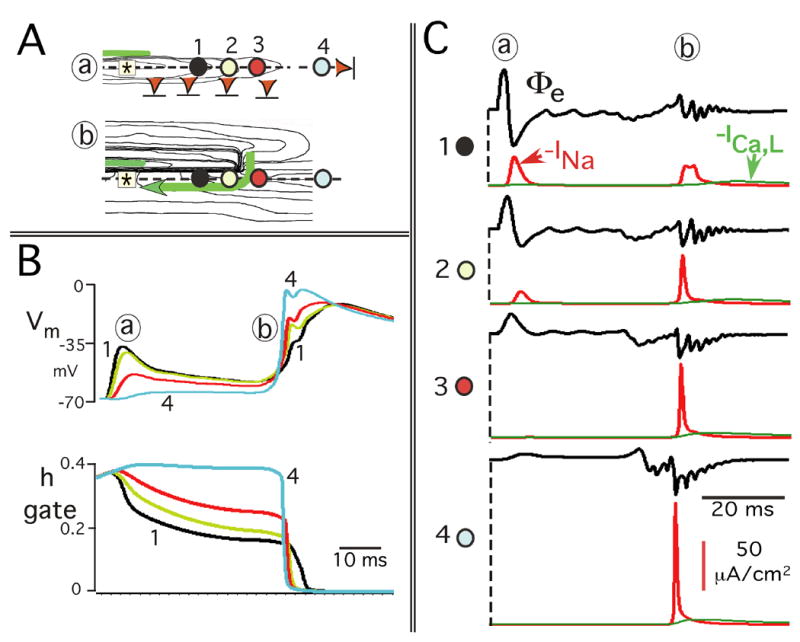
Reentrant mechanisms involving the transmembrane potential effects on h inactivation and INa along longitudinal axis of stimulus. A: Four observation sites are superimposed on parts of the isochrone maps of Figure 6B: (a) initial decremental conduction to failure; (b) longitudinal reentrant excitation. The observations sites are the same in (a) and (b). B: Relationship of the time course of Vm and the sodium h gate at each of the 4 sites in Panel A. C: Time course of INa in relation to the extracellular potential waveforms (Φe) at each observation site. The time course of the L–Type Ca2+ current, ICa,L (green curve), is also shown for each observation site in Panel C to illustrate the relatively small magnitude of ICa,L generated by the earliest propagated premature responses.
Figure 8B shows that during initial decrement to failure (a), the magnitude of Vm depolarization decreased with increasing distance from the stimulus. Those sites that underwent the most prominent Vm depolarization also maintained the most depolarized (least repolarized) state during the subsequent quiescent interval. As a result, when reentry occurred (b), the takeoff potential of Vm occurred at relatively more depolarized values at sites progressively closer to the original stimulus. This feature resulted in a progressive decline in the amplitude of Vm depolarization during reentrant retrograde conduction.
It has long been known that the sodium inactivation gate h is a major determinant of membrane refractoriness during propagation;8 i.e., the lower the value of the h gate, the more refractory the membrane. The relation of the time course of the h gate to the time course of Vm at each site is demonstrated in Figure 8B as follows.
During initial decrement to failure, the spatial decrease in the magnitude of Vm depolarization (a) produced an associated spatial difference in the h gate; the smaller the initial Vm depolarization, the smaller the initial reduction in the value of the h gate.
During the following quiescent interval, varying states of Vm “repolarization” occurred with the larger magnitudes of sustained partial depolarization following the larger initial Vm depolarizations. Thus, these Vm repolarization differences during the quiescent period were created by decremental conduction, and they produced corresponding smaller values of the h gate in the retrograde direction.
These spatial differences in the value of the h gate resulted in a progressive decrease in available sodium current when reentry occurred in the retrograde direction.
Although the values of the h gate were reduced considerably below normal along the longitudinal axis of the stimulus, sufficient sodium channels were available to maintain retrograde conduction during reentry.
The spatial changes in INa that resulted from these events and the associated Φe waveforms are shown in Figure 8C. During initial decrement to failure (a), the change of Φe from a biphasic to a uniphasic positive deflection was due to the spatial decrease in peak INa until INa turn-on failed. Following the subsequent quiescent period, there was a second INa deflection at the sites of initial INa turn-on, a hallmark of reentry. Finally, the sequence of timing of the peaks of the INa curves during reentry (b) occurred as expected for retrograde conduction.
The sequential events depicted in Figure 8B and C for site 2 illustrate the specific interactions of Vm, the h gate, and INa during the entire sequence of (a) and (b). Initial Vm depolarization produced a moderate drop in the value of the h gate which was maintained with minimal decline due to the continued partial depolarized state of Vm during the quiescent period. However, h did not go to zero, which allowed reactivation of INa during reentry.
Discussion
The importance of the observations presented here is that they indicate that remodeling of atrial microstructure with aging creates arrhythmogenic conduction properties in human atrial muscle. After remodeling, variable arrhythmogenic conduction and sodium current disturbances are very sensitive to small changes in the location, as well as in the timing, of premature stimuli within aging atrial bundles. Further, the arrhythmogenic conduction events associated with the earliest premature stimuli occurred within small areas; e.g. these reentrant circuits near the stimulus site were as small as 0.6 × 2.6 mm in both the human atrial bundles and in the age model. These small circuits could be mapped out unambiguously because of the high resolution (50 μm) of observation sites.
The changes in INa demonstrated considerable spatial nonuniformity. For example, the initial decrement of INa to failure occurred in multiple areas whereas the initiation of incremental conduction occurred in a single small region distal to the stimulus. From the standpoint of mechanisms, the locations in which initial INa failure occurred and the location of the small area in which incremental INa began determined the subsequent conduction events; i.e., reentry versus a lateral shift of retrograde longitudinal conduction. These phenomena provide an important area for future study of subthreshold events and their ionic mechanisms. Also, as shown in Figure 8B, there were site-to-site Vm repolarization differences following the initial Vm depolarizations, with subsequent reentry. Thus, the question arises as to whether changes in the background potassium repolarization currents (e.g., It) would alter these reentrant results. Multiple simulations demonstrated that the same earliest premature responses occurred when differences in the duration of the control action potential (S1) were produced due to changes from 0.25 to 2.0 times the original value of gt, the maximum conductance constant of the transient outward current.
Kao and Hoffman17 initially described “graded responses” in 1-D Purkinje strands that did not propagate and led to “all or none” responses downstream from the premature stimulus site. Our results suggest that in aging atrial bundles there is a corresponding phenomenon, although identifying the onset of an “all or none” response must be interpreted differently in 2-D. There was regenerative INa during both decremental and incremental propagation; i.e., both produced propagation of an excitatory response. In 2-D, however, the response varied, longitudinal versus transverse, and one direction as compared to the opposite direction. Most significantly, there was a response, which we have termed a conduction gate, that was selective in its direction, and such gating led to a shifted or reentrant pattern of subsequent excitation. In 1988 Chen et al.2–4 initiated a series of studies in ventricular muscle in which macroscopic repolarization gradients were induced by S1-S2 stimuli at different locations. In the presence of macroscopic repolarization gradients, they found that the earliest site of excitation following early premature stimuli occurred consistently at a location between the S1 and S2 sites.3 Their experimental result also appears to represent a “conduction gate” where initial successful propagation is initiated by early premature impulses in the presence of macroscopic repolarization gradients in uniform anisotropic tissue.
It is interesting that the abnormal lateral premature response that occurred in our experiments (Figure 2A), which was reproduced in the age model, had some similarities to “reflected reentry” described by Antzelevitch and Moe.18 However, differences included return propagation lateral to the stimulus site with the early premature stimuli in the pectinates whereas reflected reentry occurred in a 1-D experimental model. One might also consider reflected reentry the cause of the second response with reentry in a small area. However, reflection would not involve the initial production of transverse propagation that led to reentry.1
In our study with S1 and S2 at the same site (to avoid macroscopic repolarization gradients), the relative location of initial incremental conduction following decrement (conduction gate) changed when there were small shifts in the position of the initiating stimulus. The significance of these changes was that the location of the onset of incremental conduction following decrement was a major determinant in the overall arrhythmogenic conduction response that followed early premature stimuli. One might consider the variability in the structure around the stimulus site to be an alternative to creating a repolarization gradient, or perhaps a mechanism for creating one. In that sense, the remodeling that occurs with aging serves as a mechanism that replaces the need for a prior conditioning repolarization gradient.
Study Limitations
Experimental measurements of the underlying changes in the sodium current during conduction of premature beats in multicellular preparations are not yet available. This problem is due to the absence of an available way to voltage clamp the sarcolemmal membrane during the spatial voltage gradients created by propagating depolarization. Until such experimental information is available, perhaps a major implication of this study is the need for combined experimental high resolution optical mapping19,20 and microstructural model analyses of premature-induced conduction abnormalities in a variety of tissues, which is beyond the scope of this paper. Here we have focused on an analysis of arrhythmogenic INa-structural interactions in a model based on experimentally measured variations in cellular geometry and in cellular connectivity in aging human atrial bundles. Details of the mechanisms as to why decrement-to-failure occurs in one area but not in another are unknown.
The analysis here of microstructural mechanisms that alter ionic currents has been limited to the sodium current. The results of Anyukhovsky et al.6 indicate that during aging in canines there also are changes in atrial repolarization currents that prolong the action potential without a change in the function of the fast sodium channel. Our model does not incorporate the known spatial heterogeneity of atrial action potential duration that occurs at a larger size scale21 than the conduction abnormalities we found within small areas. Rather, the results here show that microstructural complexities alone can produce these abnormalities of premature conduction. The results provide a starting point for this relatively unexplored area by showing, in addition, that structural model results correspond to experimental findings.
Our analysis also did not include any possible effects of myocyte-fibroblast connections as described in a recent paper by Miragoli et al. 22 They demonstrated in cultured cells that a major electrotonic effect of such connections was to decrease the velocity of propagation along the cells. It seems unlikely, however, that such connections played a significant role in our experimental results because the average LP velocity of 9 uniform anisotropic pectinates without extensive fibrosis was less than the average LP velocity of the age preparations (Table 1).
Conclusions
It is interesting that none of the patients from whom the bundles were isolated had atrial arrhythmias. Yet precisely timed and located early premature stimuli produced arrhythmogenic conduction abnormalities in the aged bundles with nonuniform anisotropic structure, and such stimuli did not produce these abnormalities in the younger uniform anisotropic bundles. Thereby, the results suggest a microstructural basis as to why atrial premature beats may or may not produce arrhythmogenic conduction. The results indicate that the production of specific conduction events depended on at least 3 factors: 1) the selective microstructural substrate, in this case aging changes that produce fibrosis; 2) a precisely located premature impulse within atrial bundles; and, 3) a precisely timed premature stimulus. Consequently, we think that these results would likely be more important to the initiation of clinical atrial arrhythmias, which usually involve large reentrant circuits, than to their maintenance.
The results presented here are a product of a detailed computer model of human atrial tissue. Confidence in the model derives from its foundation in experimentally established properties of cardiac cells, of their membrane currents, and the pattern of connections of cells depending on age. Further confidence is provided by the fact that the model results correspond in detail to prior experimental findings. The present results nonetheless include a number of detailed new predictions of the behavior of propagation and excitation sequences, following critically timed premature stimuli, in cardiac tissue that has structural variability. It will be important to see how well additional future experimental studies refute or confirm these quantitative predictions.
List of abbreviations (in order of appearance in text)
- S2
premature stimulus
- S1
control stimulus
- Cx43
connexin43
- Cx40
connexin40
- Gj
conductance of gap junction plaques
- LP
longitudinal propagation
- TP
transverse propagation
- dVm/dtmax
maximum rate of rise of action potential
- PNa
maximum conductance constant for the sodium permeability
- Vm
transmembrane potential
- INa
sodium current
- h
sodium current inactivation gate (sum of h1 and h2)
- ICa,L
L-Type Ca2+ current
- It
transient outward K+ current
- Isus
sustained outward K+ current
- Φe
extracellular potential
- gt
maximum conductance constant of transient outward K+ current
Footnotes
This work was supported by the National Heart, Lung, and Blood Institute of the NIH (Grant H50537).
Publisher's Disclaimer: This is a PDF file of an unedited manuscript that has been accepted for publication. As a service to our customers we are providing this early version of the manuscript. The manuscript will undergo copyediting, typesetting, and review of the resulting proof before it is published in its final citable form. Please note that during the production process errors may be discovered which could affect the content, and all legal disclaimers that apply to the journal pertain.
References
- 1.Spach MS, Dolber PC, Heidlage JF. Influence of the passive anisotropic properties on directional differences in propagation following modification of the sodium conductance in human atrial muscle. A model of reentry based on anisotropic discontinuous propagation. Circ Res. 1988;62:811–832. doi: 10.1161/01.res.62.4.811. [DOI] [PubMed] [Google Scholar]
- 2.Chen P-S, Wolf PD, Dixon EG, Danieley ND, Frazier DW, Smith WM, Ideker R. Mechanism of ventricular vulnerability to single premature stimuli in open-chest dogs. Circ Res. 1988;62:1191–1209. doi: 10.1161/01.res.62.6.1191. [DOI] [PubMed] [Google Scholar]
- 3.Gotoh M, Uchida T, Mandel WJ, Fishbein MC, Chen P-S, Karagueuzian HS. Cellular graded responses and ventricular vulnerability to reentry by a premature stimulus in isolated canine ventricle. Circulation. 1997;95:2141–2154. doi: 10.1161/01.cir.95.8.2141. [DOI] [PubMed] [Google Scholar]
- 4.Karagueuzian HS, Chen P-S. Cellular mechanism of reentry induced by a strong electrical stimulus: Implications for fibrillation and defibrillation. Cardiovasc Res. 2001;50:251–262. doi: 10.1016/s0008-6363(00)00298-4. [DOI] [PubMed] [Google Scholar]
- 5.Antzelevitch C, Fish J. Electrical heterogeneity within the ventricular wall. Basic Res Cardiol. 2001;96:517–527. doi: 10.1007/s003950170002. [DOI] [PubMed] [Google Scholar]
- 6.Anyukhovsky EP, Sosunov EA, Plotnikov A, Gainullin RZ, Jhang JS, Marboe CC, Rosen MR. Cellular electrophysiologic properties of old canine atria provide a substrate for arrhythmogenesis. Cardiovasc Res. 2002;54:462–469. doi: 10.1016/s0008-6363(02)00271-7. [DOI] [PubMed] [Google Scholar]
- 7.Udea N, Zipes DP, Wu JW. Epicardial but not endocardial premature stimulation initiates ventricular tachyarrhythmia in canine in vitro model of long QT syndrome. Heart Rhythm. 2004;1:684–694. doi: 10.1016/j.hrthm.2004.07.019. [DOI] [PubMed] [Google Scholar]
- 8.Quan W, Rudy Y. Unidirectional block and reentry of cardiac excitation: a model study. Circ Res. 1990;66:367–382. doi: 10.1161/01.res.66.2.367. [DOI] [PubMed] [Google Scholar]
- 9.Nygren A, Fiset C, Firek L, Clark JW, Lindblad DS, Clark RB, Giles WR. Mathematical model of an adult human atrial cell. The role of K+ currents in repolarization. Circ Res. 1998;82:63–81. doi: 10.1161/01.res.82.1.63. [DOI] [PubMed] [Google Scholar]
- 10.Dolber PC, Beyer EC, Junker JL, Spach MS. Distribution of gap junctions in dog and rat ventricle studied with a double-label technique. J Mol Cell Cardiol. 1992;24:1443–1457. doi: 10.1016/0022-2828(92)91085-j. [DOI] [PubMed] [Google Scholar]
- 11.Gerdes AM, Onodera T, Tamura T, Suleman S, Bohlmeyer TJ, Abraham WT, Bristow MR. New method to evaluate myocyte remodeling from formalin-fixed biopsy and autopsy material. J Cardiac Failure. 1998;4:343–348. doi: 10.1016/s1071-9164(98)90240-8. [DOI] [PubMed] [Google Scholar]
- 12.Spach MS, Dolber PC. Relating extracellular potentials and their derivatives to anisotropic propagation at a microscopic level in human cardiac muscle. Evidence for electrical uncoupling of side-to-side fiber connections with increasing age. Circ Res. 1986;58:356–371. doi: 10.1161/01.res.58.3.356. [DOI] [PubMed] [Google Scholar]
- 13.Spach MS, Heidlage JF. The stochastic nature of cardiac propagation at a microscopic level. Electrical description of myocardial architecture and its application to conduction. Circ Res. 1995;76:366–380. doi: 10.1161/01.res.76.3.366. [DOI] [PubMed] [Google Scholar]
- 14.Spach MS. Miller WT III, Geselowitz DB, Barr RC, Kootsey JM, Johnson EA. The discontinuous nature of propagation in normal canine cardiac muscle. Evidence for recurrent discontinuities of intracellular resistance that affect the membrane currents. Circ Res. 1981;48:39–54. doi: 10.1161/01.res.48.1.39. [DOI] [PubMed] [Google Scholar]
- 15.Kostin S, Klein G, Szalay Z, Hein S, Bauer EP, Schaper J. Structural correlate of atrial fibrillation in human patients. Cardiovasc Res. 2002;54:361–379. doi: 10.1016/s0008-6363(02)00273-0. [DOI] [PubMed] [Google Scholar]
- 16.Saffitz JE, Kleber AG. Effects of mechanical forces and mediators of hypertrophy on remodeling of gap junctions in the heart. Circ Res. 2004;94:585–591. doi: 10.1161/01.RES.0000121575.34653.50. [DOI] [PubMed] [Google Scholar]
- 17.Kao CY, Hoffman BF. Graded and decremental response in heart muscle fibers. Am J Physiol. 1958;194:187–196. doi: 10.1152/ajplegacy.1958.194.1.187. [DOI] [PubMed] [Google Scholar]
- 18.Antzelevitch C, Moe GK. Electrotonically mediated delayed conduction and reentry in relation to “slow responses” in mammalian ventricular conducting tissue. Circ Res. 1981;49:1129–1139. doi: 10.1161/01.res.49.5.1129. [DOI] [PubMed] [Google Scholar]
- 19.Eloff BC, Lerner DL, Yamada KA, Schuessler RB, Saffitz JE, Rosenbaum DS. High resolution optical mapping reveals conduction slowing in connexin43 deficient mice. Cardiovasc Res. 2001;51:681–690. doi: 10.1016/s0008-6363(01)00341-8. [DOI] [PubMed] [Google Scholar]
- 20.Koura T, Hara M, Takeuchi S, Ota K, Okada Y, Miyoshi S, Watanabe A, Shiraiwa K, Mitamura H, Kodama I, Ogawa S. Anisotropic conduction properties in canine atria analyzed by high-resolution optical mapping. Circulation. 2002;105:2092–2098. doi: 10.1161/01.cir.0000015506.36371.0d. [DOI] [PubMed] [Google Scholar]
- 21.Spach MS, Dolber PC, Heidlage JF. Interaction of inhomogeneities of repolarization with anisotropic propagation in dog atria. A mechanism for both preventing and initiating reentry. Circ Res. 1989;65:1612–1631. doi: 10.1161/01.res.65.6.1612. [DOI] [PubMed] [Google Scholar]
- 22.Miragoli M, Gaudesius G, Rohr S. Electrotonic modulation of cardiac impulse conduction by myofibroblasts. Circ Res. 2006;98:801–810. doi: 10.1161/01.RES.0000214537.44195.a3. [DOI] [PubMed] [Google Scholar]