

Abstract
This study tests the hypothesis that positively charged polyethylenimines (PEIs) enhance nasal absorption of low molecular weight heparin (LMWH) by reducing the negative surface charge of the drug molecule. Physical interactions between PEIs and LMWH were studied by Fourier transform infrared (FTIR) spectroscopy, particle size analysis, conductivity measurements, zeta potential analysis, and azure A assay. The efficacy of PEIs in enhancing nasal absorption of LMWH was studied by administering LMWH formulated with PEI into the nose of anesthetized rats and monitoring drug absorption by measuring plasma anti-factor Xa activity. The metabolic stability of LMWH was evaluated by incubating the drug in rat nasal mucosal homogenates. FTIR spectra of the LMWH-PEI formulation showed a shift in peak position compared to LMWH or PEI alone. Decreases in conductivity, zeta potential and the amount of free LMWH in the PEI-LMWH formulation, as revealed by azure A assay, suggest that PEIs possibly neutralize the negative surface charge of LMWH. The efficacy of PEI in enhancing the bioavailability of nasally administered LMWH can be ranked as PEI-1000 KDa ≥ PEI-750 KDa > PEI-25 KDa. When PEI-1000 KDa was used at a concentration of 0.25%, there was a 4-fold increase in both the absolute and relative bioavailabilities of LMWH compared to the control formulation. Overall, these results indicate that polyethylenimines can be used as potential carriers for nasally administered LMWHs.
Keywords: low molecular weight heparin, polyethylenimine, nasal absorption, enoxaparin, conductivity
1. Introduction
Polyethylenimine (PEI) is a cationic polymer that has long been used in nonpharmaceutical processes, including water purification and paper and shampoo manufacturing. PEIs are also reported to be relatively safe for internal use in animals and humans [1]. These polymers are highly positively charged because of the presence of a protonable amino nitrogen at every third atom of the polymeric backbone. As the polymer contains repeating units of ethylamine, PEIs are also highly water soluble. PEIs are available in both linear and branched forms with molecular weights ranging from 700 Da to 1000 KDa [2,3]. Over the past decade, PEIs have been extensively studied as a vehicle for nonviral gene delivery. In fact, PEIs are one of the most promising nonviral vectors and have produced excellent transfection efficiencies in both in vitro and in vivo models [4]. Polycation-mediated gene delivery is based on electrostatic interactions between the polycations and the negatively charged phosphate groups of DNA. PEI condenses the DNA in solution and the resulting PEI-DNA complexes, carrying positive surface charges that interact with the negatively charged cell membrane, are readily endocytosed by many cell types [2]. Recently, it has also been shown that polycationic materials, such as poly-L-arginine, protamine and chitosan, have the potential to promote transmucosal absorption of macromolecules [5–8].
However, no data are available as to the use of cationic polymers in enhancing absorption of negatively charged high molecular weight drugs. Low molecular weight heparins (LMWHs) are negatively charged oligosaccharides used in the treatment of deep vein thrombosis and pulmonary embolism. However, the use of LMWH on an outpatient basis has been limited because of the requirement for daily subcutaneous injections. Consequently, attempts have been made to deliver LMWH noninvasively, including by oral, nasal and pulmonary routes [9–11]. But the presence of carboxylic acid and sulfate groups in the glycosaminoglycan units of LMWH renders the molecule highly anionic and therefore an unlikely candidate for direct absorption via the mucosa. Since DNA and LMHWs have similar charge-distribution properties, PEI should also be able to form a complex with LMWH via electrostatic interactions. If so, this should neutralize the drug’s surface charge and facilitate its absorption via mucosal routes.
Therefore, this study was designed to test the hypothesis that PEI can enhance nasal absorption of enoxaparin, a LMWH, and that such enhancement occurs through neutralization of the negatively charged glycosaminoglycan unit of the drug. In this regard, enoxaparin was formulated with PEIs of different molecular weights and the efficacy of PEI in enhancing nasal absorption of LMWH was tested in a rodent model.
2. Materials and Methods
2.1. Materials
Enoxaparin injection (Lovenox®, average molecular weight and anti-factor Xa activity are 4500 Da and 100 U/mg, respectively) was obtained from Aventis Pharmaceutical Products Inc. (Bridgewater, NJ). Polyethylenimines with molecular weights of 25 KDa, 750 KDa or 1000 KDa, poly-L-arginine and azure A were obtained from Sigma-Aldrich (St. Louis, MO). LMWH (average molecular weight and anti-factor Xa activity are 4494 Da and 105 U/mg, respectively) used in the FTIR spectroscopy study, particle size analysis, conductivity measurement and azure A assay was purchased from Celsus Laboratories (Cincinnati, Ohio). Enoxaparin and LMWH used for physical characterization were prepared by alkaline degradation and oxidative depolymerization, respectively.
2.2. Fourier Transform Infrared Spectroscopy (FTIR)
Attenuated Total Reflectance Fourier transform infrared (FTIR) spectra were recorded on a Nicolet Nexus 470 spectrometer (Thermo Nicolet Corp., Madison, WI) using the Smart Miracle ATR accessory. Samples (~20 μl) were applied to the center of the sample holding device and scanned between 4000 and 700 cm−1 at a resolution of 1 cm−1. The IR scans were processed using Happ-Genzel apodization and represented as percent transmittance on a common scale. For the FTIR studies, PEI of molecular weight 25 KDa was used because it is available as a semisolid agent consisting of 100% polymer; the other PEIs used in the study are available as 50% solutions in water. Similarly, pure LMWH obtained from Celsus Laboratories (Cincinnati, Ohio) was used for FTIR analysis.
2.3. Particle Size Determination
For particle size determination, the samples were prepared by adding a fixed concentration of LMWH (40 mg/ml) to aqueous solutions of varying concentrations (0.125%, 0.25% or 0.5%) of three different PEIs (25, 750 or 1000 KDa). The freshly prepared sample solutions (~200 μl) were dispensed into disposable tubes and particle size measurements were performed in triplicate using a NICOMP™ 380 ZLS, PSS-Nicomp particle sizing system (Santa Barbara, CA).
2.4. Conductivity and Zeta Potential Measurements
For conductivity measurements, LMWH (40 mg/ml), PEIs of three different molecular weights at varying concentrations (0.125%, 0.25% or 0.5%), or LMWH plus PEI solutions were prepared in deionized water and the conductivities were measured in polystyrene tubes. Poly-L-arginine, a cationic polymer, was used as a control for this experiment. Varying concentrations of poly-L-arginine (0.25, 0.5, or 1.0%) were added to a PEI-1000 KDa solution of fixed concentration (0.25%). The conductivity measurements of the test formulations were performed at 25°C with an Accumet AR50 conductivity meter (Fisher Scientific, Pittsburg, PA) using a 4-cell conductivity glass probe. The apparatus was calibrated using a traceable conductivity calibration standard solution (1413 μS.cm−1 at 25 °C). All conductivity values were expressed in microsiemens per cm (μS.cm−1). The zeta-potential measurements were performed using the electrophoretic light scattering method (ELS-8000, Photal Otsuka Electronics Co.LTD, Osaka, Japan). The measurements were performed by micro-electrophoresis at 25°C; the viscosity and dielectric constant of deionized water were used as calculation parameters.
2.5. Quantitative Analysis of PEI- LMWH Interactions
The interactions between LMWH and PEI were further tested by a colorimetric assay using azure A blue dye as described by Cadene et al. [12]. To do this test, a fixed amount of azure A dye solution was mixed with the following test samples: (i) LMWH solutions containing increasing concentrations (10, 20, 50, and 100 μM) of the drug, (ii) 0.125%, 0.25%, 0.5%, and 1% (w/v) solutions of PEIs, or (iii) various LMWH-PEI formulations containing 20 μM of LMWH. In each case, 180 μl (150 μM) of azure A dye was mixed with 20 μl of test sample in a 96-well microplate and the resulting mixture was incubated for 30 min at room temperature. The samples were then measured by a microtiter-plate reader (TECAN U.S. Inc., Research Triangle Park, NC) at 595 nm.
2.6. Preparation of Enoxaparin–PEI Formulations for in vivo Absorption Studies
Enoxaparin-PEI complexes for in vivo absorption studies were prepared by mixing aliquots of PEI and enoxaparin. Before mixing, the drug and polymer were diluted in saline. The resulting solution was then incubated for 30 min at room temperature for complexation to occur. The concentrations of PEIs used in the formulations were 0.125%, 0.25% or 0.5% (w/v). For the in vivo absorption studies, each 20 μl of the final nasal formulation contained an amount of enoxaparin sodium (1 mg) equivalent to 100 U of anti-factor Xa activity. The formulations for subcutaneous administration contained 100 U of anti-factor Xa activity in each 100 μl of solution and the formulations for the intravenous absorption studies contained 100 U of anti-factor Xa activity in each 200 μl.
2.7. Nasal Absorption Studies in Rats
Male Sprague Dawley rats (Charles River Laboratories, Charlotte, NC) weighing between 250–350 g were used for the in vivo absorption experiments (n=3–5). Prior to the experiment, the animals were anesthetized by an intramuscular injection of an anesthetic cocktail containing xylazine (30 mg/kg), ketamine (30 mg/kg) and acepromazine (10 mg/kg). The anesthesia was maintained as needed throughout the experiment. An aliquot (~20 μl) of PEI-enoxaparin complex formulations (330 U/kg body weight) were instilled into the left naris of each rat using a pipette with a disposable plastic tip as described previously [10]. For subcutaneous administration, formulations were administered as a single 100 μl injection under the back skin, and for intravenous administration, a 200 μl bolus injection was administered via the tail vein. After nasal and subcutaneous administration, blood samples (about 300 μl) were collected from the tip of the tail at 0, 30, 60, 120, 240, 360 and 480 min in citrated microcentrifuge tubes and placed on ice. However, in the case of intravenous administration, blood was collected from the orbital vein. Subsequently, the plasma was separated by centrifugation (1600 × g for 5 min) and the plasma samples thus obtained were stored at −20°C until further analysis.
2.8. Enoxaparin Degradation Studies in Rat Nasal Mucosal Homogenates
The nasal homogenates were collected from male Sprague Dawley rats (Charles River Laboratories, Charlotte, NC) weighing between 380–420 g. The rats (n=3) were euthanized by an overdose of intramuscular injection of an anesthetic cocktail containing xylazine, ketamine and acepromazine and nasal mucosal homogenates were prepared as described previously with slight modifications [13]. Nasal mucosae were removed immediately with scissors and scalpel, rinsed 3 times with ice-cold saline buffer (pH 7.4) and homogenized in 5 ml ice-cold medium at 13,000 rpm for 6 min at 4 ºC (Ultra-Turrax 725 Basic, IKA-Werke, Staufen, Germany), and centrifuged at 12,000 rpm for 10 min at 4 ºC (AvantiTM J-25I, Beckman Instruments Inc. Palo Alto, CA). The resulting supernatants were used as the nasal mucosal extracts. The protein content (8.01 ± 0.84 mg/ml) of the extracts was determined by the Bradford method using a Coomassie® blue dye assay reagent (Bio-Rad Laboratories, Hercules, CA). Increasing concentrations of enoxaparin (0.5 to 500 U/ml) were incubated at 37 ºC for 2 hours in saline or nasal mucosal extracts. The resulting solutions were analyzed for anti-factor Xa activity as described below. The degraded form of LMWH was used as a positive control to confirm that the assay, as used in the present study, can reliably quantitate anti-factor Xa activity of intact and degraded LMWH. Degradation of LMWH was induced by incubating the drug with 0.5 M NaOH for 2 hours, and the excess alkali was neutralized by H2SO4 (0.25 M). Prior to determining anti-factor Xa activity, the pH of the LMWH solution was adjusted to 7.4.
All animal studies were conducted in accordance with NIH Guidelines for the Care and Use of Laboratory Animals.
2.9. Measurement of Anti-factor Xa Activity
Anti-factor Xa activity present in blood samples and nasal mucosal homogenates in saline was determined by colorimetric assay using a Chromogenix Coatest Heparin Kit® (Diapharma Group Inc., West Chester, OH). The assay was performed according to the protocol supplied by the manufacturer. Standard curves for determination of anti-factor Xa activity in plasma, saline and NaOH samples were prepared by diluting the drug with pooled plasma or saline, respectively. Plasma obtained from untreated rats was used as a negative control to account for the effect of rat endogenous anti-factor Xa that otherwise could give a false positive increase in anti-factor Xa activity.
2.10. Data Analysis
Standard noncompartmental analysis (Kinetica®, Version 4.0, Innaphase Corp., Philadelphia, PA) was performed to calculate the area under the plasma concentration versus time curve (AUC0→480), relative and absolute bioavailability. Pharmacokinetic parameters of different formulations were compared by ANOVA. When the differences in the means were significant, post-hoc pair wise comparisons were conducted using Newman-Keuls multiple comparison (GraphPad Prism, version 3.03, GraphPad Software, San Diego, CA). Differences in p-values less than 0.05 were considered statistically significant.
3. Results and Discussion
3.1. Fourier Transform Infrared Spectroscopy (FTIR)
Like heparin, LMWH is composed of repeating disaccharide units of D-glucosamine and uronic acid linked by 1, 4 interglycosidic bonds. The main functional groups in the disaccharide unit of LMWH are COO−, SO3−, OH, NH and C-O-C, while the main functional groups in the ethylenimine unit of PEIs are CH2, NH and NH3+. The IR spectrum of LMWH obtained in powder form (Fig. 1) shows two peaks at 1593 and 1035 cm−1 that correspond to stretching vibrations of the carboxylate (COO−) and ether groups (C-O-C) [14], respectively, and the peak at 1222 cm−1 probably results from S=O stretching of sulfate ions. A similar peak at 1222 cm−1 for S=O stretching was observed in the IR spectrum of the glycosaminoglycan unit of heparin [15]. The IR spectrum of PEI shows peaks at 2952 and 2862 cm−1 that can be attributed to asymmetric and symmetric vibrations of the CH2 group, respectively, and the peak at 1453 cm−1 corresponds to in-plane bending of CH2 [14]. The peaks for the bending vibration of the NH group and the stretching vibration of the C-N groups of PEI can be seen at 1585 cm−1 and 1122 cm−1, respectively [16]. Overall, the IR spectra of LMWH and PEI show peaks that are characteristic of their main functional groups. However, there are distinct differences between the IR spectrum of LMWH-PEI complex and that of LMWH or PEI alone. The positions of the peaks for the COO− and SO3− groups of LMWH and the peaks for NH of PEI are changed (Fig. 1 inset). To investigate if the relative proportions of LMWH and PEI present in the formulation play any role in their interaction, IR spectra of LMWH-PEI complex with varying LMWH/PEI ratios (4:1, 2:1, 1:1, w/w) were obtained (Fig. 1). As can be seen, with decreased amounts of LMWH there was an increase in the intensity of the peaks of PEI at 2952 and 2862 cm−1 for the stretching vibrations of CH2. Overall, the spectra of LMWH-PEI complex, or LMWH or PEI alone, suggest an interaction between negatively charged LMWH and positively charged PEI (Fig. 1 inset). Since LMWH contains COO− and SO3− groups and PEI has NH3+, it is likely that these oppositely charged groups interact with each other. In fact, similar interactions between positively charged PEI and negatively charged DNA have been observed by others [16].
Figure 1.
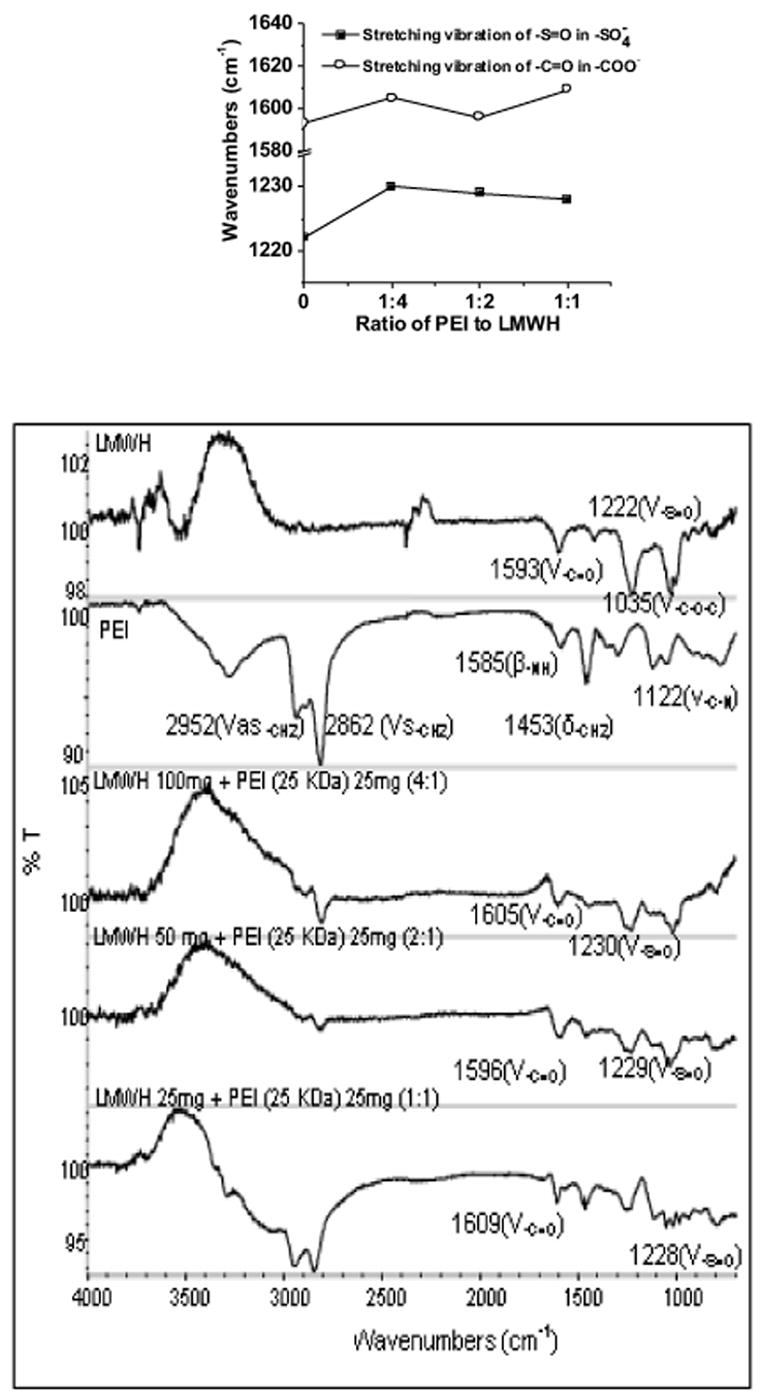
FTIR spectra of polyethylenimine, LMWH, and LMWH-PEI complexes (with increasing proportions of LMWH). Inset shows the changes of peak position for the functional groups of LMWH.
3.2. Particle Size Determination
The particle size increased when the molecular weight of the polymer was increased from 750 KDa to 1000 KDa (Fig. 2). The average particle size for 0.5% 750 KDa PEI was 53 nm, while that for 0.5% 1000 KDa PEI was 84 nm. A similar particle size distribution was observed for 800 KDa PEI (17). It is important to note that the observed particle size is relatively large for a hydrophilic polymer such as PEI. This increase may be because of self-association of PEI molecules. However, it is not known how a hydrophilic substance can undergo self association in an aqueous solution.
Figure 2.
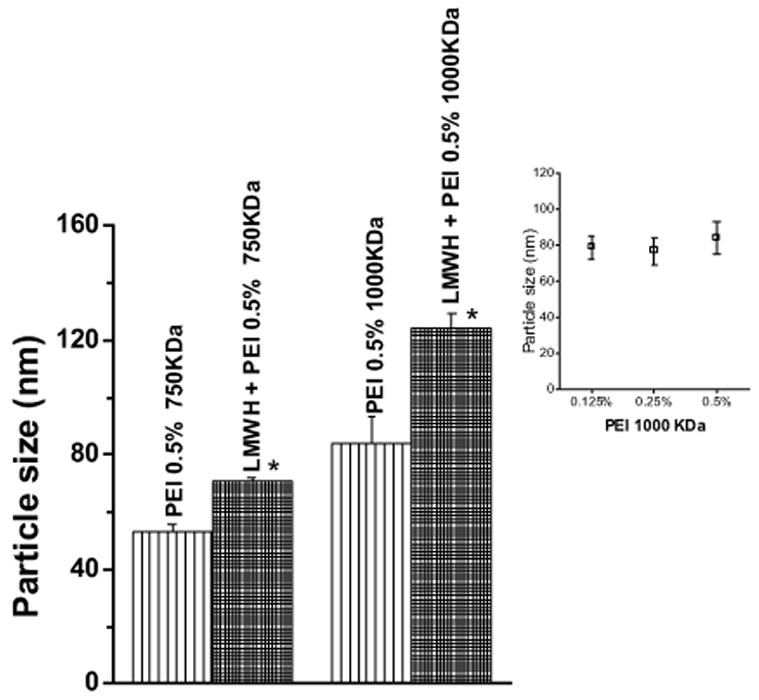
Particle size analysis of 0.5% PEI (750 KDa or 1000 KDa) and formulation containing 0.5% PEI and LMWH (40 mg/ml). Inset shows particle size of different concentrations of PEI-1000 KDa. Data represent mean ± SEM, n=3 (*p <0.05).
When LMWH was added to either of the PEI solutions, a further increase in particle size was observed (p <0.05) (Fig. 2). The latter particles are probably aggregates of smaller complexes of LMWH and PEI. In contrast, 0.5% 25 KDa PEI or LMWH alone, or a complex of 25 KDa PEI plus LMWH did not show any particle size distribution, probably because particles of 25 KDa PEI-LMWH complex and their aggregates were smaller than 5 nm, which is the minimum size measurable by the particle sizing instrument (data not shown). Interestingly, PEI of a specific molecular weight at varying concentrations (0.125%, 0.25% and 0.5%) did not show any differences in particle size, suggesting that size of the particle is related to the molecular weight of a substance rather than the concentration of the complexing agent in solution. As can be seen in Fig. 2 (inset), the differences between the particle sizes produced at different concentrations of 1000 KDa PEI were not statistically significant (p >0.05). The particle size distribution of PEI-LMWH complex indicates that the average particle size of all formulations tested ranged from 71 to 124 nm. This size range is below the size at which maximal nasal absorption occurs for drugs formulated as colloidal preparations. In fact, a recent study showed that maximal nasal absorption occurred when the size of poly-L-lactic acid-polyethylene glycol nanoparticles of the drug was 200 nm [18].
3.3. Conductivity and Zeta Potential Measurements
The conductivity of LMWH, PEIs, and LMWH plus PEI formulation was determined to estimate the ion concentrations of all formulations used in the study. LMWH (40 mg/ml) showed a conductivity of 550 μS/cm and the conductivity values for PEIs were between 80 and 200 μS/cm (Fig. 3A). These data are consistent with expectations because the LMWH used in the study was a sodium salt containing two negative charges on each glycosaminoglycan unit in addition to sodium ions, while PEI contains one positive charge on the monomeric unit of the polymer. For PEIs, a concentration- and molecular-weight-dependent increase in conductivity was observed (Fig. 3A). The latter may be attributed to the fact that a greater number of positively charged groups were present in high molecular weight PEI compared to its low molecular weight counterparts. Furthermore, at a higher concentration, a greater number of ions will be present in solution resulting in increased in conductivity. The predicted value of conductivity of the PEI plus LMWH formulation was calculated by adding the conductivity of the PEI solution to the conductivity of the LMWH solution and then plotting against the observed conductivity of formulations (Fig. 3B). The plot shows that the observed conductivity of formulations containing PEI and LMWH was much less than the predicted conductivity of the solution. This decrease in conductivity suggests that the positive charges of the PEIs tend to balance out the negative charges of LMWH.
Figure 3.
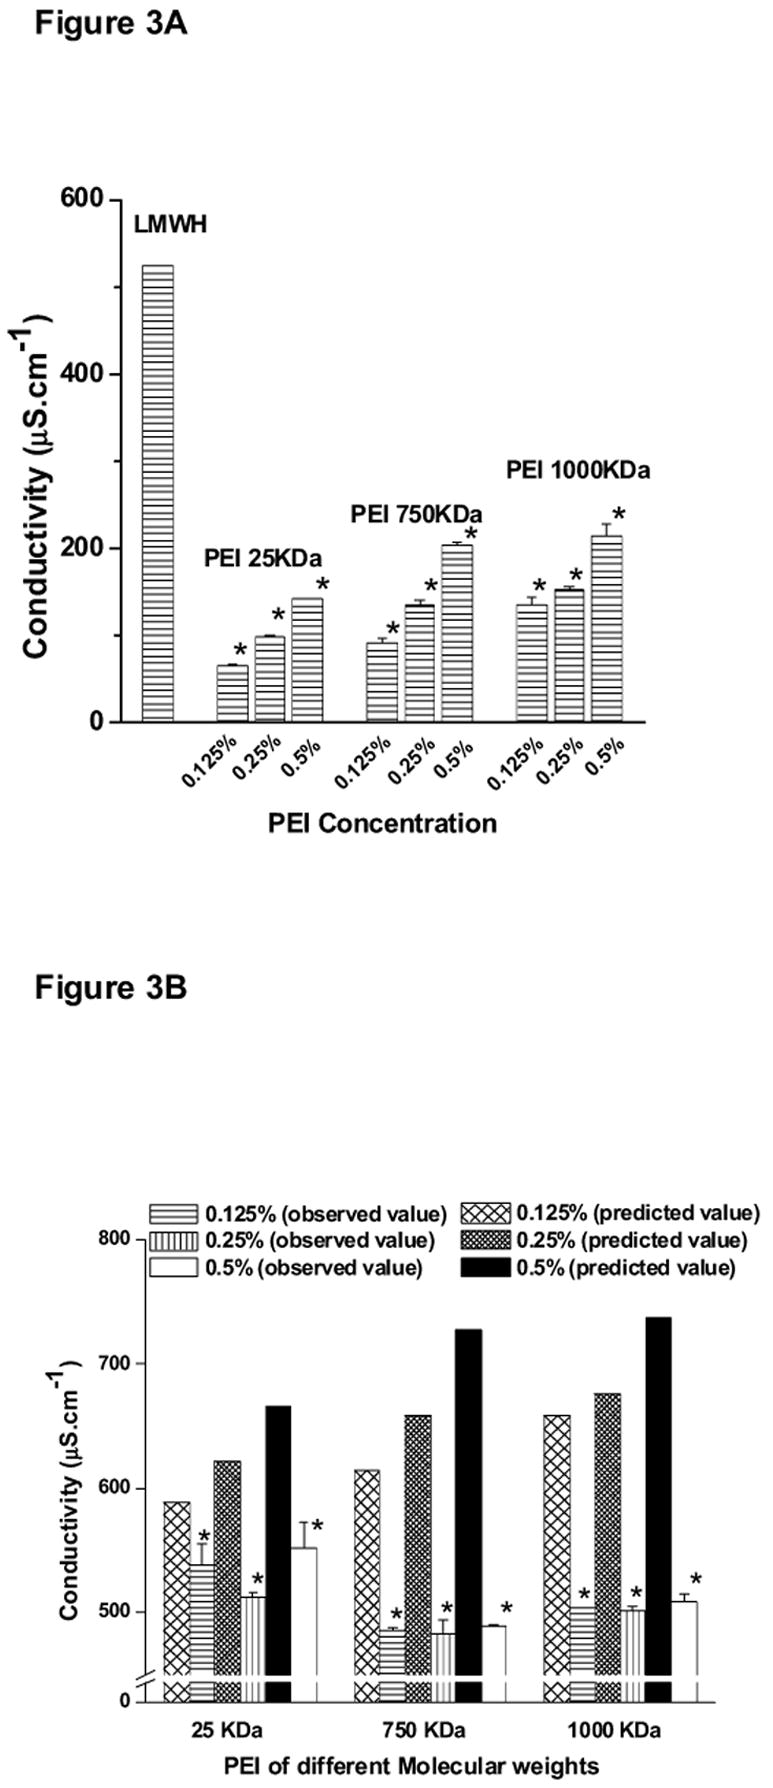
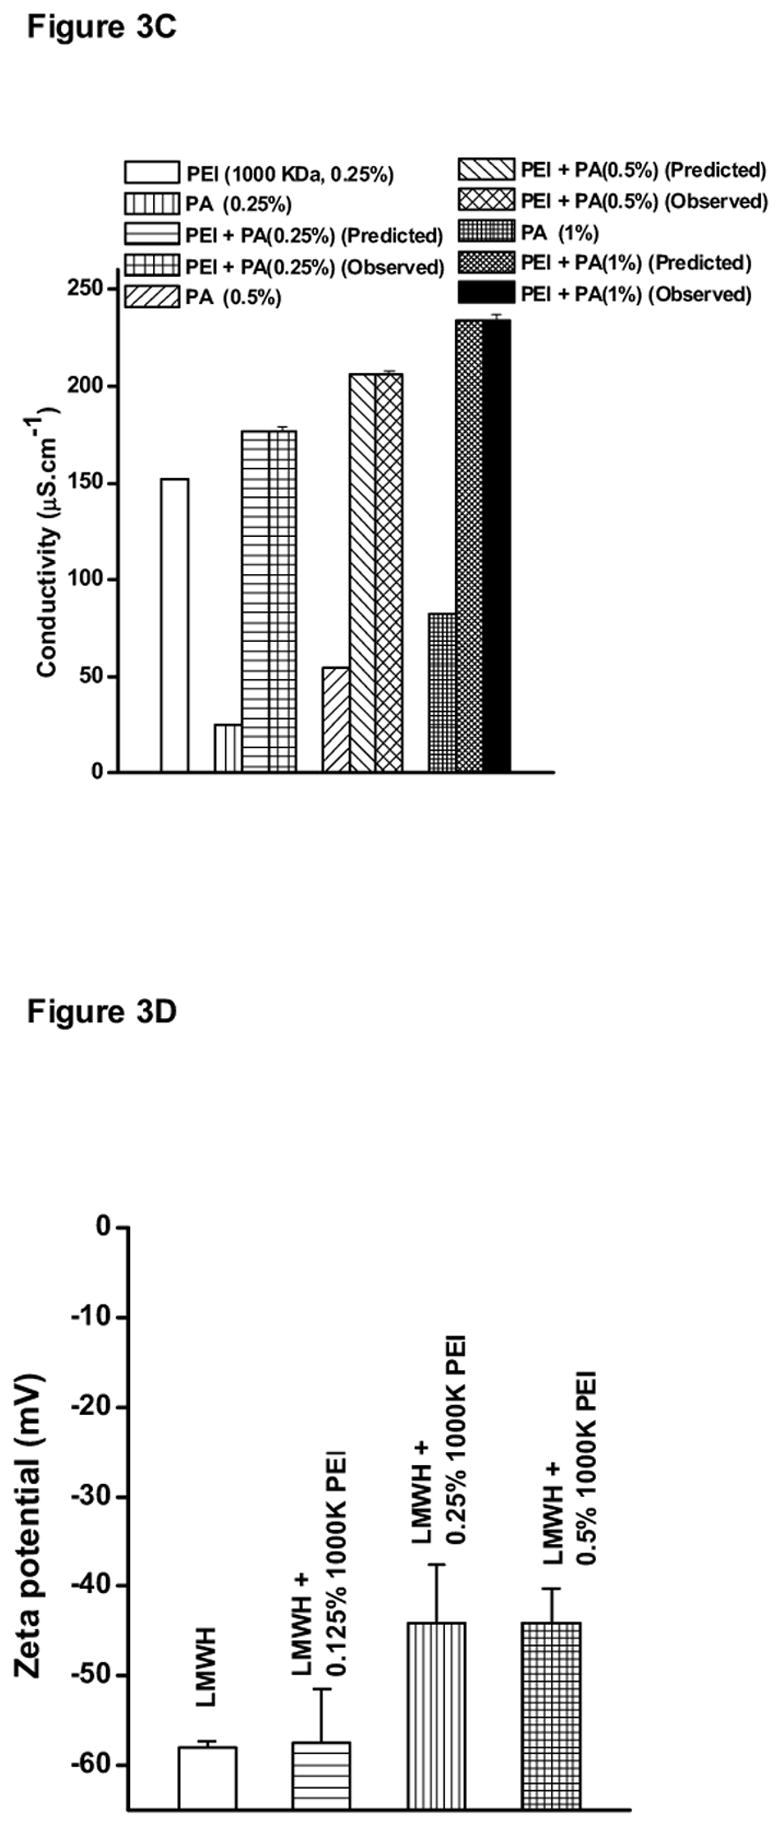
Conductivity of (A) LMWH (40 mg/ml) or PEI, (B) various PEI-LMWH formulations at different concentrations of PEI, (C) PEI-1000 KDa solutions containing different concentrations of Poly-arginine (PA), and (D) Zeta potential of LMWH and LMWH plus different concentrations of PEI-1000 KDa. Data represent mean ± SEM, n=3 (* p <0.05).
The hypothesis of a possible electrostatic interaction between positively charged PEI and negatively charged LMWH was further confirmed by measuring the conductivity of 0.25% PEI-1000 KDa solution in the presence of increasing concentrations (0.25%, 0.5%, or 1.0%) of another positively charged polymer, polyarginine (Fig. 3C). In contrast to the decrease observed in the conductivity of formulation containing LMWH plus PEI, an increase in the conductivity of solutions containing PEI plus polyarginine was observed. The increase in conductivity was equal to the sum of the individual conductivity values of PEI or polyarginine solution alone (p >0.05). Importantly, the predicted values were the same as the observed conductivity values because the phenomena of charge neutralization could not occur between two positively charged polymers.
The zeta potentials of LMWH or LMWH plus different concentrations of PEI-1000 KDa are shown in Fig. 3D. The zeta potential of LMWH was negative with a value of 58. However, as increasing concentrations of PEI-1000 KDa were added to LMWH, the magnitude of the negative charge of LMWH showed a decline, suggesting charge neutralization of LMWH by PEI. This observation further agrees with our hypothesis of a possible electrostatic interaction between negatively charged LMWH and positively charged PEI. Interestingly, the zeta potential values of 0.25% PEI-1000 KDa and 0.5% PEI-1000 KDa were similar (p >0.05). This phenomenon could possibly be due to self association/aggregation of PEI-1000 KDa polymer. At the higher concentration (0.5%), the polymer might self-associate resulting in an overall charge neutralization. Hence, the 0.5% concentration of PEI-1000 KDa did not lead to a further increase in the zeta potential value compared to the 0.25% concentration.
3.4. Colorimetric Assay for Interaction between LMWH and PEI
The azure A assay was performed to further test the hypothesis that PEIs form a complex with LMWH via electrostatic interactions between the electronegative functional groups of the drug and the positively charged surface groups of PEIs [12,19]. No change in absorbance was observed when increasing concentrations of PEI alone were added to the solution (data not shown). However, the level of free LMWH linearly decreased upon addition of PEI to each formulation. For example, when the concentration of PEI-1000 KDa was 0.25%, the amount of unbound drug was about 70%. Also, when the concentration of PEI-1000 KDa was 0.5%, the amount of free drug was about 50% (Fig. 4). These data substantiate the data from FTIR, particle size, conductivity and zeta potential analyses and agree with previously published studies that showed the existence of electrostatic interactions between the positively charged amino groups of PEI and the negatively charged functional groups of heparin [20].
Figure 4.
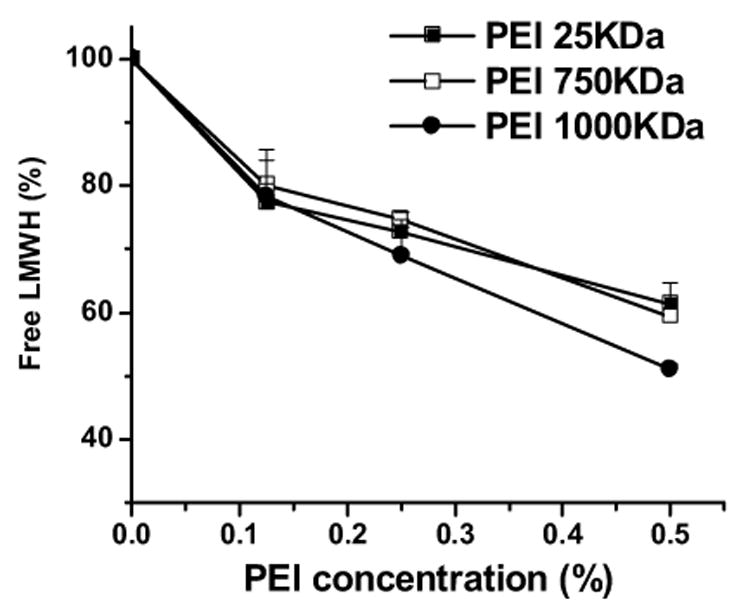
Percentage of free enoxaparin in the different formulations upon complexation with PEI. Data represent mean ± SEM, n=3.
3.5. Nasal Absorption and Bioavailability Studies
The absorption of the drug was monitored by measuring plasma anti-factor Xa activity. A plasma anti-factor Xa level of 0.2 U/ml or higher was considered as a therapeutic concentration based on previously published studies [10,11]. Enoxaparin formulated in saline without any PEIs failed to produce a plasma anti-factor level required for an antithrombotic effect in rats (Fig. 5 and Table 1). When enoxaparin formulated with 0.125% PEI-25 KDa was administered as a nose drop, no appreciable increase in plasma anti-factor Xa level was observed compared to the control (Fig. 5A). However, enoxaparin formulation containing 0.25% PEI-25 KDa produced a significant increase in the anti-factor Xa (Cmax) level (p <0.05). Interestingly, formulation containing 0.5% PEI-25 KDa plus enoxaparin caused a modest increase in anti-factor Xa level compared to the control although not compared to 0.25% PEI-25 KDa. Unlike LMWH formulations containing 0.125% PEI-25 KDa, formulations containing enoxaparin plus 0.125% PEI-750 KDa produced an increase in anti-factor Xa activity to a level required for an antithrombotic effect in rodents (Fig. 5B and Table 1). The AUC0-480 produced by 0.125% or 0.25% PEI-750 KDa was about 3-4-fold higher than that produced by the control formulation, although the difference between the anti-factor Xa levels produced by 0.125% PEI-750 KDa and 0.25% PEI-750 KDa was not statistically significant (p >0.05). Interestingly, AUC0-480 for the formulation containing 0.5% PEI-750 KDa was smaller than those for formulations containing 0.125% or 0.25% PEI-750 KDa (Table 1). Similar to the enoxaparin plus PEI-750 KDa formulations, the presence of 0.125% or 0.25% PEI-1000 KDa in the enoxaparin nasal formulation produced an increase in anti-factor Xa level, and the AUC0-480 was approximately 3-4-fold higher than the AUC0-480 for the enoxaparin control formulation (Fig. 5C and Table 1). However, like that of 0.5% PEI-750 KDa, when the concentration of PEI-1000 KDa in the formulation was 0.5%, there was a decrease in AUC0-480 compared to formulations that contained 0.125% or 0.25% PEI-1000 KDa (Table 1). Nevertheless, the difference between AUC0-480 produced by 0.5% PEI-1000 KDa and that produced by the control formulation was statistically significant (p <0.05). However, as discussed below, a concentration-dependent increase in enoxaparin absorption, unlike previous studies with nonionic surfactants [10,11], was not observed for formulations containing enoxaparin and PEI. Furthermore, for all formulations containing PEIs, with the exception of 0.125% PEI- 25 KDa, relative or absolute bioavailability values were higher than those produced by the control formulation (p <0.05) (Table 1). The maximum increase in bioavailability was observed when the drug was formulated with 0.25% of either PEI-750 KDa or PEI-1000 KDa. Overall, the data presented in Fig. 5 and Table 1 demonstrate that PEI was efficacious as a carrier in enhancing nasal absorption of enoxaparin, and enoxaparin absorbed via the nasal route was able to increase the anti-factor Xa level. This study is the first to document that PEI, a positively charged polymer, enhances nasal absorption of a negatively charged drug, enoxaparin.
Figure 5.
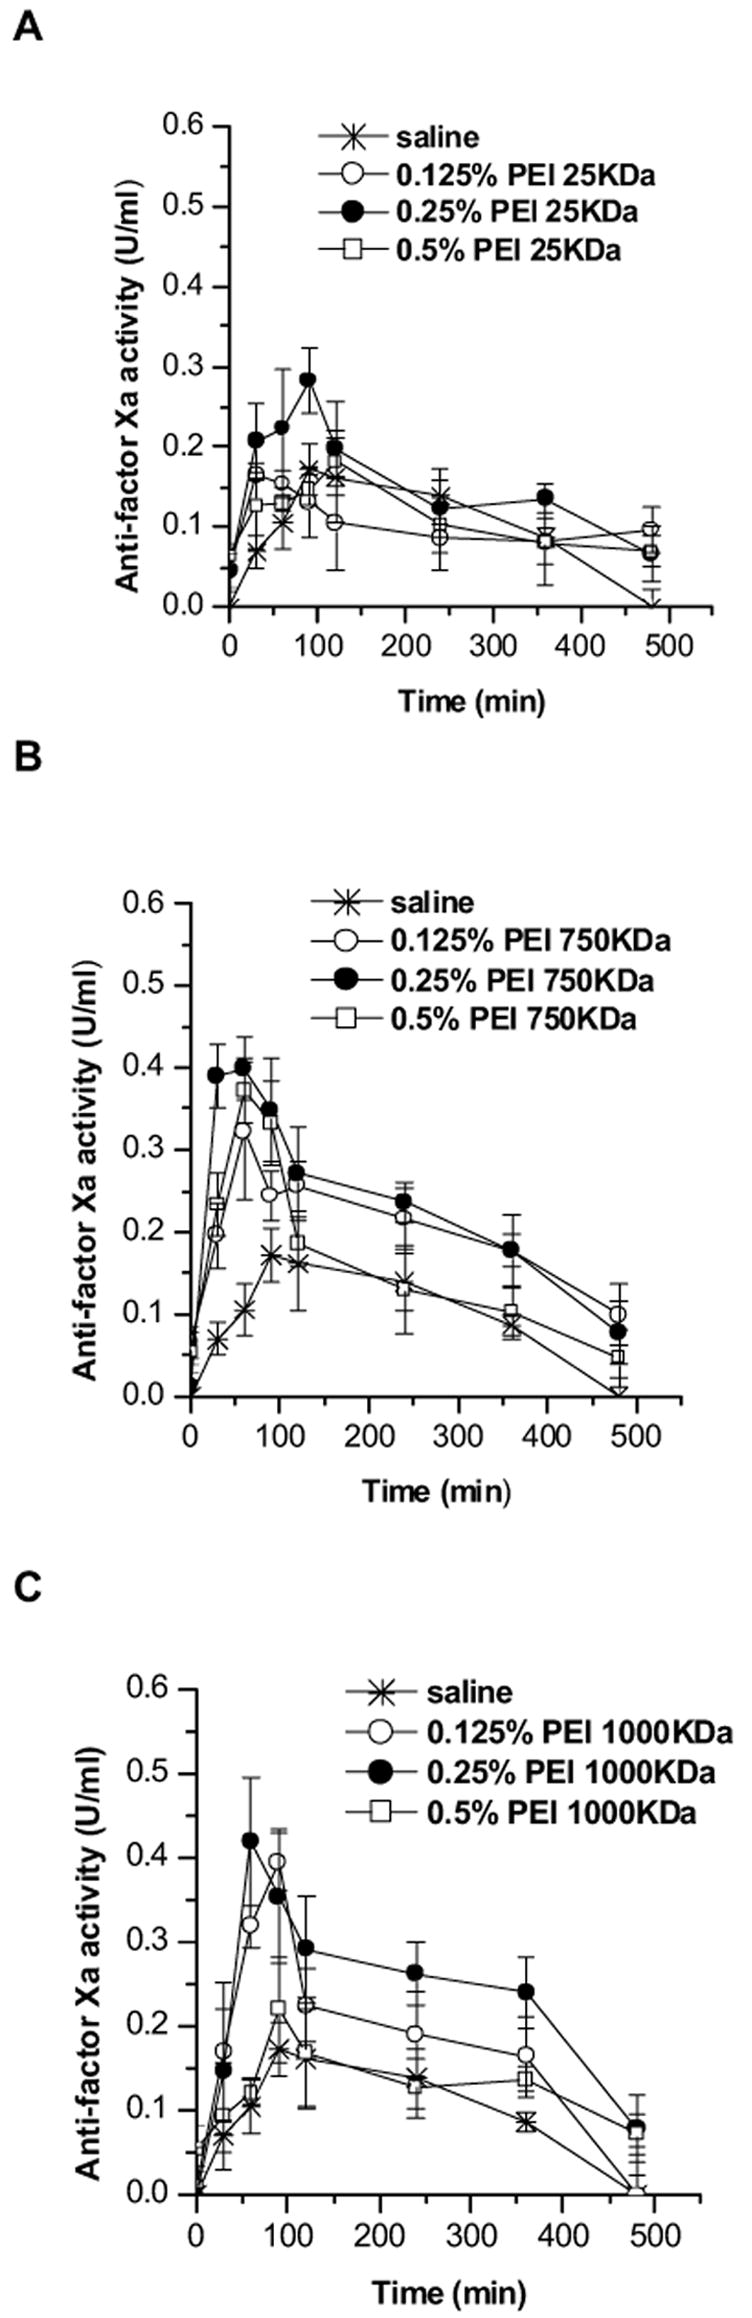
Changes in anti-factor Xa activity after nasal administration of enoxaparin formulated in saline or in the presence of different concentrations of (A) PEI-25KDa, (B) PEI-750KDa, or (C) PEI-1000KDa. Data represent mean ± SEM, n=3–5.
Table 1.
Pharmacokinetic parameters for subcutaneous, intravenous and intranasal delivery (330 U/kg) of formulations containing enoxaparin in saline or various concentrations of PEI. Data represent mean ± SEM, n = 3–5.
| Formulations | Cmax (U/ml) | Tmax (min) | AUC0→480 (U·min/ml) | Fabsolute (%) | Frelative (%) |
|---|---|---|---|---|---|
| No PEI | 0.15 ± 0.02 | 66 ± 15 | 32.6 ± 5.1 | 6.7 ± 1.0 | 6.9 ± 1.1 |
|
| |||||
| 0.125% PEI-25KDa | 0.18 ± 0.02 | 50 ± 20 | 48 ± 4 | 9.8 ± 0.7 | 10.2 ± 0.8 |
| 0.25% PEI-25KDa | 0.32 ± 0.02* | 90 ± 17 | 72 ± 6* | 17.2 ± 1.6* | 17.9 ± 1.2* |
| 0.5% PEI-25KDa | 0.20 ± 0.02 | 60 ± 30 | 53 ± 4* | 10.8 ± 0.7* | 11.2 ± 0.8* |
|
| |||||
| 0.125% PEI-750KDa | 0.38 ± 0.04* | 80 ± 20 | 98 ± 7* | 20.0 ± 1.4* | 20.8 ± 1.4* |
| 0.25% PEI-750KDa | 0.42 ± 0.03* | 50 ± 10 | 109 ± 18* | 24.9 ± 3.7* | 25.9 ± 1.8* |
| 0.5% PEI-750KDa | 0.38 ± 0.04* | 70 ± 10 | 70 ± 3* | 14.4 ± 0.7* | 15.0 ± 1.7* |
|
| |||||
| 0.125% PEI-1000KDa | 0.40 ± 0.03* | 80 ± 10 | 78 ± 14* | 16.1 ± 2.8* | 16.7 ± 3.0* |
| 0.25% PEI-1000KDa | 0.42 ± 0.07* | 70 ± 10 | 115 ± 18* | 25.7 ± 3.7* | 26.8 ± 3.9* |
| 0.5% PEI-1000KDa | 0.22 ± 0.06 | 100 ± 30 | 60 ± 11* | 12.3 ± 2.2* | 12.8 ± 2.3* |
|
| |||||
| Subcutaneous | 1.31 ± 0.01 | 200 ± 80 | 470 ± 27 | 96.1 ± 0.1 | - |
|
| |||||
| Intravenous | 3.68 ± 0.01 | 0 | 489 ± 37 | - | - |
Results are significantly different from those obtained without enhancer, p<0.05.
However, some aspects of the data presented above require further discussion and explanation: (i) lack of a concentration-dependent increase in absorption, and (ii) the mechanisms that lead to increased absorption of LMWH-complex. There are two plausible explanations for the lack of a concentration-dependent effect of PEI in increasing nasal absorption of LMWH. First, self-aggregation of PEIs could be occurring. At higher polymer concentrations, self-aggregation is more likely and it would produce larger particles that may form poor contacts with the cell surface and/or be inefficiently endocytosed. As a result, a decrease in drug absorption is likely to occur. However, it is not known how a self-aggregation phenomenon may occur between hydrophilic polymeric molecules. Another hypothesis for the lack of concentration-dependent increase could be that an optimized ratio of the nitrogen of PEI to the electronegative groups of LMWH is required to produce a maximum increase in drug absorption. Previous studies on PEI-mediated gene delivery suggest that the transfection efficiency of PEI-DNA complex depends on various properties of the complex, including its size and the nitrogen-to-phosphate charge ratio [16]. A discrepancy at higher nitrogen-to-phosphate ratios has been observed and it has been attributed to an excess of unbound cationic polymer that inhibits transfection by competing for binding sites on cell surface proteoglycans [21]. It is therefore reasonable to assume that maximum drug absorption occurs at an optimal nitrogen-to-electronegative-group ratio in the PEI-LMWH complex.
The mechanism by which PEI enhances LMWH absorption is not known. Based on the data in Figs. 3 and 4, we hypothesize that PEI enhances nasal absorption of LMWH by reducing the molecule’s negative surface charge and increasing its permeability across the cell membrane. The coulombic repulsion effect generated between the negatively charged cell membrane and the negatively charged drug perhaps contributes in part to the poor absorbability of LMWH (in the absence of PEI) from the nasal epithelium. Charge neutralization by PEI may weaken or diminish the coulombic repulsion effect and consequently increase drug absorption across the epithelium. These assumptions are consistent with the data obtained in the FTIR, conductivity, zeta potential and azure A studies. However, zeta potential, conductivity and azure A data suggest that, although charge neutralization has perhaps occurred upon addition of PEI to LMWH, the drug was not electrostatically neutral. Furthermore, the data do not suggest a linear relationship between the extent of charge neutralization and increase in absorption.
An alternative hypothesis is that upon administration of the formulations, aggregates of PEI-LMWH complex break into small aggregates or individual PEI-LMWH complexes. PEI perhaps competitively binds with the negatively charged molecules of the cell surface and subsequently releases the drug for endocytosis [21]. An analogous mechanism is widely believed to underlie PEI-enhanced DNA transfection [16]. However, it is important to know the fate of PEI once the drug is released from the complex. Since PEI is a very water-soluble polymer, it is likely to be depolymerized and eliminated from the body as ethylenimine. Further studies are required to investigate the metabolism and elimination of PEI.
Nevertheless, the hypothesis that PEI increases drug absorption by increasing paracellular permeability cannot be ruled out. It is also possible that a population of PEI molelcules remains uncomplexed and that this facilitates absorption of both free drug and drug-PEI complex. In fact, it has been shown that cationic polymers such as polyarginine enhance nasal absorption of a hydrophilic model drug by acting on the tight junctional protein ZO-1 [8,22]. But the mechanism by which polyarginine increases paracellular permeability may not hold true for PEI because polyarginine and PEI belong to two completely different families of cationic polymers. Therefore, the data presented in this study do not rule in or rule out any mechanisms, and further studies are required to define the mechanisms by which PEI increases nasal absorption of LMWH.
3.6. Enoxaparin Degradation Studies in Rat Nasal Homogenates
The data for the metabolic stability study, presented in Table 2, show no differences between the anti-factor Xa activities for enoxaparin incubated in rat nasal mucosal extracts versus saline. Therefore, it appears that enoxaparin did not undergo metabolic degradation or depolymerization. In other words, neither the stability nor the biological activity of LMWH was affected by the extra- and intracellular enzymatic activity of the nasal mucosa. It is important to point out that the polysaccharide chains of LMWH are critical for maintaining anti-factor Xa and anti-clotting activity [23]. Furthermore, a degraded form of LMWH was used as a positive control for this study. When LMWH was incubated with 0.5 M NaOH for 2 hours, the anti-factor Xa activity of LMWH was reduced from 50 U/ml to 28.1 U/ml (Table 2). However, no degradation was observed when the drug was incubated in nasal homogenates for 2 hours. These data agree with our previous studies on the metabolic stability of LMWH in bronchial epithelial cell extracts, where no degradation of enoxaparin was observed [10]. In gastric acid, however, the polysaccharide chain of LMWH undergoes degradation, and a portion of orally administered heparin is degraded in the liver by heparinase, which makes both compounds unsuitable for oral delivery. Since no such degradation was observed after incubation in rat nasal homogenates, LMWH is likely to be absorbed in its biologically active form after nasal administration.
Table 2.
Anti-factor Xa activity of enoxaparin incubated in rat nasal mucosal homogenates or saline or NaOH for 2 hours. Data represent mean ± SEM, n=3.
| Initial enoxaparin concentration (U/ml) | Final enoxaparin concentration (U/ml) | |
|---|---|---|
| In nasal homogenates | In saline | |
| 500 | 514 ± 9.24 | 506 ± 6.93 |
| 50 | 51.2 ± 1.04 | 50.9 ± 1.96 |
| 5 | 5.1 ± 0.11 | 5.3 ± 0.06 |
| 0.5 | 0.51 ± 0.01 | 0.52 ± 0.02 |
| 50* | - | 28.1 ± 0.79* |
This sample was incubated in 0.5M NaOH
Taken together, this study is the first to document that PEIs might be used as carriers for a nasally administered, negatively charged drug substance, LMWH. The efficacy of PEIs in enhancing nasal absorption of LMWH can be ranked as PEI-1000 KDa ≥ PEI-750 KDa > PEI-25 KDa. PEIs enhance LMWH absorption perhaps by reducing negative surface charges via complexation with the anionic functional groups of LMWH and/or by increasing paracellular permeability, in addition to the widely accepted mechanism of cellular internalization. However, further studies are required to delineate the mechanisms by which PEI increases absorption of LMWH and to establish the safety of the proposed PEI-LMWH formulation for nasal delivery in humans.
Acknowledgments
This work was supported in part by a New Investigator Award, 0265182Y (FA) from the American Heart Association (Texas Affiliate) and an NIH grant R15 HL7713301 (FA).
Footnotes
Publisher's Disclaimer: This is a PDF file of an unedited manuscript that has been accepted for publication. As a service to our customers we are providing this early version of the manuscript. The manuscript will undergo copyediting, typesetting, and review of the resulting proof before it is published in its final citable form. Please note that during the production process errors may be discovered which could affect the content, and all legal disclaimers that apply to the journal pertain.
References
- 1. [Accesssed on July 2006, ];Polyethylemine and ethylenimine, Chemical Safety Information from Intergovernmental Organizations Document, 12-13-05. http://www.inchem.org/documents/jecfa/jecmono/v20je08.htm.
- 2.Godbey WT, Wu KK, Mikos AG. Poly(ethylenimine) and its role in gene delivery. J Control Release. 1999;60:149–160. doi: 10.1016/s0168-3659(99)00090-5. [DOI] [PubMed] [Google Scholar]
- 3.Kircheis R, Wightman L, Wagner E. Design and gene delivery activity of modified polyethylenimines. Adv Drug Deliv Rev. 2001;53:341–358. doi: 10.1016/s0169-409x(01)00202-2. [DOI] [PubMed] [Google Scholar]
- 4.Gordbey WT, Mikos AG. Recent progress in gene delivery using non-viral transfer complexes. J Control Release. 2001;72:115–125. doi: 10.1016/s0168-3659(01)00267-x. [DOI] [PubMed] [Google Scholar]
- 5.Prego C, Garcia M, Torres D, Alonso MJ. Transmucosal macromolecular drug delivery. J Control Release. 2005;101:151–162. doi: 10.1016/j.jconrel.2004.07.030. [DOI] [PubMed] [Google Scholar]
- 6.Hammes M, Singh A. Effect of polycations on permeability of glomerular epithelial cell monolayers to albumin. J Lab Clin Med. 1994;123:437–446. [PubMed] [Google Scholar]
- 7.Vogel V, Lochmann D, Weyermann J, Mayer G, Tziatzios C, Broek van den JA, Haase W, Wouters D, Schubert US, Kreuter J, Zimmer A, Schubert D. Oligonucleotide-protamine-albumin nanoparticles: preparation, physical properties, and intracellular distribution. J Control Release. 2005;103:99–111. doi: 10.1016/j.jconrel.2004.11.029. [DOI] [PubMed] [Google Scholar]
- 8.Ohtake K, Maeno T, Ueda H, Natsume H, Morimoto Y. Poly-L-arginine predominantly increases the paracellular permeability of hydrophilic macromolecules across rabbit nasal epithelium in vitro. Pharm Res. 2003;20:153–160. doi: 10.1023/a:1022485816755. [DOI] [PubMed] [Google Scholar]
- 9.Lee YK, Kim SK, Lee DY, Lee S, Kim CY, Shin HC, Moon HT, Byun Y. Efficacy of orally active chemical conjugate of low molecular weight heparin and deoxycholic acid in rats, mice and monkeys. J Control Release. 2006;111:290–298. doi: 10.1016/j.jconrel.2005.12.011. [DOI] [PubMed] [Google Scholar]
- 10.Yang T, Mustafa F, Ahsan F. Alkanoylsucroses in nasal delivery of low molecular weight heparins: in-vivo absorption and reversibility studies in rats. J Pharm Pharmacol. 2004;56:53–60. doi: 10.1211/0022357022377. [DOI] [PubMed] [Google Scholar]
- 11.Yang T, Mustafa F, Bai S, Ahsan F. Pulmonary delivery of low molecular weight heparins. Pharm Res. 2004;21:2009–2016. doi: 10.1023/b:pham.0000048191.69098.d6. [DOI] [PubMed] [Google Scholar]
- 12.Cadene M, Boudier C, de Marcillac GD, Bieth JG. Influence of low molecular mass heparin on the kinetics of neutrophil elastase inhibition by mucus proteinase inhibitor. J Biol Chem. 1995;270:13204–13209. doi: 10.1074/jbc.270.22.13204. [DOI] [PubMed] [Google Scholar]
- 13.Hayakawa E, Yamamoto A, Shoji Y, Lee VH. Effect of sodium glycocholate and polyoxyethylene-9-lauryl ether on the hydrolysis of varying concentrations of insulin in the nasal homogenates of the albino rabbit. Life Sci. 1989;45:167–174. doi: 10.1016/0024-3205(89)90291-9. [DOI] [PubMed] [Google Scholar]
- 14.Stuart B. Infrared Spectroscopy: fundamentals and applications. John Wiley and Sons, Ltd; Chichester, England: 2004. [Google Scholar]
- 15.Longas MO, Breitweiser KO. Sulfate composition of glycosaminoglycans determined by infrared spectroscopy. Anal Biochem. 1991;192:193–196. doi: 10.1016/0003-2697(91)90205-8. [DOI] [PubMed] [Google Scholar]
- 16.Choosakoonkriang S, Lobo BA, Koe GS, Koe JG, Middaugh CR. Biophysical characterization of PEI/DNA complexes. J Pharm Sci. 2003;92:1710–1722. doi: 10.1002/jps.10437. [DOI] [PubMed] [Google Scholar]
- 17.Ogris M, Steinlein P, Kursa M, Mechtler K, Kircheis R, Wagner E. The size of DNA/transferrin-PEI complexes is an important factor for gene expression in cultured cells. Gene Ther. 1998;5:1425–1433. doi: 10.1038/sj.gt.3300745. [DOI] [PubMed] [Google Scholar]
- 18.Vila A, Sanchez A, Evora C, Soriano I, McCallion O, Alonso MJ. PLA-PEG particles as nasal protein carriers: the influence of the particle size. Int J Pharm. 2005;292:43–52. doi: 10.1016/j.ijpharm.2004.09.002. [DOI] [PubMed] [Google Scholar]
- 19.Gundry SR, Klein MD, Drongowski RA, Kirsh MM. Clinical evaluation of a new rapid heparin assay using the dye azure A. Am J Surg. 1984;148:191–194. doi: 10.1016/0002-9610(84)90219-8. [DOI] [PubMed] [Google Scholar]
- 20.Moret I, Esteban Peris J, Guillem VM, Benet M, Revert F, Dasi F, Crespo A, Alino SF. Stability of PEI-DNA and DOTAP-DNA complexes: effect of alkaline pH, heparin and serum. J Control Release. 2001;76:169–181. doi: 10.1016/s0168-3659(01)00415-1. [DOI] [PubMed] [Google Scholar]
- 21.Wiethoff CM, Smith JG, Koe GS, Middaugh CR. The potential role of proteoglycans in cationic lipid-mediated gene delivery. Studies of the interaction of cationic lipid-DNA complexes with model glycosaminoglycans. J Biol Chem. 2001;276:32806–32813. doi: 10.1074/jbc.M007940200. [DOI] [PubMed] [Google Scholar]
- 22.Ohtake K, Maeno T, Ueda H, Ogihara M, Natsume H, Morimoto Y. Poly-L-arginine enhances paracellular permeability via serine/threonine phosphorylation of ZO-1 and tyrosine dephosphorylation of occludin in rabbit nasal epithelium. Pharm Res. 2003;11:1838–1845. doi: 10.1023/b:pham.0000003383.86238.d1. [DOI] [PubMed] [Google Scholar]
- 23.Lane D, Lindhal U. Heparin: Chemical and biological properties, clinical applications. CRC Press; Boca Raton, FL: 1989. [Google Scholar]