Abstract
The structure of the UDP-glucose pyrophosphorylase encoded by Arabidopsis thaliana gene At3g03250 has been solved to a nominal resolution of 1.86 Å. In addition, the structure has been solved in the presence of the substrates/products UTP and UDP-glucose to nominal resolutions of 1.64 Å and 1.85 Å. The three structures revealed a catalytic domain similar to that of other nucleotidyl-glucose pyrophosphorylases with a carboxy-terminal β-helix domain in a unique orientation. Conformational changes are observed between the native and substrate-bound complexes. The nucleotide binding loop and the carboxy-terminal domain, including the suspected catalytically important Lys360, move in and out of the active site in a concerted fashion. TLS refinement was employed to initially model conformational heterogeneity in the UDP-glucose complex followed by the use of multiconformer refinement for the entire molecule. Normal mode analysis generated atomic displacement predictions in good agreement in magnitude and direction with the observed conformational changes and anisotropic displacement parameters generated by TLS refinement. The structures and the observed dynamic changes provide insight into the ordered mechanism of this enzyme and previously described oligomerization effects on catalytic activity.
Introduction
The enzyme UDP-glucose pyrophosphorylase (UDPGP) is listed under the enzyme classification number EC2.7.7.9 and is a member of the Pfam glycosyl transferase clan (PF01702)1. The enzyme carries out the reaction Mg2+-UTP + glucose-1-P ⇆ PPi + UDP-glucose2. The order of binding is specific with UTP binding the enzyme before glucose-1-P and UDP-glucose binding before PPi in the reverse reaction3,4. The reaction direction shows tissue-specific variations. The reaction has been shown to proceed in the direction of UDP-glucose formation in young and mature leaves and in the opposite direction in immature apical leaves5. UDP-glucose is an important precursor for sucrose and various cell wall materials in plants6-9. In cereal seed endosperm UDP-glucose concentration is coupled to that of ADP-glucose which is a precursor of starch in plants10. UDP-glucose has also been observed to act as a direct precursor of starch under certain conditions11,12.
Two isozymes of UDPGP encoded by genes At3g03250 and At5g17310 have been identified in Arabidopsis thaliana5. UDPGP activity has been experimentally verified for the protein product of gene At3g03250 purified from Arabidopsis extracts. The sequence of the At3g03250 UDPGP can be found under Uniprot ID Q9M9P33.
The expression of gene At3g03250 is known to be regulated by light as well as phosphate and sucrose concentration13-15. In addition, in vitro oligomerization of UDPGP has been shown to influence the activity of this enzyme; the most active form being the monomer16. However, the oligomerization depends on the storage buffer conditions17, and the biological significance of this regulation remains uncertain.
Here we present three crystal structures of the UDP-glucose pyrophosphorylase encoded by gene At3g03250: the native enzyme, a complex with UDP-glucose, and a complex with UTP. The structures were determined under the National Institutes of Health Protein Structure Initiative.
Results
Structure determination
The crystallographic statistics related to the structure determination of UDPGP and its complexes with UDP-glucose and UTP are listed in Table 1. The asymmetric unit contains two protein chains labeled A and B. Several surface loops and residues were not modeled due to insufficient electron density. These include residues A1–A5, A40–A43, B1–B7, B38–B43, and B469 in the native structure; residues A1–A7, A40–A44, A255, A266, B1–B7, B40, B41, and B252 in the UTP complex; and residues A1–A4, A38–A43, A467–A469 and B1–B6 in models 1 and 2 of the UDP-glucose bound structure. As described in the Material and Methods section, two alternate conformer models were required to fully account for the electron density observed in the UDP-glucose complex crystal structure.
Table 1.
Summary of crystallographic data-collection and refinement statistics. Values in parentheses refer to the highest resolution shell.
| Data set | Unliganded | Unliganded | UDP-Glucose | UTP |
|---|---|---|---|---|
| Native | Peak | |||
| Data collection | ||||
| Wavelength (Å) | 0.99997 | 0.97924 | 0.97911 | 1.5418 |
| Resolution range (Å) | 37.37-1.86 | 37.37-1.95 | 38.25-1.64 | 70.48-1.85 |
| (1.90-1.86) | (2.00-1.95) | (1.68-1.64) | (1.90-1.85) | |
| Space group | C2 | C2 | C2 | C2 |
| Unit-cell parameters | ||||
| a (Å) | 188.7 | 188.0 | 187.7 | |
| b (Å) | 58.9 | 59.6 | 59.7 | |
| c (Å) | 89.9 | 89.9 | 89.8 | |
| β (°) | 100.4 | 100.3 | 100.4 | |
| Measured/Unique reflections | 552898 / 79505 | 536478 / 72439 | 512561 / 118994 | 1247882 / 83235 |
| Completeness (%) | 98.0 (89.5) | 99.9 (99.9) | 98.8 (83.1) | 99.4 (100.0) |
| Rmergea | 0.066 (0.395) | 0.079 (0.334) | 0.042 (0.295) | 0.035 (0.312) |
| Average I/σ | 17.4 (3.22) | 17.4(3.2) | 16.7 (3.89) | 23.9 (3.2) |
| Redundancy | 7.0 (5.1) | 7.4 (6.4) | 4.3 (3.3) | 14.3 (5.1) |
| Phasing | ||||
| MR Correlation Coefficient | 0.229 | 0.262 | ||
| Mean FOM from CNS | 0.3295 (0.2796) | |||
| Refinement statistics | ||||
| Rcrystb/Rfreec (%) | 20.1 / 24.9 | 18.5 / 22.5 | 19.2 / 23.9 | |
| Ramachandran plot | ||||
| Most favourable regions (%) | 91.4 | 96.1 | 91.6 | |
| Allowed regions (%) | 8.6 | 3.9 | 8.4 | |
| Disallowed regions (%) | 0.0 | 0.0 | 0.0 | |
| R.m.s. deviations from ideality | ||||
| Bonds (Å) | 0.017 | 0.0192 | 0.016 | |
| Angles (Å) | 1.607 | 1.959 | 1.902 | |
| PDB ID Code | 1z90 | 2icy | 2icx |
Rmerge = ∑h∑i|Ii(h) - <I(h)>|/ ∑h∑iIi(h), where Ii(h) is the intensity of an individual measurement of the reflection and <I(h)> is the mean intensity of the reflection.
Rcryst = ∑h||Fobs|-|Fcalc||/∑h|Fobs|, where Fobs and Fcalc are the observed and calculated structure-factor amplitudes, respectively.
Rfree was calculated as Rcryst using 5.0% of the randomly selected unique reflections that were omitted from structure refinement.
All of the residues were in most favored or allowed regions of the Ramachandran plot. Heteroatoms modeled into each structure include 422 water molecules in the native enzyme; 871 water molecules, 1 molecule of dimethylsulfoxide, and 2 molecules of UTP in the UTP complex; and 1100 water molecules, 1 molecule of dimethylsulfoxide, 1 molecule of UMP, and 2 molecules of UDP-glucose shared among the two multiple conformers in the UDP-glucose complex.
Protein fold
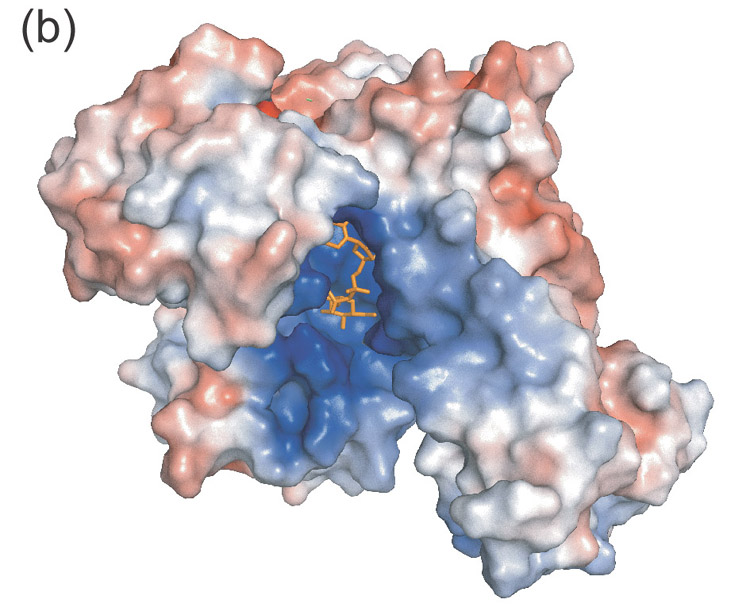
The overall fold of UDPGP is shown in Figure 1(a) and Figure 2 illustrates the residue numbering. The 469 residues of the UDPGP enzyme form four structural domains. The largest domain contains residues 56–160, 193–249, 291–317, and 334–359. This central domain (blue) contains an eight-stranded mixed β-sheet that forms the core of the protein. The central β-sheet is surrounded on both sides by helices and branches off into a small two-stranded β-sheet. In addition, there are three smaller domains that project out from the central domain forming a positively-charged active site cavity (Figure 1(b)). The largest of these is the carboxy-terminal domain (red), which contains residues 360–469. This domain primarily consists of a β-helix formed by two parallel β-sheets, a few helices, and a two-stranded β-sheet. The amino-terminal domain (magenta), consisting of residues 6–40, 161–192, and 318–333, and the sugar-binding domain (green), consisting of residues 41–55 and 250–290, are primarily helical but each contains two β-strands that make up a four-stranded, antiparallel β-sheet. The active site is located at the interface of these four domains in a pocket with distinct positive electrostatic surface potential.
Figure 1.
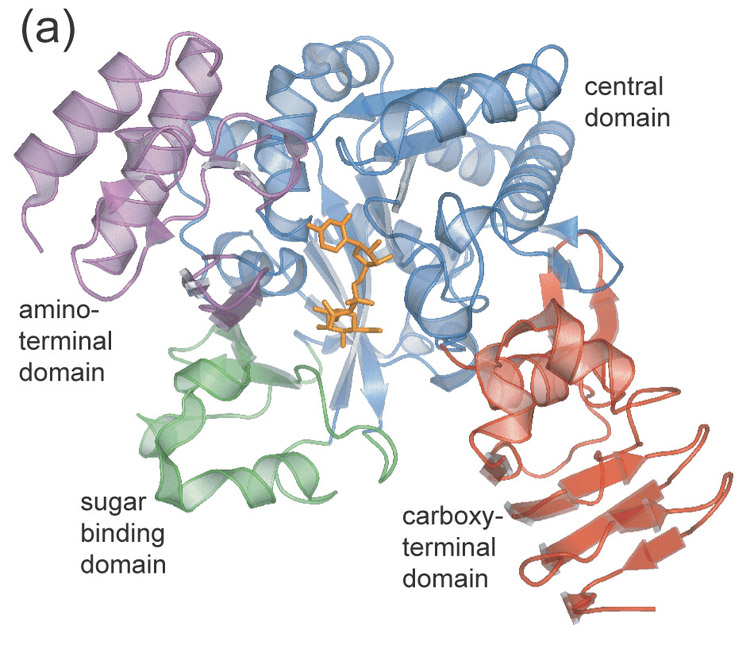
- Ribbon diagram of UDPGP monomer. Domains are color coded as follows: central domain (blue), carboxy-terminal domain (red), amino-terminal domain (magenta), sugar binding domain (green).
- Electrostatic surface diagram illustrating the positively charged substrate cavity.
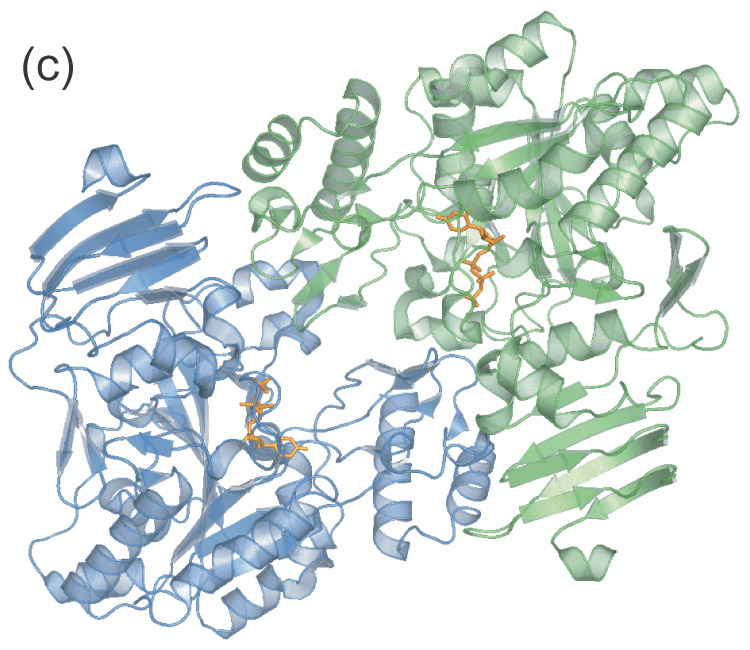
- Apparent UDPGP dimer. The amino-terminal domain of each monomer resides near the active site of the other respective monomer.
Figure 2.
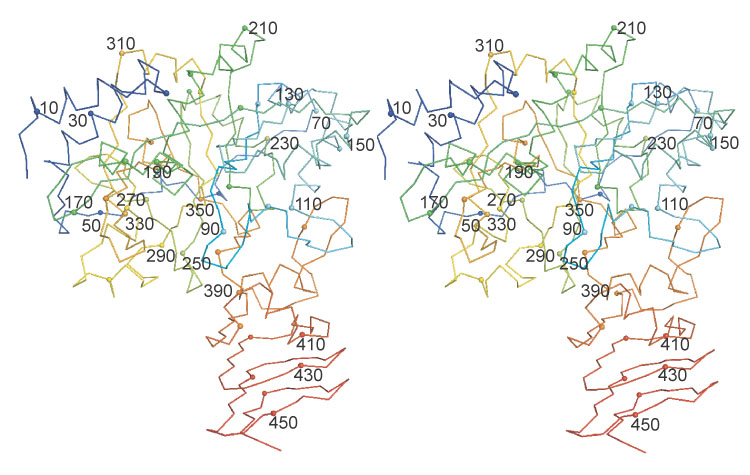
Residue numbering throughout UDPGP. The ribbon color corresponds to the residue number starting with blue for the amino-terminal and ending in red for the carboxy-terminal. Every tenth alpha carbon is shown as a sphere.
Oligomerization state
Gel filtration chromatography conducted prior to protein concentration indicated that the UDPGP enzyme existed as a monomer in solution. However, the crystal structure revealed the presence of an apparent dimer (Figure 1(c)). The interface between the monomers is small with a buried surface area of only 600 Å2. The orientation of the monomers in the apparent dimer is such that the amino-terminal domain of each monomer is wedged into the active site area of the other respective monomer. The residues involved in this interaction include residues 170–182, 256, 320–328, 395–402, and 446 of both chains, as well as residues 5 and 6 of chain A and residues 91, 92, 280–284, and 423–426 of chain B. Analysis of the distances between polar atoms within the interface suggest that hydrogen bonds exist between residues Lys 401 and Asp325 of both chains as well as between Thr5 of chain A and Lys284 of chain B and between Asp171 of chain A and Lys 256 of chain B.
Active site of the UDP-glucose complex
The residues that coordinate UDP-glucose vary slightly with each protein chain. Chain A of model 2 appears to most optimally bind UDP-glucose, and the following active site description is derived from this subunit (Figure 3(a)). Residues from the amino-terminal domain that bind UDP-glucose include Gln162 and Gly191, which coordinate the uridinyl group, and His192, which coordinates the β-phosphate. Residues from the central domain that coordinate UDP-glucose include Asn220 and Asn293, which coordinate the glucose portion of the molecule; Gly87, which coordinates the uridyl group; Leu85, which coordinates the ribose group; and Lys99, which coordinates the α-phosphate. Gly87, Leu85, and Lys99 are found on a region of the enzyme referred to as the nucleotide binding loop (Figure 4) in other pyrophosphorylases. Residues in the sugar binding domain that coordinate UDP-glucose include Gly258 and Glu271, which coordinate the glucose portion of the substrate and Lys256, which coordinates the β-phosphate. Lys360 is the sole residue from the carboxy-terminal domain that makes contacts with UDP-glucose, specifically at the α-phosphate. The other chains of the multiconformer model contain a smaller subset of these residues that coordinate the UDP-glucose. Chain A of model 1 resembles the native structure and subsequently makes the fewest contacts with UDP-glucose. These contacts are mediated through residues Gln162, Gly191, Asn293, and Asn220, all of which come from the amino-terminal and central domains. The electron density for chain B revealed the partial presence of a molecule of UMP in the active site in addition to UDP-glucose. Subsequently UDP-glucose was incorporated into the alternate conformer represented by model 1 and UMP was incorporated into the alternate conformer represented by model 2 as shown in Table 2.
Figure 3.
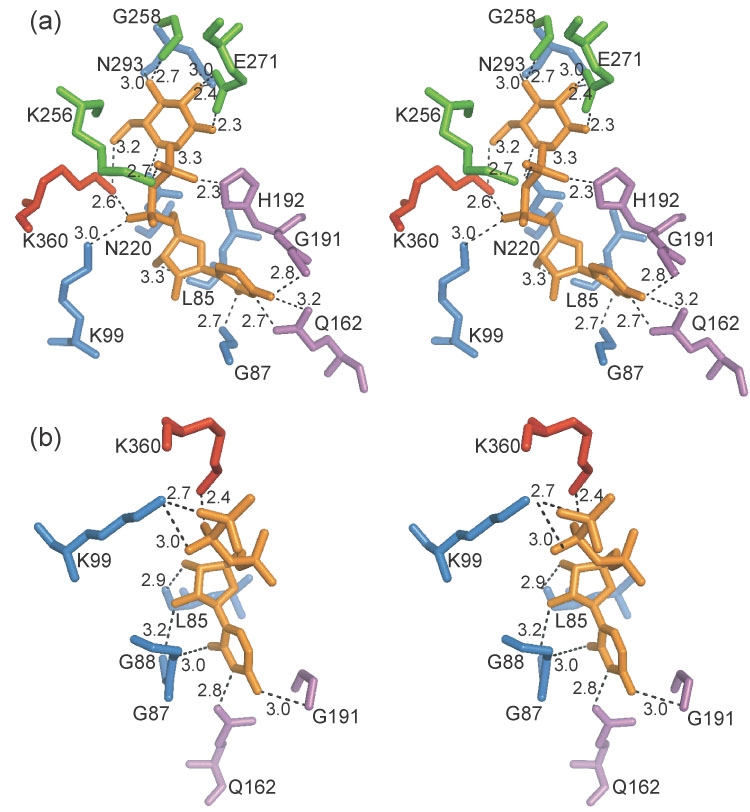
- UDP-glucose complex (2icy).
- UTP complex (2icx).
Figure 4.
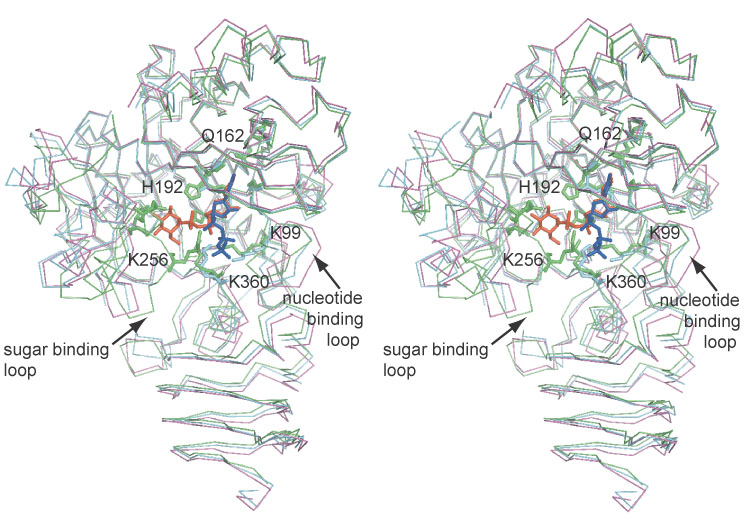
Overlay of the native (magenta), UTP complex (cyan), and the UDP-glucose complex (green). The open and closed forms of the sugar binding and nucleotide binding loops are illustrated and the residues shown in Figure 3 are displayed as stick models. UDP-glucose and UTP are shown as orange and blue stick models respectively.
Table 2.
Components of the UDP-glucose multiconformer model (pdb 2icy)
| UDP-Glucose Complex |
Model 1 | Model 2 | ||
|---|---|---|---|---|
| Chain ID | Chain A | Chain B | Chain A | Chain B |
| Ligand | UDP-glucose | UDP-glucose | UDP-glucose | UMP |
Conformational changes were observed between the native structure and UDP-glucose complex (Figure 4). The nucleotide binding loop, Gly87–Lys99, clamps down on the nucleotide portion of the substrate. This displacement is propagated throughout the carboxy-terminal domain such that the entire β-helix is displaced towards the substrate. The second conformational change involves the sugar binding loop, Thr248–Ile261, that closes down on the sugar and phosphate portion of the substrate. This also resulted in a displacement of the sugar binding domain.
Active site of the UTP complex
The residues that coordinate UTP are illustrated in Figure 3(b). Coordination of the uridine moiety is analogous to that seen in the UDP-glucose complex. The phosphate portion is coordinated by Lys360 and Lys99. The β-phosphate is positioned differently in the UTP complex than in UDP-glucose complex such that His192 is no longer involved in the binding (Figure 4). The sugar binding loop (Thr248–Ile261) is positioned similarly to that of the native structure such that Lys256 is pulled away from the substrate. The temperature factors in this region are elevated in chains A and B compared to the surrounding residues. In chain A the electron density was insufficient to model in residues Val255 and Lys256, however, placement of the rest of the sugar binding loop was still possible. This strongly suggests increased structural flexibility in the sugar binding loop in the UTP complex compared to that of the native structure and UDP-glucose complex. A second distinction between the two monomers in the asymmetric unit is within the nucleotide binding loop (residues 87–99). This loop was in the closed conformation in chain B but in the open conformation in chain A, which caused a slight change in the orientation of the phosphates between chains A and B.
Normal mode analysis
Normal mode analysis was performed on the Arabidopsis UDPGP to predict large-scale domain movements. It has previously been shown that the low-frequency, large domain movements predicted from normal modes correlate to experimentally observed domain motions in proteins18,19. The first lowest frequency mode clearly shows significant movement of the carboxy-terminal domain, relative to the rest of the molecule, directed towards the enzyme active site (Figure 5(a)). This mode overlaps well with the observed conformational change in Chain A, with a dot product of 0.46 for the entire structure and 0.66 for the carboxy-terminal domain. The displacement magnitudes calculated by the Distance Network Model for the first one hundred modes had a 0.57 correlation to the experimental isotropic temperature factors, consistent with the range of correlations observed in large scale comparisons of flexibility predicted by normal mode models with crystallographic data20 (Kondrashov et al., submitted). Figure 5(b) shows good agreement between the normal mode displacement magnitudes, the isotropic temperature factors and the displacement parameters generated by TLS refinement of the UDP-glucose complex structure. We also computed anisotropic displacement parameters from the one hundred lowest frequency normal modes and computed dot products of the major axes with the atomic displacements observed between models 1 and 2 of the UDP-glucose complex, as well as with TLS displacement parameters. TLS-generated directions and the model displacement showed the closest agreement, with the average dot product of 0.84. Normal mode predictions also agreed with TLS and the model displacements, with average dot products of 0.69 and 0.66, respectively. Figure 5(c) illustrates the correlation in the conformational variation as predicted by normal mode analysis. The plot denotes residue interactions with high positive cross-correlation in red, and negative in blue. The highest correlations are seen along the diagonal and between residues in secondary structure elements, e.g. the β-strand interactions in the carboxy-terminal β-helix. The coupling between the nucleotide binding loop (87–99) and the carboxy-terminal domain, indicated by the observed conformational change, can be seen in a region of high correlation between residues 90–105 and 350–370.
Figure 5.
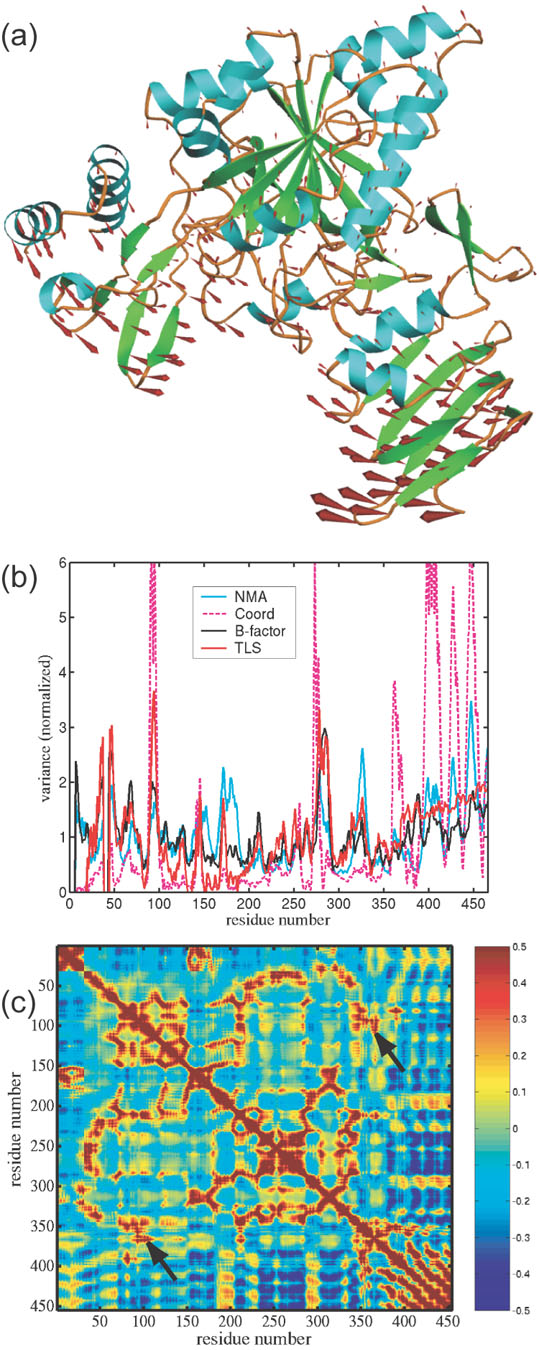
- Motion in the Arabidopsis UDPGP as predicted by normal mode analysis. Displacement vectors are represented by red arrows. Trajectories were obtained from model 1 chain A of the UDP-glucose complex (2icy).
- Plot of normalized positional variance for UDPGP from the B-factors in the final refinement (blue), TLS refinement (red), Normal Mode Analysis model (black) and observed atomic displacements (dashed magenta). The correlation coefficient is 0.76 between TLS and B-factors, 0.81 between TLS and NMA, 0.56 between NMA and B-factors, 0.58 between TLS and observed atomic displacements, and 0.34 between B-factors and observed atomic displacements.
- Matrix of correlations in positional deviation for UDPGP computed from 100 modes of NMA. Red indicates a positive correlation between residues, blue indicated anti-correlation, and green indicates lack of correlation. Arrows point to strong correlation between the nucleotide binding loop (residues 87–100) and residues around Lys360 of the carboxy-terminal domain.
Discussion
Multiconformer refinement
Refinement of multiconformers is routine for NMR structures, but it is rare for crystallography-derived structures. Some notable exceptions include structures of neurotrophin-3, glutamine synthetase, α-lytic protease, and calmodulin, all of which contained a number of conformationally distinct substates21-24. While some regions of the Arabidopsis UDPGP structure indicate atomic displacements of up to 5 Å, primarily around the carboxy-terminal domain, nucleotide binding loop, and sugar binding loop (Figure 4), most of the displacements between the alternate conformers were minor. Attempts to model only the regions with large displacements as multiconformers resulted in poorer refinement statistics as well as significantly increased positive Fo-Fc density along the mainchain electron density. Attempts to increase the number of alternate conformers did not significantly improve the refinement statistics, and it was decided that the complete two-conformer model was ultimately the most accurate and meaningful way to represent the enzyme structure. The regions of the model that displayed relatively minor atomic displacements between the two alternate conformers, are not meant to represent two entirely distinct static conformations of the protein, but rather a mixture of states that when viewed together best represent the average positions of the protein atoms.
Comparison to AGX1
Geisler et al. have generated homology models for UDP-glucose pyrophosphorylases from Arabidopsis, barley, and poplar based on the structure of human UDP-N-acetylglucosamine pyrophosphorylase (AGX1), which has 17% identity to that of the Arabidopsis UDPGP25. The crystal structures presented here show high structural similarity to AGX1 for the first 360 residues; however, substantial differences occur in the carboxy-terminal domain. Figure 6(a) illustrates the AGX1 dimer and a structural alignment between UDPGP and AGX1. In AGX1, the carboxy-terminus contains an extended loop that makes extensive contacts with the active site of its dimeric partner. This loop is not present in the Arabidopsis UDPGP and furthermore the carboxy-terminal α-helix domain directly occupies the space in which the other dimeric partner should reside (Figure 6(b)). Subsequently, oligomerization of UDPGP would have to occur elsewhere on the protein surface.
Figure 6.
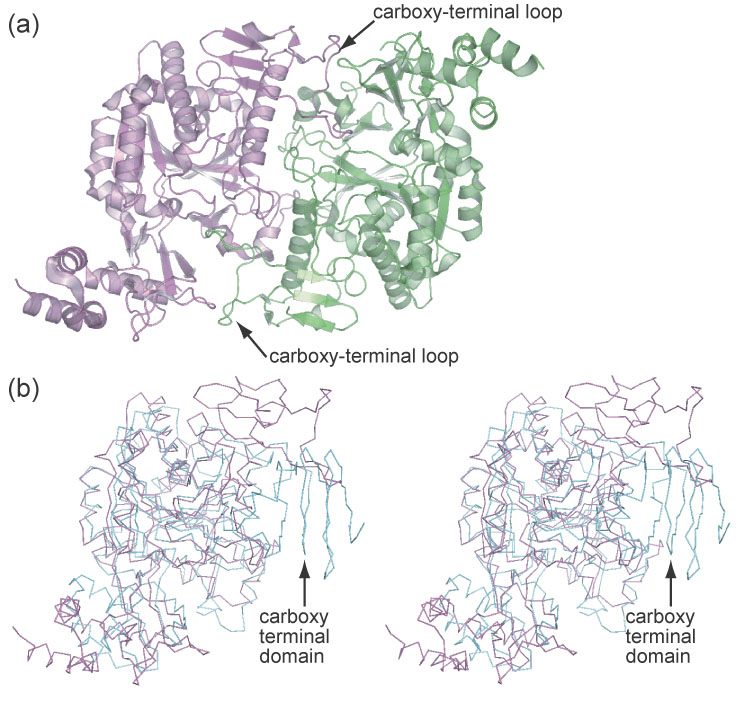
- The AGX1 dimer.
- Overlay of the AGX1 (magenta) and UDPGP (cyan) monomers. The β-helix of UDPGP prevents dimerization similar to that of AGX1.
Geisler et al. used their homology model for a barley UDPGP to rationalize the effect of mutations on enzyme activity of reported enzyme variants25. The Arabidopsis UDPGP crystal structure reported here supports the all of their conclusions except for those mutations in the carboxy-terminal domain. These include mutations of Arg422 from the human liver isozyme26 and Lys367, Lys409, and Lys410 from potato27. The most significant difference is with Lys367, mutation of which has been shown to abolish enzyme activity. In the homology model, this residue is described as being in the upper part of the active site away from the substrate. In the Arabidopsis UDPGP crystal structure, the equivalent residue, Lys360, is within hydrogen bonding distance to an α-phosphate oxygen of UDP-Glucose and UTP and supports the results of the mutational study.
Comparison with other pyrophosphorylases
Other pyrophosphorylases with a α-helix fold have been structurally characterized. These include N-acetylglucosamine 1-phosphate uridylyltransferase from Escherichia coli28 and Streptococcus pneunomiae29 and a potato tuber ADP-glucose pyrophosphorylase30. In both cases the major axis of the α-helix is oriented approximately perpendicular to that of the Arabidopsis UDPGP allowing for entirely unique oligomerization states. Magnesium (II) is known to be necessary for enzyme activity of UDPGP3. Analysis of the Protein Data Bank revealed several pyrophosphorylase structures complexed to Mg2+. These include the UDP-N-acetylglucosamine pyrophosphorylases from Escherichia coli and Streptococcus pneumoniae (PDB IDs 1hv9 and 1g97), TDP-glucose pyrophosphorylase from Escherichia coli (PDB ID 1mc3), and CDP-glucose pyrophosphorylase from Salmonella typhi (PDB ID 1wvc). In each case the magnesium was coordinated by a highly conserved aspartate (Asp131, Asp105, Asp102, and Asp108, respectively) and another highly conserved residue (Asp236, Asn227, Asn227, and Asp223, respectively). The UDPGP enzyme contains a structural homolog of the first aspartate (Asp222); however, the second residue is not structurally conserved. This area is instead taken up by residues Arg355, Phe356, Leu357, Pro358, Val359, and Lys360; none of which are likely to aid in coordinating the magnesium. In fact, the terminal amine of Lys360 occupies the position of the magnesium in the other pyrophosphorylase structures in some of the UDPGP structures. Sequence analysis of a number of UDP-glucose pyrophosphorylases revealed that the Arg355–Lys360 motif was highly conserved in UDP-glucose pyrophosphorylases in species ranging from higher eukaryotes to bacteria.
Binding of UDP-glucose in the Arabidopsis UDPGP is similar to that of ADP-glucose in the structure of potato tuber ADP-glucose pyrophosphorylase except for the α-phosphate30. In the UDPGP structure the α-phosphate is flipped in a different direction such that the position of the phosphorus is approximately 4.1 Å from its position in the ADP-glucose pyrophosphorylase. In UDPGP the sidechain of His192 occupies the position of the α-phosphate in ADP-glucose pyrophosphorylase. This change in the α-phosphate position brings the phosphate significantly closer to Lys99 and Lys360 in the UDPGP structure. These lysines are important for stabilization of the negatively charged phosphates in the active site.
Oligomerization
The apparent dimer observed in the UDPGP crystal structure suggests an explanation for the decrease in enzyme activity observed upon oligomerization of the enzyme16. The amino-terminal domain of each monomer is positioned against the carboxy-terminal β-helix of the other monomer and directly across its active site. This would not only restrict the entry of substrate into the active site, but would also restrain movement of the β-helix that may be necessary for catalysis.
Structural changes responsible for substrate binding order specificity
As described previously, catalytic activity in UDPGP appears to be initiated by binding of UTP or UDP-glucose prior to the binding of glucose-1-P or PPi3. Analysis of the crystal structure suggests a possible structural explanation for the requirement of binding UTP prior to glucose-1-P. As observed in the UTP bound complex, binding of the nucleotide results in an induced-fit-like conformational change, where the nucleotide binding loop, in conjunction with the carboxy-terminal domain, closes down on the nucleotide substrate. The sugar binding loop was only observed to be in the closed state in the UDP-glucose complex. In the UTP complex the sugar binding loop was in the open conformation; however, higher temperature factors and poorer quality electron density indicate that structural flexibility was increased within the sugar binding loop in the UTP complex relative to that of the native enzyme. The region is most likely destabilized by the negative charges of the nearby phosphate groups of UTP. This increase in structural flexibility may be a necessary prerequisite for formation of the high affinity site for glucose-1-P induced upon binding of UTP.
Domain motion and catalysis
Protein structures are inherently flexible, and the native state is a collection of conformational substates. Our experience in refinement of UDPGP demonstrates that considering conformational variance in the crystal can lead to a large improvement in model quality. We used two different methods, and found excellent agreement between the direction of anisotropic displacement parameters generated by TLS refinement and the atomic displacements produced by multiple model refinement. However, we found that the multiple model refinement ultimately gave better refinement statistics, presumably because TLS refinement is better suited for a unimodal atomic distribution rather than the bimodal distribution accounted for by the multiple model refinement. Recently, multiple studies have shown that simple models based on contact topology capture the direction and magnitude of the conformational variance31. The results of normal mode analysis presented here are consistent with this view, as the computational predictions agree well with both the magnitude of variance in the form of temperature factors, and the direction of observed conformational change. Thus this work also shows that calculations based on a single structure can predict the directions of allowed displacements that occur in the course of substrate binding or catalytic activity.
Based on the protein conformations observed in the crystal structure, as well as the normal mode analysis results, we propose that motion of the nucleotide binding loop, as induced by the binding of UDP-glucose or UTP, is coupled to the motion of the carboxy-terminal domain. The equivalent loop in ADP-glucose pyrophosphorylase was also observed to undergo conformational changes between the native and ADP-glucose bound forms30.
Conclusions
Crystal structures of the native Arabidopsis UDPGP as well as complexes with UDP-glucose and UTP have been presented. While possessing many of the same fold features seen in other structurally characterized nucleotidyl-sugar pyrophosphorylases, the overall fold of the Arabidopsis UDPGP structure is unique. The structures reveal multiple conformational substates induced by substrate binding. The use of TLS refinement followed by the addition of a second conformer for the entire UDP-glucose complex resulted in significant improvement of the crystallographic refinement statistics. The conformational changes suggest a mechanism for substrate binding order as well as indicate extensive domain motions within the enzyme that strongly agree with normal mode predictions. The structures also suggest a structural basis for activity regulation via oligomerization.
Materials and Methods
Protein expression and purification
Cloning, expression, and purification of UDPGP followed published protocols32-34. In short, the At3g03250 cDNA was cloned into a pVP13 plasmid encoding a histidine6-maltose binding protein tag. Native and selenomethionine-labeled protein were expressed in B834 Escherichia coli using self-induction media. After sonication of the harvested cells, the protein in the supernatant was purified via immobilized nickel affinity chromatography, and TEV protease was used to cleave the affinity/solubility tag. After tag capture by subtractive nickel affinity chromatography, and a final desalting step, the protein was concentrated to 10 mg/mL and dialyzed against 50 mM NaCl, 0.3 mM tris-carboxyethylphosphine, and 5 mM Tris pH 8.0. Protein aliquots were then drop frozen in liquid nitrogen and stored at 193 K. An initial 2 L growth resulted in approximately 62 mg of UDPGP.
Crystallization
UDPGP protein crystals were grown by the hanging-drop vapor-diffusion method at 293 K. The reservoir solution contained 25% (w/v) polyethylene glycol 2000, 5% (v/v) dimethylsulfoxide, and 100 mM morpholinoethanesulfonic acid-acetate pH 5.5. The hanging drop consisted of 2 μL of protein solution mixed with 2 μL of reservoir solution. We were unable to reproduce these crystals, and additional crystals could only be successfully grown by microseeding. To obtain complexes, crystals were soaked in a solution of mother liquor containing either 5 mM UDP-glucose or 5 mM UTP for an hour. The mother liquor proved to be self-cryoprotecting and crystals were directly flash-cooled in a stream of nitrogen.
Data collection and reduction
Diffraction data for the unliganded, selenomethionine-containing structure and the UDP-glucose complex were collected at the Advanced Photon Source (APS) on Southeast Regional Collaborative Access Team (SER-CAT) beamline 22-ID and the diffraction data for the unliganded, native structure were collected on APS SER-CAT beamline 22-BM. The diffraction images were integrated and scaled using the HKL2000 package 35. The diffraction data for the UTP complex were collected with a BrukerAXS ProteumR CCD detector and Microstar rotating-anode generator using copper Kα radiation. X-ray data were processed and scaled with the programs SAINT and SADABS from the Proteum software suite (Bruker, Madison, WI).
Structure Determination
Heavy atom sites were identified with Hyss36,37. The selenomethionine data was phased through single wavelength anomalous diffraction using CNS to 2.5 Å, and the resulting phases were then extended to the resolution of the native data set38. Resolve was used to perform 2-fold averaging and phase extension39. The initial model was built with Arp/warp40. Additional model building and refinement were conducted using Xfit, CNS, and REFMAC41,42.
Molecular replacement through Molrep43 was used to generate the initial phases for both the UDP-glucose complex and the UTP complex using the structure of the native UDPGP as a model. The model of the UTP complex was completed using Coot and REFMAC42,44. Completion of the UDP-glucose complex proved more difficult. Following initial phasing, little to no electron density was visible for the last 100 residues of chain A as well as for several internal stretches of residues within protein chains A and B. The structure was partially rebuilt using alternate cycles of manual building in Coot44 and restrained refinement with REFMAC42 with the help of composite annealed omit maps generated by CNS38. Refinement in REFMAC resulted in an R-factor of 0.3, which we were unable to improve further using the adopted refinement protocol. Therefore, TLS refinement with REFMAC was attempted using TLS parameters generated by the TLSMD server45 where each chain was broken into 20 groups. Within these groups, the largest TLS-produced variance was 2.08 Å2 and the mean variance was 0.57 Å2. Following TLS refinement, which improved the R-factor to 0.26, additional density corresponding to alternate mainchain atoms became observable around the carboxy-terminal region of chain A. Alternate chain conformers were built into this density and further refinement was carried out in CNS38. After multiple rounds of additional model building and refinement, it became clear from the density that alternate chain conformers would be needed throughout most of chain A and to a lesser extent throughout chain B. Simulated annealing was used to initially separate the alternate conformers. The model was then completed using alternate cycles of manual building in Coot44 and multiple conformer refinement with CNS38. Figures in this manuscript were produced with PyMOL46 and Ribbons47.
Normal mode analysis
Normal mode analysis is used to predict the conformational variation of the native protein structure48,49. The analysis is based on diagonalizing the Hessian matrix, defined by a potential energy function. Different models can be used to define the potential, ranging from chemical force-fields to simple contact-based models, known as Elastic Network Models (ENM)50. We use an ENM potential that we proposed recently to calculate the normal modes, variances in position, and cross-correlations in deviations throughout the structure. The model, referred to as the Distance Network Model (DNM), defines interactions between residues by tabulating atom pairs from two residues in different distance bins, e.g. from 2.3 Å to 3.3 Å, from 3.3 Å to 5 Å, as described in our recent work (Kondrashov et al., submitted). Atomic contacts at different distances are given different weight, and then added together to form the total Hessian.
Normal mode analysis was performed on model 1 chain A of the UDP-glucose complex structure (2icy) to predict large-scale domain movements. We compared the direction of positional variation in the TLS model and in the normal mode calculations. From the TLS parameters we calculated atomic displacement parameters (ADPs) according to a known formula45, and we also computed anisotropic displacement parameters (ADPs) by adding up contributions from the one hundred lowest frequency modes of DNM51. The two sets of ADPs for the Cα atoms are compared both in magnitude and direction. The magnitude is given by the trace of the ADP matrices; we used linear correlation to measure the agreement over all Cα atoms. ADP parameters describe thermal ellipsoids, which are defined by their principal axes (eigenvectors) and the associated lengths (inverse eigenvalues); the ratio of the smallest to the largest eigenvalue is called its anisotropy52. We restricted directionality comparison to ellipsoids with anisotropy of less than 0.5, since directional comparison of near-spherical ellipsoids is meaningless. Further, to compare directions of ellipsoids, we first divided all the matrices by their trace, to set all magnitudes to 1. We used the absolute value of the dot product between the major directions of ADPs from TLS and DNM normal modes for the same Cα atom as the measure of agreement in preferred direction of deviation from the average position.
Acknowledgements
This work was supported by the National Institutes of Health, Protein Structure Initiative P50 GM 64598, U54 GM 074901 (John L. Markley, P.I., George N. Phillips Jr. and Brian G. Fox, Co-Investigators), DOE Training Grant DE-FG2-0HER25627 (Bannen), and NLM training grant T15 LM007359 (McCoy and Kondrashov). The Advanced Photon Source is supported by the U.S. Department of Energy, Basic Energy Sciences, Office of Science, under contract No. W-31-109-ENG-38. Data were collected at Southeast Regional Collaborative Access Team (SER-CAT) 22-ID and 22-BM beamlines at the Advanced Photon Source, Argonne National Laboratory. Supporting institutions may be found at www.ser-cat.org/members.html. We specially thank Craig S. Newman, Zhaohui Sun, Russell L. Wrobel, Eric Steffan, Zachary Eggers, Megan Riters, Ronnie O. Frederick, John Kunert, Hassan Sreenath, Brendan T. Burns, Kory D. Seder, Holalkere V. Geetha, Frank C. Vojtik, Won Bae Jeon, Jason M. Ellefson, Andrew C. Olson, Janet E. McCombs, Janelle T. Warick, Louise Meske, Bryan Ramirez, Zsolt Zolnai, Peter T. Lee, Mike Runnels, John Cao, Jianhua Zhang, John G. Primm, Donna M. Troestler, Michael R. Sussman, John L. Markley, and other members of the CESG staff.
Footnotes
Publisher's Disclaimer: This is a PDF file of an unedited manuscript that has been accepted for publication. As a service to our customers we are providing this early version of the manuscript. The manuscript will undergo copyediting, typesetting, and review of the resulting proof before it is published in its final citable form. Please note that during the production process errors may be discovered which could affect the content, and all legal disclaimers that apply to the journal pertain.
References
- 1.Sonnhammer EL, Eddy SR, Durbin R. Pfam: a comprehensive database of protein domain families based on seed alignments. Proteins. 1997;28:405–420. doi: 10.1002/(sici)1097-0134(199707)28:3<405::aid-prot10>3.0.co;2-l. [DOI] [PubMed] [Google Scholar]
- 2.Sheu KF, Frey PA. UDP-glucose pyrophosphorylase. Stereochemical course of the reaction of glucose 1-phosphate with uridine-5′[1-thiotriphosphate] J Biol Chem. 1978;253:3378–3380. [PubMed] [Google Scholar]
- 3.Tsuboi KK, Fukunaga K, Petricciani JC. Purification and specific kinetic properties of erythrocyte uridine diphosphate glucose pyrophosphorylase. J Biol Chem. 1969;244:1008–1015. [PubMed] [Google Scholar]
- 4.Lamerz AC, Haselhorst T, Bergfeld AK, von Itzstein M, Gerardy-Schahn R. Molecular cloning of the Leishmania major UDP-glucose pyrophosphorylase, functional characterization, and ligand binding analyses using NMR spectroscopy. J Biol Chem. 2006;281:16314–16322. doi: 10.1074/jbc.M600076200. [DOI] [PubMed] [Google Scholar]
- 5.Kleczkowski LA, Geisler M, Ciereszko I, Johansson H. UDP-glucose pyrophosphorylase. An old protein with new tricks. Plant Physiol. 2004;134:912–918. doi: 10.1104/pp.103.036053. [DOI] [PMC free article] [PubMed] [Google Scholar]
- 6.Worrell AC, Bruneau JM, Summerfelt K, Boersig M, Voelker TA. Expression of a maize sucrose phosphate synthase in tomato alters leaf carbohydrate partitioning. Plant Cell. 1991;3:1121–1130. doi: 10.1105/tpc.3.10.1121. [DOI] [PMC free article] [PubMed] [Google Scholar]
- 7.Huber SC, Huber JL. Role of Sucrose-Phosphate Synthase in Sucrose Metabolism in Leaves. Plant Physiol. 1992;99:1275–1278. doi: 10.1104/pp.99.4.1275. [DOI] [PMC free article] [PubMed] [Google Scholar]
- 8.Aloni Y, Delmer DP, Benziman M. Achievement of high rates of in vitro synthesis of 1,4-beta-D-glucan: activation by cooperative interaction of the Acetobacter xylinum enzyme system with GTP, polyethylene glycol, and a protein factor. Proc Natl Acad Sci U S A. 1982;79:6448–6452. doi: 10.1073/pnas.79.21.6448. [DOI] [PMC free article] [PubMed] [Google Scholar]
- 9.Ghangas GS, Steffens JC. UDPglucose: fatty acid transglucosylation and transacylation in triacylglucose biosynthesis. Proc Natl Acad Sci U S A. 1993;90:9911–9915. doi: 10.1073/pnas.90.21.9911. [DOI] [PMC free article] [PubMed] [Google Scholar]
- 10.Kleczkowski LA. Glucose activation and metabolism through UDP-glucose pyrophosphorylase in plants. Phytochemistry. 1994;37:1507–1515. [Google Scholar]
- 11.Echeverria E, Boyer CD, Thomas PA, Liu KC, Shannon JC. Enzyme activities associated with maize kernel amyloplasts. Plant Physiol. 1988;86:786–792. doi: 10.1104/pp.86.3.786. [DOI] [PMC free article] [PubMed] [Google Scholar]
- 12.Sasaki T, Kainuma K. Solubilization of UDP-glucose-specific starch synthetase in sweet-potato (Ipomoea batatas) starch granules by the urea/pullulanase method. Biochem J. 1980;189:381–383. doi: 10.1042/bj1890381. [DOI] [PMC free article] [PubMed] [Google Scholar]
- 13.Ciereszko I, Johansson H, Hurry V, Kleczkowski LA. Phosphate status affects the gene expression, protein content and enzymatic activity of UDP-glucose pyrophosphorylase in wild-type and pho mutants of Arabidopsis. Planta. 2001;212:598–605. doi: 10.1007/s004250000424. [DOI] [PubMed] [Google Scholar]
- 14.Ciereszko I, Johansson H, Kleczkowski LA. Sucrose and light regulation of a cold-inducible UDP-glucose pyrophosphorylase gene via a hexokinase-independent and abscisic acid-insensitive pathway in Arabidopsis. Biochem J. 2001;354:67–72. doi: 10.1042/0264-6021:3540067. [DOI] [PMC free article] [PubMed] [Google Scholar]
- 15.Ciereszko I, Johansson H, Kleczkowski LA. Interactive effects of phosphate deficiency, sucrose and light/dark conditions on gene expression of UDP-glucose pyrophosphorylase in Arabidopsis. J Plant Physiol. 2005;162:343–353. doi: 10.1016/j.jplph.2004.08.003. [DOI] [PubMed] [Google Scholar]
- 16.Martz F, Wilczynska M, Kleczkowski LA. Oligomerization status, with the monomer as active species, defines catalytic efficiency of UDP-glucose pyrophosphorylase. Biochem J. 2002;367:295–300. doi: 10.1042/BJ20020772. [DOI] [PMC free article] [PubMed] [Google Scholar]
- 17.Kleczkowski LA, Martz F, Wilczynska M. Factors affecting oligomerization status of UDP-glucose pyrophosphorylase. Phytochemistry. 2005;66:2815–2821. doi: 10.1016/j.phytochem.2005.09.034. [DOI] [PubMed] [Google Scholar]
- 18.Ma J, Karplus M. Ligand-induced conformational changes in ras p21: a normal mode and energy minimization analysis. J Mol Biol. 1997;274:114–131. doi: 10.1006/jmbi.1997.1313. [DOI] [PubMed] [Google Scholar]
- 19.Tama F, Sanejouand YH. Conformational change of proteins arising from normal mode calculations. Protein Eng. 2001;14:1–6. doi: 10.1093/protein/14.1.1. [DOI] [PubMed] [Google Scholar]
- 20.Kundu S, Melton JS, Sorensen DC, Phillips GN., Jr. Dynamics of proteins in crystals: comparison of experiment with simple models. Biophys J. 2002;83:723–732. doi: 10.1016/S0006-3495(02)75203-X. [DOI] [PMC free article] [PubMed] [Google Scholar]
- 21.Pellegrini M, Gronbech-Jensen N, Kelly JA, Pfluegl GM, Yeates TO. Highly constrained multiple-copy refinement of protein crystal structures. Proteins. 1997;29:426–432. doi: 10.1002/(sici)1097-0134(199712)29:4<426::aid-prot3>3.0.co;2-6. [DOI] [PubMed] [Google Scholar]
- 22.Rader SD, Agard DA. Conformational substates in enzyme mechanism: the 120 K structure of alpha-lytic protease at 1.5 A resolution. Protein Sci. 1997;6:1375–1386. doi: 10.1002/pro.5560060701. [DOI] [PMC free article] [PubMed] [Google Scholar]
- 23.Gill HS, Pfluegl GM, Eisenberg D. Multicopy crystallographic refinement of a relaxed glutamine synthetase from Mycobacterium tuberculosis highlights flexible loops in the enzymatic mechanism and its regulation. Biochemistry. 2002;41:9863–9872. doi: 10.1021/bi020254s. [DOI] [PubMed] [Google Scholar]
- 24.Wilson MA, Brunger AT. The 1.0 A crystal structure of Ca(2+)-bound calmodulin: an analysis of disorder and implications for functionally relevant plasticity. J Mol Biol. 2000;301:1237–1256. doi: 10.1006/jmbi.2000.4029. [DOI] [PubMed] [Google Scholar]
- 25.Geisler M, Wilczynska M, Karpinski S, Kleczkowski LA. Toward a blueprint for UDP-glucose pyrophosphorylase structure/function properties: homology-modeling analyses. Plant Mol Biol. 2004;56:783–794. doi: 10.1007/s11103-004-4953-x. [DOI] [PubMed] [Google Scholar]
- 26.Chang HY, Peng HL, Chao YC, Duggleby RG. The importance of conserved residues in human liver UDPglucose pyrophosphorylase. Eur J Biochem. 1996;236:723–728. doi: 10.1111/j.1432-1033.1996.t01-1-00723.x. [DOI] [PubMed] [Google Scholar]
- 27.Katsube T, Kazuta Y, Tanizawa K, Fukui T. Expression in Escherichia coli of UDP-glucose pyrophosphorylase cDNA from potato tuber and functional assessment of the five lysyl residues located at the substrate-binding site. Biochemistry. 1991;30:8546–8551. doi: 10.1021/bi00099a008. [DOI] [PubMed] [Google Scholar]
- 28.Brown K, Pompeo F, Dixon S, Mengin-Lecreulx D, Cambillau C, Bourne Y. Crystal structure of the bifunctional N-acetylglucosamine 1-phosphate uridyltransferase from Escherichia coli: a paradigm for the related pyrophosphorylase superfamily. Embo J. 1999;18:4096–4107. doi: 10.1093/emboj/18.15.4096. [DOI] [PMC free article] [PubMed] [Google Scholar]
- 29.Kostrewa D, D'Arcy A, Takacs B, Kamber M. Crystal structures of Streptococcus pneumoniae N-acetylglucosamine-1-phosphate uridyltransferase, GlmU, in apo form at 2.33 A resolution and in complex with UDP-N-acetylglucosamine and Mg(2+) at 1.96 A resolution. J Mol Biol. 2001;305:279–289. doi: 10.1006/jmbi.2000.4296. [DOI] [PubMed] [Google Scholar]
- 30.Jin X, Ballicora MA, Preiss J, Geiger JH. Crystal structure of potato tuber ADP-glucose pyrophosphorylase. Embo J. 2005;24:694–704. doi: 10.1038/sj.emboj.7600551. [DOI] [PMC free article] [PubMed] [Google Scholar]
- 31.Chennubhotla C, Rader AJ, Yang LW, Bahar I. Elastic network models for understanding biomolecular machinery: from enzymes to supramolecular assemblies. Phys Biol. 2005;2:S173–180. doi: 10.1088/1478-3975/2/4/S12. [DOI] [PubMed] [Google Scholar]
- 32.Thao S, Zhao Q, Kimball T, Steffen E, Blommel PG, M. Riters, Newman CS, Fox BG, Wrobel RL. Results from high-throughput DNA cloning of Arabidopsis thaliana target genes using site-specific recombination. J. Struct. Funct. Genomics. 2004;5:267–276. doi: 10.1007/s10969-004-7148-4. [DOI] [PubMed] [Google Scholar]
- 33.Sreenath HK, Bingman CA, Buchan BW, Seder KD, Burns BT, Geetha HV, Jeon WB, Vojtik FC, Aceti DJ, Frederick RO, Phillips GN, Jr., Fox BG. Protocols for production of selenomethionine-labeled proteins in 2-L polyethylene terephthalate bottles using auto-induction medium. Protein Expr. Purif. 2005;40:256–267. doi: 10.1016/j.pep.2004.12.022. [DOI] [PubMed] [Google Scholar]
- 34.Jeon WB, Aceti DJ, Bingman CA, Vojtik FC, Olson AC, Ellefson JM, McCombs JE, Sreenath HK, Blommel PG, Seder KD, Buchan BW, Burns BT, Geetha HV, Harms A, Sabat G, Sussman MR, Fox BG, Phillips GN., Jr. High-throughput purification and quality assurance of Arabidopsis thaliana proteins for eukaryotic structural genomics. J. Struct. Funct. Genomics. 2005;6:143–147. doi: 10.1007/s10969-005-1908-7. [DOI] [PubMed] [Google Scholar]
- 35.Otwinowski Z, Minor W. Processing of X-ray Diffraction Data Collected in Oscillation Mode. Methods Enzymol. 1997;276:307–326. doi: 10.1016/S0076-6879(97)76066-X. [DOI] [PubMed] [Google Scholar]
- 36.Adams PD, Grosse-Kunstleve RW, Hung LW, Ioerger TR, McCoy AJ, Moriarty NW, Read RJ, Sacchettini JC, Sauter NK, Terwilliger TC. PHENIX: building new software for automated crystallographic structure determination. Acta Crystallogr. D Biol. Crystallogr. 2002;58:1948–1954. doi: 10.1107/s0907444902016657. [DOI] [PubMed] [Google Scholar]
- 37.Weeks CM, Adams PD, Berendzen J, Brunger AT, Dodson EJ, Grosse-Kunstleve RW, Schneider TR, Sheldrick GM, Terwilliger TC, Turkenburg MG, Uson I. Automatic solution of heavy-atom substructures. Methods Enzym. 2003;374:37–83. doi: 10.1016/S0076-6879(03)74003-8. [DOI] [PubMed] [Google Scholar]
- 38.Brunger AT, Adams PD, Clore GM, DeLano WL, Gros P, Grosse-Kunstleve RW, Jiang JS, Kuszewski J, Nilges M, Pannu NS, Read RJ, Rice LM, Simonson T, Warren GL. Crystallography & NMR system: A new software suite for macromolecular structure determination. Acta Crystallogr. D Biol. Crystallogr. 1998;54:905–921. doi: 10.1107/s0907444998003254. [DOI] [PubMed] [Google Scholar]
- 39.Terwilliger TC. Maximum-likelihood density modification. Acta Crystallogr D Biol Crystallogr. 2000;56:965–972. doi: 10.1107/S0907444900005072. [DOI] [PMC free article] [PubMed] [Google Scholar]
- 40.Perrakis A, Morris R, Lamzin VS. Automated protein model building combined with iterative structure refinement. Nat. Struct. Biol. 1999;6:458–463. doi: 10.1038/8263. [DOI] [PubMed] [Google Scholar]
- 41.McRee DE. XtalView/Xfit--A versatile program for manipulating atomic coordinates and electron density. J. Struct. Biol. 1999;125:156–165. doi: 10.1006/jsbi.1999.4094. [DOI] [PubMed] [Google Scholar]
- 42.Murshudov GN, Vagin AA, Dodson EJ. Refinement of macromolecular structures by the maximum-likelihood method. Acta Crystallogr. D Biol. Crystallogr. 1997;53:240–255. doi: 10.1107/S0907444996012255. [DOI] [PubMed] [Google Scholar]
- 43.Vagin A, Teplyakov A. MOLREP: an Automated Program for Molecular Replacement. Journal of Applied Crystallography. 1997;30:1022–1025. [Google Scholar]
- 44.Emsley P, Cowtan K. Coot: model-building tools for molecular graphics. Acta Crystallogr. D Biol. Crystallogr. 2004;60:2126–2132. doi: 10.1107/S0907444904019158. [DOI] [PubMed] [Google Scholar]
- 45.Painter J, Merritt EA. Optimal description of a protein structure in terms of multiple groups undergoing TLS motion. Acta Crystallogr D Biol Crystallogr. 2006;62:439–450. doi: 10.1107/S0907444906005270. [DOI] [PubMed] [Google Scholar]
- 46.DeLano WL. The Pymol Molecular Graphics System. DeLano Scientific LLC; San Carlos: [Google Scholar]
- 47.Carson M. Ribbons. Methods Enzym. 1997;277:493–505. [PubMed] [Google Scholar]
- 48.Go N, Noguti T, Nishikawa T. Dynamics of a small globular protein in terms of low-frequency vibrational modes. Proc Natl Acad Sci U S A. 1983;80:3696–3700. doi: 10.1073/pnas.80.12.3696. [DOI] [PMC free article] [PubMed] [Google Scholar]
- 49.Brooks B, Karplus M. Harmonic dynamics of proteins: normal modes and fluctuations in bovine pancreatic trypsin inhibitor. Proc Natl Acad Sci U S A. 1983;80:6571–6575. doi: 10.1073/pnas.80.21.6571. [DOI] [PMC free article] [PubMed] [Google Scholar]
- 50.Tirion MM. Large Amplitude Elastic Motions in Proteins from a Single-Parameter, Atomic Analysis. Physical Review Letters. 1996;77:1905–1908. doi: 10.1103/PhysRevLett.77.1905. [DOI] [PubMed] [Google Scholar]
- 51.Kidera A, Go N. Refinement of protein dynamic structure: normal mode refinement. Proc Natl Acad Sci U S A. 1990;87:3718–3722. doi: 10.1073/pnas.87.10.3718. [DOI] [PMC free article] [PubMed] [Google Scholar]
- 52.Trueblood KN, Burgi HB, Burzlaff H, Dunitz JD, Gramaccioli CM, Schulz HH, Shmueli U, Abrahams SC. Atomic displacement parameter nomenclature - Report of a subcommittee on atomic displacement parameter nomenclature. Acta Crystallographica Section A. 1996;52:770–781. [Google Scholar]


