Abstract
A model was developed of a bundle of cardiac fibers embedded in an extracellular space. In contrast to the classical bidomain approach, the model is constructed such that the intracellular and extracellular spaces are spatially distinct. The model was used to test the hypothesis that the distribution of the extracellular fluid in the tissue can affect the conduction velocity. The preliminary results suggest that under nominally normal conditions, the propagation speed depends on the fraction of extracellular space and less on the actual distribution of extracellular space within the bundle.
1. Introduction
Computer models of the heart have become useful tools in analyzing mechanisms of arrhythmias and anti-arrhythmic therapies. One of the most commonly used model to describe the electrophysiology of cardiac tissue is the so-called bidomain model [1]. This model describes cardiac tissue as a set of two homogeneous isotropic or anisotropic spaces, that span the entire simulated tissue volume. Both spaces are connected at each point in space by a membrane model describing the electrophysiology of the ion channels in the membrane and using this approach one can simulate the propagation of depolarization waves in the myocardium. One of the limitations of the bidomain model is that the discrete cellular structure is not explicitly taken into account. Because of this limitation, the bidomain cannot account for variations in the distribution of gap junctions, cell sizes extracellular space around cells that can arise under certain arrhythmogenic conditions, such as ischemia [2].
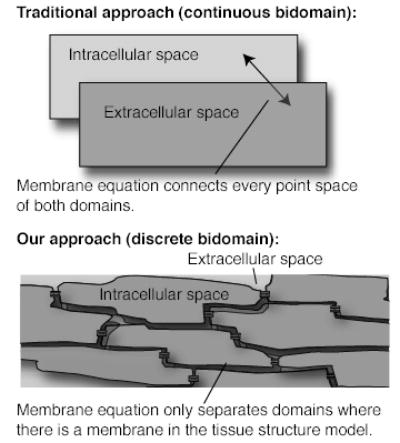
In order to further investigate how the action potential propagates in cardiac tissue we have developed a new model in which the intracellular and extracellular spaces are spatially distinct and separated by a membrane [2,3]. In contrast to classical models, the model allows for realistically shaped myocytes in three dimensions surrounded by non-uniform extracellular space, more closely mimicking the actual tissue architecture (Figure 1). For example, the extracellular space varies in thickness around a myocyte, with a larger fraction of space surrounding structures like capillaries. This asymmetric distribution suggests that conduction may be preferentially faster along the more open spaces, as the resistance is effectively lower.
Figure 1.

Image showing the difference between the continuous bidomain approach and the discrete bidomain approach.
In this paper we present a short overview of the methods used to create models at a cellular scale in three dimensions. The model is used to test the hypothesis that the distribution of extracellular space affects the speed of conduction of action potentials in tissue.
2. Methods
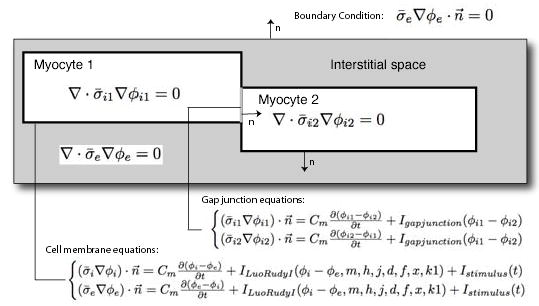
To simulate the changes in the propagation of action potentials for different distributions of the interstitial space, we created a 3D model of a strand of myocytes. The model consisted of two discrete volumes: the cytoplasm of the myocytes and the interstitial space surrounding the myocytes separated by the cell membrane. The model was setup in such a way that some myocytes touch neighboring myocytes (see Figure 2), whereas other parts are surrounded by the extracellular space. In cardiac tissue the part of the cell membrane, which connects two adjoining myocytes, is infused with gap junctions that form a low impedance connection between cells. In the model we therefore subdivided the membrane into a part that connects two myocytes and into a part that interfaces to the extracellular space (Figure 2). The portion of the membrane that connects two myocytes is modeled by a surface resistor and capacitor, which represent the low impedance pathway through the gap junctions averaged out over a piece of membrane. The surface between the interstitial space and the cytoplasm contains the ionic channels, and hence is modeled using an ion channel model (current sources). Both surfaces were assumed to have the same amount of membrane capacitance. In this implementation, the volumes enclosed by these surfaces were assumed to be isotropic homogeneous ohmic volume conductors, characterized by a single conductivity value. As the intracellular space does not only contain cytoplasmic fluid, but also myofibrils and mitochondria, the conductive properties of the cytoplasmic fluid is averaged out over the total volume of the cell. In a similar way the extracellular space is homogenized as well. An overview of the equations used to describe the electrical potential in each compartment is given in Figure 2. In the model we assume the cell membranes behave according to the model specified by Luo and Rudy [4] for cardiac myocytes in Guinea Pigs.
Figure 2.

Overview of mathematical model used for the simulations. The figure depicts the partial differential equations that are being solved in the each of the myocyte and interstitial space domains as well as the boundary conditions assumed at each domain interface. Here, σi and σe denote the conductivity of respectively the intracellular and extracellular medium and Φi and Φe denote the intracellular and extracellular potential.
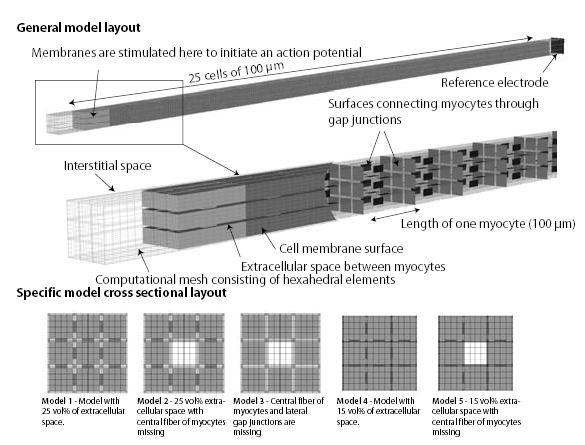
For the model presented in this paper we assumed a simple geometry in which the myocytes have a brick like shape and line up to form a strand of myocytes, see Figure 3. Every myocyte in the model had the same length of 100 μm and a cross section of 300 μm2, values which were derived from histology literature on cardiac tissue [3]. The model encompassed a strand of 3 by 3 by 25 myocytes with the myocytes connected at the ends and lateral adjoining boundaries by gap junctions (see Figure 3). We chose an average surface connectivity through the gap junction infused surfaces of 0.0015 kΩcm2, a value we used in an earlier modeling study to predict the impedance of cardiac tissue in a range that was consistent with literature values [3]. The conductivity of the extracellular space was assumed to be 2.0 S/m. This value was chosen assuming that the sodium and chloride ions are mainly responsible for the conductive properties of the extracellular fluid. Similarly a value of 0.3 S/m was chosen for the intracellular space based on the potassium concentration, the ionic mobility of potassium, and the volume of the cytoplasm [3]. A typical membrane capacitance of 1 μFcm2 was assumed.
Figure 3.

The general layout of the tissue model used in simulations is depicted in top figure. The center figure depicts an opened model showing the cell membrane embedded in the interstitial space on the left and the locations of the gap junctions on the right.
Based on this general model six specific models were created with a different distribution of interstitial in the direction perpendicular to the fiber. These six different distributions are depicted in the lower figure.
Each domain was divided into hexahedral elements, with 160 elements describing one myocyte. The potential in each element was described by a trilinear interpolation function between the nodes of the hexahedral element. The model consists of about 155,000 elements and is depicted in Figure 3.
The system of equations depicted in Figure 2 was solved using a using a finite element scheme with a semi-implicit time stepping scheme. The computational grids and corresponding stiffness matrices were generated using the BioPSE/SCIRun software package [5]. The system of equations was solved on a multiprocessor system using the CardioWave software package [6] with an iterative solver (GMRES). The time step was 50 ns for a total of 6 ms after stimulation.
To investigate the role of the distributions of the extracellular space around cells on the conduction velocity, five different geometries were created (Figure 3). Model 1 consisted of a strand of nine myocyte fibers that were equally spaced and surrounded by a sheet of extracellular space of a homogenous thickness. In this model, the fraction of extracellular space was 25%. Model 2 had the same geometry of Model 1, but with the center fiber was removed to simulate the effect of small edema in a fiber. The removal of the fiber increased the overall extracellular space to be 33 volume %. Model 3 is the same as Model 2 with the lateral gap junctions removed. This model was used to determine if the lateral connections act to synchronize the wavespeed in each fiber with an asymmetric extracellular space. Model 4 has the same geometry as Model 1 except the extracellular space was reduced from 25 volume % to 15 volume%. Finally, Model 5 has the same geometry as Model 4 but with central fiber missing. With the missing central fiber, the overall extracellular space is increased to 25 volume% equivalent to Model 1, but with a different distribution.
3. Results
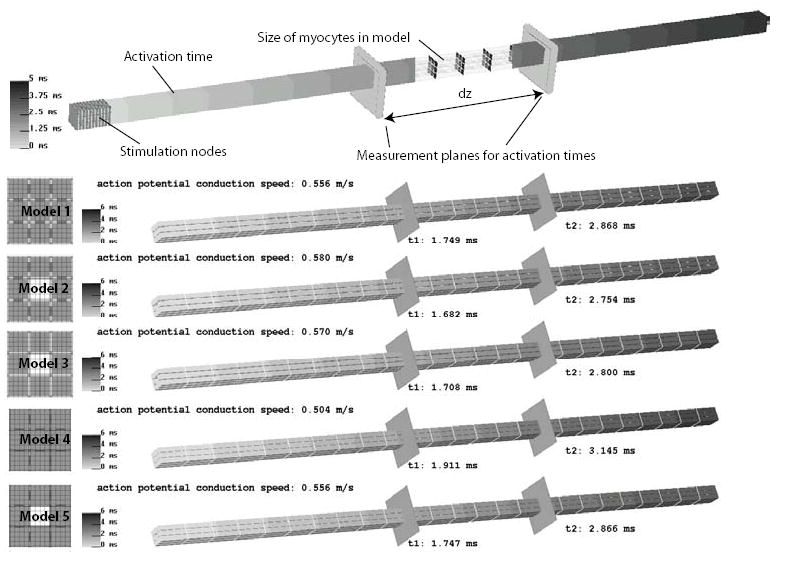
In this study, the conduction speed of the action potentials were compared for the different bundle geometries shown in Figure 3. After stimulating the first myocyte in the strand, the average activation time at two locations along the bundle was determined (Figure 4). The locations were chosen to be in the center of the bundle away from any end effects. The results of the simulations are shown in the lower part of Figure 4. Comparing Model 1 and Model 4, shows that reducing the amount of extracellular space around the cell from 25 volume % to 15 volume % reduces the conduction speed about 10%, from 0.556 m/sec to 0.504 m/sec. As noted above, the extracellular space in Model 2 and Model 5 are approximately the same but have significantly different distributions. The results show that the conduction velocity is insensitive to the distribution. Eliminating the lateral gap junctions in Model 2 to create Model 3 led to a slight reduction of conduction velocity.
Figure 4.

Comparison between activation times of the different models when stimulated at the first cell. The color scale depicts the order in which the fiber is activated. To compare the models we selected two locations along the fiber for which the average activation time was computed. Based on these values the conduction speed of the action potential was computed.
4. Discussion and conclusions
The model approach present here allows the ability to manipulate both the magnitude and distribution of the intra and extracellular spaces in the tissue volume. While idealized cell volumes were used here, the approach can be used to represent more realistic cell shapes and patterns of coupling in three dimensions. The simulations reveal that the wavespeed is relatively insensitive to nominal changes distribution of extracellular space. In this sense, the tissue acts to maintain a constant velocity despite local changes to the structure. Changes in the fraction of extracellular space, however, can have significant effects on wave speed as predicted by the bidomain models. The simulations presented here assume volume fractions and cell sizes that do not vary along the bundle. In real tissue, the cell shape and volume fractions are expected to be heterogeneous and may be locally extreme under conditions like hypertrophy or ischemia. During onset of ischemia, the volume fraction of extracellular space can locally change due to the collapse of capillaries. The proposed model will allow for more detailed studies on propagation and propagation failure in 3D and help to elucidate a possible role of the extracellular space and cellular geometry on conduction disturbances.
Acknowledgments
We want to acknowledge support for this work through NIH grants RO1 HL076767 and RR12553-07.
References
- 1.Henriquez CS. Simulating the electrical behavior of cardiac tissue using the bidomain model. Crit Rev Biomed Eng. 1993;21(1):1–77. [PubMed] [Google Scholar]
- 2.Stinstra JG, Shome S, Hopenfeld B, MacLeod RS. Modelling passive cardiac conductivity during ischaemia. Med Biol Eng Comput. 2005;43(6):776–82. doi: 10.1007/BF02430957. [DOI] [PubMed] [Google Scholar]
- 3.Stinstra JG, Hopenfeld B, Macleod RS. On the passive cardiac conductivity. Ann Biomed Eng. 2005;33(12):1743–51. doi: 10.1007/s10439-005-7257-7. [DOI] [PubMed] [Google Scholar]
- 4.Luo CH, Rudy Y. A model of the ventricular cardiac action potential. Depolarization, repolarization, and their interaction. Circ Res. 1991 Jun;68(6):1501–26. doi: 10.1161/01.res.68.6.1501. [DOI] [PubMed] [Google Scholar]
- 5.BioPSE: Problem solving environment for modeling, simulation, image processing, and visualization for biomedical computing applications. Scientific Computing and Imaging Institute (SCI), . 2002 http://software.sci.utah.edu/biopse.html.
- 6.CardioWave. 2006 http://cardiowave.duke.edu.


