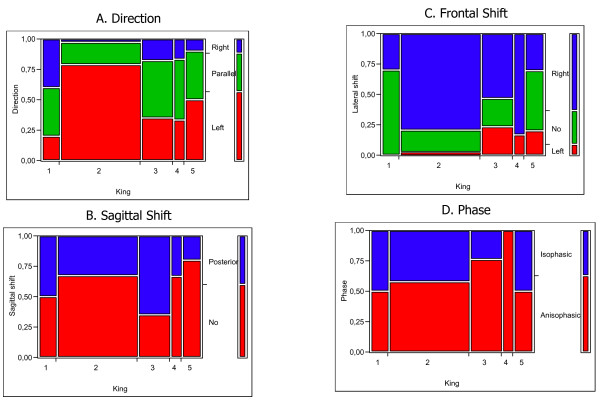
Figure 3.
Correlation between King classification and 3-DEMO parameters. As explained in Figure 1, in all graphs the legend of colors is reported in the vertical bar on the left, each vertical bar reports the SRS classification (Tl: thoracic left; Tr: thoracic right), all graphs are scaled in percentage of cases. It can be easily seen that King curve type 2, typically highly represented, is correlated with Direction (graph A: left in 75% of cases) and Frontal Shift (graph C: right in over 75% of cases). Interestingly almost all King 4 curves were Anisophasic (graph D).

