

Abstract
We show that differences in the reproductive development of honey bee workers are associated with locus-specific changes to abundance of messenger RNA. Using a cross-fostering field experiment to control for differences related to age and environment, we compared the gene expression profiles of functionally sterile workers (wild-type) and those from a mutant strain in which workers are reproductively active (anarchist). Among the set of three genes that are significantly differentially expressed are two major royal jelly proteins that are up-regulated in wild-type heads. This discovery is consistent with sterile workers synthesizing royal jelly as food for developing brood. Likewise, the relative underexpression of these two royal jellies in anarchist workers is consistent with these workers’ characteristic avoidance of alloparental behaviour, in favour of selfish egg-laying. Overall, there is a trend for the most differentially expressed genes to be up-regulated in wild-type workers. This pattern suggests that functional sterility in honey bee workers may generally involve the expression of a suite of genes that effectively ‘switch’ ovaries off, and that selfish reproduction in honey bee workers, though rare, is the default developmental pathway that results when ovary activation is not suppressed.
Keywords: cDNA microarrays, major royal jelly proteins, Niemann-Pick c proteins, sociogenomics
Introduction
The expression of altruistic helper traits such as sterility and alloparental care (i.e. provision of care to an individual that is not an offspring) usually comes at a cost to the altruist's direct reproductive success. Despite this direct cost, alleles that increase altruistic behaviour can persist in populations and increase in frequency if their expression in some individuals has the effect of increasing the fitness of others that carry non-expressed replicas (Hamilton, 1964). Thus, one opportunity for identifying ‘genes for altruism’ is via expression-based genomic screens.
In honey bee societies, queens constitute the reproductive female caste and activate their ovaries within a few days of mating. Workers, by contrast, cannot mate and almost never activate their ovaries in the presence of their queen, rendering themselves functionally sterile (Butler, 1957). Thus in honey bees, worker sterility is a function of ovary activation, and genes for sterility might simply encode proteins that suppress ovary activation under certain conditions – as in queenright honey bee workers. If so, these genes could potentially be identified by comparing the gene-expression profiles of queens against workers: genes differentially expressed between queens with active ovaries and workers without them should include those that generate this reproductive difference. This approach is, however, considerably complicated by the fact that queens and workers are strongly differentiated across a vast array of characteristics, including many that are not directly related to reproduction (Michener, 1974; Winston, 1987). As a consequence, differences in gene expression between the two castes are considerable (Evans & Wheeler, 2000). This makes the detection of genes specifically associated with ovary activation, and thus sterility, difficult.
An alternative approach toward the isolation of genes specifically associated with suppression of ovary activation in workers is to compare the expression profiles of ovary-activated and ovary non-activated individuals within this caste. Rare though ovary-activated queenright workers are (Visscher, 1989), genes differentially expressed between them and their sterile sisters are more likely to include genes that directly ‘switch’ ovaries on or off within individuals, as opposed to directing other aspects of caste differentiation.
In this study, we use a series of two-colour cDNA microarrays generated from the bee brain expressed sequence tag (beeEST) project (Whitfield et al., 2002) to screen ≈ 5500 genes for expression differences related to ovary activation in developing workers. Our approach was to compare the gene expression profile of young wild-type workers against that of ‘anarchists’, a mutant strain of honey bee in which queenright workers regularly develop into selfish egg layers at high frequency (Oldroyd et al., 1994; Oldroyd & Osborne, 1999). Patterns of inheritance of the anarchic and wild-type phenotypes strongly suggest that the anarchic phenotype is ultimately controlled by a small number of genes, possibly as few as two (Montague & Oldroyd, 1998; Barron et al., 2001). The availability of the mutant strain makes it possible to screen for genes whose expression is directly associated with the onset of ovary activation, while avoiding differences related to caste, age or social environment. These could include the immediate early gene(s) that regulate ovary activation, and downstream genes that are controlled by these genes. Thus genes differentially expressed between young anarchist (AN) and wild-type (WT) workers are likely to be those that are directly involved in the regulation of worker sterility, or are differentially expressed as a consequence of genes that regulate worker sterility. This screen is an important step toward deconstructing the molecular pathway that regulates functional sterility in honey bee workers.
Results
Our cross-fostering field experiments yielded co-reared WT and AN workers that showed substantial differences in degree of ovary activation, indicating a strong genetic effect on variation in ovary activation (Fig. 1). In 2004, the greatest difference between WT and AN workers was found in host colony ‘WT5’ (2% vs. 40%; n = 129,  = 24.8; P < 0.001). In 2005, the greatest difference between WT and AN was found in host colony ‘WT1’ (4% vs. 33%; n = 143, = 17.7; P < 0.001). We used these two biological contrasts in our genomic screen.
Figure 1.
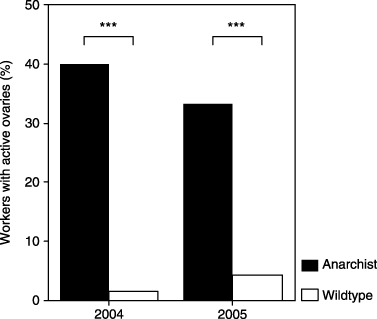
Summary of ovary assay for the two focal colonies; one chosen per year. Anarchist workers have higher levels of ovary activation compared with wild-types. Contingency table analyses indicate that all comparisons are significant (both P < 0.001).
Hybridization quality plots did not reveal any technical aberrations or systematic biases in the normalized gene expression data (see Supplementary material). Statistical differences inferred from the normalized data should therefore represent differential gene expression and not technical bias.
A volcanoplot showing the statistical distribution of positive vs. negative expression-fold changes reveals a general symmetry in terms of up- vs. down-regulation (Fig. 2), but a tendency for up-regulation in WT is present among the most informative genes of both experiments (brain, abdomen). Among these are four beeESTs that show strong evidence for differential expression. They are BB160004B10E06 and BB170007B20D05 (circled on Fig. 2A) and BB170032A10H06, beeEST BB170008A10E05 (circled on Fig. 2B). The remainder of beeESTs, representing the vast majority of genes screened, fall below the adjusted threshold for significance, and thus show no strict evidence of differential gene expression.
Figure 2.

Volcano-plots showing the log-fold change (i.e. M) of each gene against the log-odds for differential expression. Positive values on x-axis indicate up-regulation in WT; negative values indicate up-regulation in AN. Labelled genes are significantly differentially expressed (q < 0.05, see text). MRJP, major royal jelly protein; NPC2-like, Niemann–Pick type C2-like protein.
Table 1 shows the top 20 most informative genes, as ranked by the absolute value of t-statistics in each experiment. The four beeESTs with significant (q < 0.05) differences in their expression between AN and WT workers (Fig. 2) represent two major royal jelly proteins (MRJP) up-regulated in WT worker heads, MRJP2 and MRJP7, and one Niemann–Pick type C2 protein (NPC2-like) up-regulated in WT worker abdomens. Thus, the two beeESTs significantly up-regulated in abdomens correspond to one predicted gene, NPC2-like, yielding a total of three genes differentially expressed. We regard the three differentially expressed genes identified from this analysis as important predictors of ovary activation in honey bee workers. These candidates are strongly associated with reproductive class in developing workers, and show expression fold differences of 2.08-fold (MRJP2), 1.65-fold (MRJP7) and ≈ 1.67-fold (NPC2-like).
Table 1.
Top-20 most informative genes implicated in the regulation of worker sterility. We present separate lists for brain and abdominal tissue experiments. For each gene we show the log ratio of expression (M, see text), where positive values indicate higher expression in the WT, as well as other summary information
| Rank | beeEST | Accession | Sign | Log-ratio, M | t-statistic | Apis mellifera gene† | Linkage group‡ | Homology |
|---|---|---|---|---|---|---|---|---|
| Brain tissue | ||||||||
| 1 | BB160004B10E06 | BI511095 | + | 1.06266 | 10.54052* | MRJP2 (AF000632) | LG11 | − |
| 2 | BB170007B20D05 | BI508208 | + | 0.73022 | 8.90504* | MRJP7 (NM_001014429) | LG11 | − |
| 3 | BB160007A10D09 | BI511842 | + | 1.14376 | 7.31903 | MRJP3 (GB15390) | LG11 | − |
| 4 | BB160021B10H08 | BI516199 | − | 0.50340 | −7.03322 | Predicted (XM_396605) | − | − |
| 5 | BB160019B10C02 | BI515491 | + | 0.44407 | 6.74209 | Predicted (GB11494) | LGUn | CBG03739 |
| 6 | BB160003B10B11 | BI510780 | + | 1.16874 | 6.47057 | Predicted (GB12564) | LG12 | synapsin |
| 7 | BB170018B10A09 | BI509691 | + | 0.46876 | 5.97984 | MRJP5 (GB10622) | LG11 | − |
| 8 | BB170018B20G10 | BI506143 | + | 0.68512 | 5.89985 | MRJP5 (GB10622) | LG11 | − |
| 9 | BB160022A10G11 | BI516332 | + | 1.07841 | 5.80371 | MRJP3 (XM_391893) | LG11 | − |
| 10 | BB160012B20G11 | BI513504 | + | 0.46171 | 5.54909 | Unknown | LGUn | − |
| 11 | BB170014B20E03 | BI505979 | − | 0.76631 | −4.86389 | Unknown | LG2 | − |
| 12 | BB160010A10B11 | BI512703 | + | 0.40742 | 4.79587 | Predicted (GB14785) | LG7 | mapmodulin |
| 13 | BB160023B20H03 | BI516947 | + | 0.58835 | 4.58093 | MRJP4 (NM_001011610) | LG11 | − |
| 14 | BB170004A20C08 | BI503042 | + | 0.58392 | 4.50234 | Unknown | LG14 | − |
| 15 | BB170012B20B02 | BI509225 | − | 0.47082 | −4.35128 | Predicted (GB11410) | LG4 | CG31803 |
| 16 | BB160006A20B02 | BI511564 | + | 0.48269 | 4.05937 | Unknown | LG1 | − |
| 17 | BB160016B10G12 | BI514886 | + | 0.35545 | 4.02584 | Predicted (GB16628) | LGUn | RpL6 |
| 18 | BB170019B20B11 | BI506253 | + | 0.30753 | 3.99177 | Predicted (GB11074) | LG2 | CG7886 |
| 19 | BB160005B10G11 | BI511393 | − | 0.31552 | −3.94055 | Predicted (GB17176) | LG4 | CG7231 |
| 20 | BB170011B20D04 | BI503319 | + | 0.52384 | 3.90507 | Predicted (GB13722) | LG6 | glucocerebrosidase |
| Abdominal tissue | ||||||||
| 1 | BB170032A10H06 | BI505487 | + | 0.8815213 | 11.776712* | Predicted (GB14261) | LG5 | NPC2-like |
| 2 | BB170008A10E05 | BI507942 | + | 0.5827994 | 11.635177* | Predicted (GB14261) | LG5 | NPC2-like |
| 3 | BB160011A10H06 | BI513067 | + | 0.5359440 | 5.144227 | Unknown | − | − |
| 4 | BB160014B20G06 | BI514297 | + | 0.2770965 | 4.905664 | Unknown | LGUn | − |
| 5 | BB160020A20G08 | BI515752 | + | 0.3076986 | 4.775538 | Predicted (GB17081) | LG11 | ubiquitin |
| 6 | BB160016B20E02 | BI514937 | + | 0.3445220 | 4.676179 | Predicted (GB14785) | LG7 | mapmodulin |
| 7 | BB170003A20H02 | BI504934 | + | 0.2577799 | 4.575170 | Unknown | LG5 | − |
| 8 | BB160017A20E09 | BI515062 | + | 0.3084728 | 4.496380 | Unknown | LG2 | − |
| 9 | BB160022A20E11 | BI516405 | + | 0.2790998 | 4.347537 | Unknown | LGUn | − |
| 10 | BB170011A10B12 | BI508145 | + | 0.3882265 | 4.346908 | Predicted (GB13731) | LG15 | RpL26 |
| 11 | BB170026B10D08 | BI509796 | + | 0.5366856 | 4.242169 | Unknown | LG13 | − |
| 12 | BB170014B10G12 | BI509138 | + | 0.3886676 | 4.011500 | Predicted (GB17541) | LG15 | CG5059 |
| 13 | BB160022A10F07 | BI516320 | + | 0.5546391 | 3.919889 | Predicted (GB13399) | LGUn | myosin |
| 14 | BB160021B20G08 | BI516272 | + | 0.2588436 | 3.844824 | Predicted (GB13198) | LG9 | CG14232 |
| 15 | BB160019A10F04 | BI515339 | + | 0.2025632 | 3.719943 | Predicted (GB19244) | LGUn | MGC89629 |
| 16 | BB170020B10D08 | BI505261 | − | 0.1759085 | −3.701303 | Unknown | LG14 | − |
| 17 | BB160022A10E02 | BI516305 | + | 0.3322998 | 3.664078 | Predicted (GB13621) | LG1 | Solute carrier |
| 18 | BB160019A20D08 | BI515373 | + | 0.2759870 | 3.628079 | Predicted (GB13198) | LG9 | (= to 14) |
| 19 | BB170023A10E04 | BI509838 | + | 0.3020104 | 3.624914 | Predicted (GB15437) | LG2 | CG17034 |
| 20 | BB170029B10F04 | BI505465 | + | 0.2807702 | 3.624723 | Predicted (GB15483) | LGUn | RpS19e |
Indicates significance, q < 0.05.
The accession number (GBxxxxx) from the Official Predicted Gene Set (GLEAN3) is provided (BeeBase, http://racerx00.tamu.edu/bee_resources.html), otherwise the GenBank accession number is provided.
By default, in relation to Build 2.1 statistics (http://www.ncbi.nlm.nih.gov/).
Many beeESTs had small (< 0.05) unadjusted P-values (n = 182 brains; n = 262 abdomens), but only four had significant q-values. The distribution of q-values showed a large gap between the few that were significant (<< 0.03) and the vast majority that were non-significant (> 0.10) values. This discontinuity in q distribution indicates that the differentially expressed gene set is clearly distinguished from the constantly expressed (or non-expressed) gene set.
As was apparent from visualizing the probe-level data (Fig. 2), the top-20 most informative genes show a trend towards up-regulation in WTs (Table 1). This pattern is present in brain (16 of 20; = 2.74, P = 0.097) and abdominal (19 of 20; = 8.03; P = 0.005) experiments. As expected at only 4 days old, there were no massive differences in gene expression between AN and WT strains. No top-20 genes showed expression differences vastly greater than twofold (i.e. where M >> 1). This tight variance in expression ratio is in contrast to variation in average intensity, which did range more than 10-fold among the top-20 genes: A-values ranged from 7.6 to 12.5 for brain, and 8.2 to 11.9 for abdomens (in log2 scale).
Discussion
We have identified a set of three genes that are differentially expressed between WT and AN workers: a Niemann–Pick type C2 homologue and two major royal jelly proteins. NPC2-like is the only gene that is significantly differentially expressed in abdominal tissue, and is up-regulated in WT relative to AN. MRJP2 and MRJP7 are the only genes significantly differentially expressed in head tissue, and are also up-regulated in WT, relative to AN (Table 1).
Our interest is to find genes that are differentially expressed between young WT and AN workers before ovary activation per se is apparent. The two strains show strong genetically determined differences in their proclivity to activate ovaries and lay eggs: WTs are functionally sterile, while ANs typically activate their ovaries and lay large numbers of viable eggs (Oldroyd et al., 1994; Oldroyd & Osborne, 1999). Genes differentially expressed between young WT and AN workers should therefore include those that regulate the conditional expression of worker sterility. We screened roughly 40% of genes in the honey bee genome (Whitfield et al., 2002; Honey Bee Genome Sequencing Consortium, 2006) and found, after applying a strong correction for false positives, a very small proportion of them (< 0.1%) were statistically differentially expressed. Though our screen was not comprehensive, by design it targeted genes specifically associated with onset of conditional expression of worker sterility.
As a general trend, the most informative genes (Table 1; Fig. 2) tended to be up-regulated in WTs. This observation falsifies a null expectation for symmetry of expression data, and suggests that functional sterility in honey bee workers may generally result from the expression of a suite of genes that effectively ‘switch’ ovaries off early in adult development. In normal WT colonies, the environmental cue mediating this switch is the presence of a functional queen and her brood, as signalled (Keller & Nonacs, 1993) by queen and brood pheromone (Hoover et al., 2003). Exposure to queen pheromone does strongly affect gene expression in worker brains (Grozinger et al., 2003). This ‘genes-on-to-switch-off’ reproduction hypothesis has some additional support, as Evans & Wheeler (2000) noted that as larvae develop into sterile workers they up-regulate many more genes than do larvae developing into reproductive queens. The reproductive state (with ovaries activated) may therefore be the developmental default for both workers and queens. If so, then departures from default would normally be effected by pheromonal cues, or in the case of AN workers, by a mutation that affects the threshold response to such cues (Barron et al., 2001; Oldroyd et al., 2001).
The differential expression of NPC2-like, MRJP2 and MRJP7 between WT and AN workers is probably symptomatic of a fundamental difference in the reproductive development of these two strains. Though the precise reason for their differential expression in the current study is not yet known, MRJPs are known to mediate reproductive maturation and the expression of honey bee social behaviour at several levels. First, at an ultimate level MRJPs are coevolved with Apis eusociality (Drapeau et al., 2006a), implying an intimate association between the biological function of MRJP genes, and the expression of social traits, especially alloparental care and sterility. The Yellow gene family from which MRJPs are derived (pfam03022) is widespread within the Arthropoda, but MRJPs are currently unknown beyond the genus Apis. It is noteworthy that A. mellifera, A. cerana, A. dorsata and A. florea are all highly eusocial (Michener, 1974), and all have genes encoding MRJPs (Albertova et al., 2005; Imjongjirak et al., 2005; Su et al., 2005). Whether the phylogenetic association between sociality and MRJPs is significant has not yet been tested, but the apparent coevolution between the two characters suggests that certain MRJPs evolved to help signal or regulate the expression of social traits, possibly including worker sterility. Some Yellow/MRJP genes do have regulatory roles (Maleszka & Kucharski, 2000) and their expression in the head (or brain) here does suggest a role in behaviour.
Second, and at a proximate level, MRJPs are synthesized by young nonreproductive workers and incorporated into royal jelly (RJ), or ‘brood food’– a major determinant of caste differentiation, and thus a major determinant of an individual's direct reproductive potential. Larvae fed large amounts of RJ beyond a critical period (about 3 days) develop into highly fecund queens, the rest develop into barren workers (Seeley, 1985). It is possible that ANs and WTs differ in their response to this nutritional cue during larval development, with ANs developing queen-like reproductive traits (Beekman & Oldroyd, 2003). This would not, however, explain why 4 day olds reared in a common WT host colony would show expression differences at MRJP2 and MRJP7 loci. A more likely explanation emerges when we consider that 4 day olds are producers of RJ, rather than recipients. The synthesis of RJ by nurse-age workers, and its subsequent provision to the queen and her brood is a form of kin-selected alloparental care. The expression of MRJP2 and MRJP7 in WT workers presumably reflects the typical production of these two MRJPs. They would likely use the synthesized protein to provision the larvae. The relative down-regulation of these two RJ proteins in AN workers, by contrast, reflects the tendency for this strain to generally abandon altruistic helping, including alloparental care (Dampney et al., 2004), in favour of selfish egg laying (Barron et al., 2001). ANs differ from WTs through a ‘syndrome’ of traits related to ovary activation and worker sterility, including reduced sensitivity to pheromones produced by queens (Oldroyd et al., 2001; Hoover et al., 2005) and by brood (Oldroyd et al., 2001), which generally result in dysfunctional colonies that cannot sustain themselves (Barron et al., 2001).
Though probably not a direct primer of ovary deactivation or sterility per se, our observation that MRJP2 and MRJP7 are expressed in WTs suggests that the upward expression of these two proteins is at least temporally associated with the conditional expression of sterility. These two genes occur side-by-side in the honey bee genome as part of a tandem series of 10 MRJPs on linkage group 11. MRJPs are likely derived via gene duplication of an ancestral yellow-e3 gene (Drapeau et al., 2006a). Their physical linkage and coregulation in the present study suggests that MRJP2 and MRJP7 could be coregulated components in a pathway related to the expression of worker sterility. If MRJPs retain ancestral functions inherited from their Yellow progenitors, then they may well be key players in reproductive development, as they are in flies and ants (Drapeau et al., 2006b). In addition, we note the presence of additional MRJP genes among the top-20 set for brains (Table 1), including MRJP3, MRJP4 and MRJP5. In total, this set represents five of the nine protein-encoding genes that make up the MRJP gene family.
The involvement of an NPC2-like gene in a pathway associated with the regulation of worker sterility is harder to assess, because its function in honey bees is not known. None the less, it too seems to play a part in nutrition, and thus could likewise play a part in the mechanics of honey bee sociality (Seeley, 1985). As the only gene significantly up-regulated in abdomens, this protein's NPC2 domain presumably binds lipids and cholesterols in honey bees as it does in flies, mosquitoes and mammals. In humans, mutations at this eponymous locus cause a type of lipid-storage disorder called Niemann–Pick disease (Garver & Heidenreich, 2002). Not previously implicated as important to honey bee reproduction or sociality, the NPC2-like gene identified here, via two experimentally independent differentially expressed beeESTs (Table 1), is a new candidate component for the deactivation of worker ovaries, and thus a new candidate for the regulation of worker sterility in honey bees.
Towards a molecular definition of worker sterility
The co-occurrence of castes with alloparental care is the essential criterion that defines honey bee eusociality (Michener, 1974). MRJPs are involved in the evolution and expression of both of these traits, and are thus intimately linked to reproductive altruism and indirect reproduction by honey bees. The down-regulation of NPC2-like, MRJP2 and MRJP7 in 4-day-old AN workers suggests that these genes are actively linked to the reproductive status of individuals. Moreover, they appear to be regulated directly or indirectly by the underlying mutation present in the AN strain that causes workers to effectively ignore the normal semiochemical cues for ovary deactivation.
MRJPs are similar to vitellogenin in being proteins important to the evolution of eusociality (Amdam et al., 2003, 2006). Like MRJPs, vitellogenin is synthesized by nonreproductive workers and incorporated into RJ (Engels, 1974). Whether ANs overexpress vitellogenin could not be tested in the present study because unfortunately this gene is not represented on the array (Whitfield et al., 2002). However, an independent study that used a quantitative polymerase chain reaction (PCR) assay to test the expression of vitellogenin as a function of ovary activation in honey bee workers (Koywiwattrakul et al., 2005) found that vitellogenin is overexpressed in ovary activated workers, albeit in abdomens not brains, relative to workers whose ovaries had been experimentally inhibited. It is conceivable therefore that both MRJPs and vitellogenin are part of a single pathway regulating the honey bee reproductive division of labour.
The next step in this line of research is to study these genes in isolation and deduce their function and interdependence. Moreover, though the underlying mutation that caused our candidates to be differentially expressed has not yet been mapped, the candidates do represent new positional targets for future mapping studies. We currently have such studies in progress and, together with functional tests of individual genes, and the derivation of new hypothetical models of gene action, we hope to help deduce the yet-to-be-described molecular pathway that regulates functional sterility in honey bee workers. The future description of this pathway will be of profound theoretical significance.
Experimental procedures
Biological material and ovary assay
To obtain biological material for the microarray we incubated sealed brood combs containing emerging adult workers removed from WT (n = 2) and AN (n = 2) colonies, at 35 °C overnight. The following morning, we paint-marked ≈ 800 adult workers of each genotype of each colony and fostered them into unrelated queenright WT (n = 2) and AN (n = 2) host colonies, creating a total of 16 within-colony WT vs. AN contrasts. After 4 days we collected a subsample (n = 10) of same-colour workers from each host colony and snap-froze them in liquid N2 to stabilize their RNA in tissue. Importantly, 4-day-old workers show no sign of ovary activation, and so genes that are differentially expressed between WT and AN workers at this age are not due to the presence of oocytes. Rather we sought genes that are differentially expressed prior to the appearance of eggs as these are likely to be the genes that prevent ovary activation in WT workers. After 16 days, when the proportion of ovaries activated is highest (personal observations), we collected all remaining paint-marked bees and scored their ovaries as activated (visible ova), or not (after Dade, 1977). We assessed differences in ovary activation between WT and AN strains reared within single colonies using contingency table analyses. A second cross-fostering experiment was performed with a different set of WT and AN colonies in the following year.
RNA extraction
We extracted RNA from each year's (2004, 2005) 4-day-old sample group whose older siblings (same colour and genotype, but allowed to mature to 16 days) showed the greatest difference in ovary activation. We extracted RNA from these individuals from both abdominal tissue and brain tissue separately, using a modified Trizol/Qiagen protocol as described in Koywiwattrakul et al. (2005). For abdomens, we extracted RNA from whole abdomens (minus appendages) then pooled standardized aliquots of RNA to yield two composite RNA samples: one representing WT, the other AN. For brain tissue, we pooled dissected (cf. Kucharski & Maleszka, 2003), individual brains prior to the RNA extraction. In each case, we used 500 ng of RNA as input for fluor-labelled cDNA synthesis.
Fluorescent cDNA synthesis
We synthesized, amplified and fluorescently labelled cDNA using the Low RNA Input Fluorescent Linear Amplification Kit (Agilent Technologies, Palo Alto, CA, USA). We poly(A)+ selected mRNA transcripts and reverse transcribed them into double-stranded cDNAs using a T7 promotor primer and MMLV reverse transcriptase. We then generated unlabelled cRNA from cDNA using T7 RNA polymerase, then purified this amplified product using spin filtration (QIAGEN's RNeasy Mini Kit). We converted 500 ng of cRNA into fluorescently labelled cDNA using MMLV reverse transcriptase, random hexamer primers, and cyanine 3-dCTP (Cy3; 532 nm) or cyanine 5-dCTP (Cy5; 635 nm) fluorescent labelling. We combined alternately labelled cDNA samples, purified them by spin filtration (QIAGEN's QIAquick PCR Purification Kit), and eluted the labelled cDNA mixture in a single 45-litre volume of Qiagen Buffer EB prior to hybridization on to the arrays.
Comparative genomic hybridizations
To hybridize labelled cDNA on individual arrays we combined 42.5 L eluate (containing Cy3 and Cy5 labelled probes), 7.5 µl 20 × SSC, and 50.0 µl ExpressHyb hybridization buffer (BD Biosciences Clontech, Palo Alto, CA, USA). This 100-litre hybridization mixture was heat-denatured (90 °C, 2 min), centrifuged (13 000 g, 2 min), and immediately dispensed on to the array's glass substrate and covered with a glass slip. We encased each substrate-based reaction within a Corning CMT hybridization chamber, which was then incubated (62 °C, 4–6 h). Following incubation, we performed a series of stringency washes on the arrays (2 × SSC 0.1% SDS; 2 × SSC; 0.1 × SSC) and spun-dried (500 r.p.m., 2 min) each array prior to acquiring fluorescent images of hybridization signal. We used a direct design (cf. Yang & Speed, 2002) for comparative cDNA hybridizations. Specifically, we compared WT and AN mRNAs using two pairs of dye-swap hybridizations, where each dye-swap pair represents a biological replicate obtained in a different pair of colonies in a separate year. This design was applied to brain and abdominal tissue separately. Following background correction and data normalization (described below) we calculated differential expression for each gene as a fold-change, namely, the log-ratio of hybridization signal intensities: M = log2 (WT/AN).
Microarray analysis
The arrays used in this experiment were printed from a normalized and subtracted beeEST library. Details of the source library and array manufacture are described in Whitfield et al. (2002, 2003). We scanned each hybridized array using an Affymetrix 428 Array Scanner (MWG Biotech, High Point, NC, USA) to produce a digitized image of ‘red’ and ‘green’ fluorescence intensity data for each spot (n = 19 200) on each array (total of eight). We captured and exported red–green data from TIFF images using the image analysis software ScanAlyse (v2.5; Michael Eisen, Stanford University). We used these data to assess general hybridization quality from standard diagnostic plots applicable to two-colour arrays (Yang & Paquet, 2005).
Data normalization included two preprocessing steps. First, we corrected against nonspecific (background) hybridization in each channel using the ‘adaptive’ method of Smyth (2005). Second, we added to the background-corrected intensities a positive constant (= 50) to dampen spurious variation in log-ratios, particularly at low intensity spots. We accounted for further intensity dependent biases as well as spatial biases in hybridization signal by fitting loess (locally weighted) regressions (cf Cleveland & Devlin, 1988) through M vs. A plots for each print-tip group (n = 48) on each array (where A = log intensity = log2√WT•AN), and used as normalized M-values the residuals from these regressions. Further, we scale normalized between arrays so that each array had the same average intensity (Smyth, 2005).
We estimated the fold-change in expression and its standard error for each gene by fitting a linear regression to the normalized expression data using least squares (Smyth, 2004; Yang & Speed, 2003). The linear model incorporates the dye-swap design as a covariate, and uses information from duplicated spots, following the estimation of a common gene-wise expression value (Smyth et al., 2005). As recommended (Smyth, 2004), we applied a Bayesian smoothing procedure to ‘shrink’ the estimated standard errors, and from the ratio of M-values to their standard errors calculated a moderated t-statistic for each gene (Smyth, 2004). We identified significant genes by their associated P-value, following an adjustment for multiple comparisons which strongly controls for false discovery rate (q-values; Benjamini & Hochberg, 1995).
All preprocessing, normalization, and fold change calculations were performed using the software limma (v2.4.7 Smyth, 2005) available through the Bioconductor project (Gentleman et al., 2004).
Bioinformatic characterization of candidate genes
Following identification of differentially expressed genes from the arrays, we used the Blast family of search functions (http://www.ncbi.nlm.nih.gov) to detect homology between probe cDNAs of interest and the honey bee genome (versions 2.0–4.0; http://www.ncbi.nlm.nih.gov/genome/guide/bee), as well as to detect homology between honey bee gene sequence and that of other organisms. Probe sequence was mapped to its genomic locus, where known, using NCBI's Honey Bee Map Viewer. We also queried the molecular function of candidate genes with reference to published information on these genes or their homologues.
Acknowledgments
We thank Michael Duncan and Julie Lim for help with bees and bee dissections, Sylvain Forêt and Jean Yee Hwa Yang for advice on statistical analysis of array data. We also thank Jürgen Paar and Peter Oxley for useful discussion.
Supplementary material
The following material is available for this article online:
Summary plots of normalized expression data for a) brain and b) abdomen experiments. Comparative boxplots of M-values by array and experiment, and MA-plots of combined data, where M = log2 ratio and A = log2 intensity. Comparative boxplots show that the spread of M-values are roughly similar between arrays, and composite MA-plots are roughly symmetric about M = 0.
This material is available as part of the online article from http://www.blackwell-synergy.com
References
- Albertova V, Su SK, Brockmann A, Gadau J, Albert T. Organization and potential function of the mrjp3 locus in four honeybee species. J Agric Food Chem. 2005;53:8075–8081. doi: 10.1021/jf051417x. [DOI] [PubMed] [Google Scholar]
- Amdam GV, Norberg K, Hagen A, Omholt SW. Social exploitation of vitellogenin. Proc Natl Acad Sci USA. 2003;100:1799–1802. doi: 10.1073/pnas.0333979100. [DOI] [PMC free article] [PubMed] [Google Scholar]
- Amdam GV, Csondes A, Fondrk MK, Page RE. Complex social behaviour derived from maternal reproductive traits. Nature. 2006;439:76–78. doi: 10.1038/nature04340. [DOI] [PMC free article] [PubMed] [Google Scholar]
- Barron AB, Oldroyd BP, Ratnieks FL.W. Worker reproduction in honey-bees (Apis) and the anarchic syndrome: a review. Behav Ecol Sociobiol. 2001;50:199–208. [Google Scholar]
- Beekman M, Oldroyd BP. Effects of cross-feeding anarchistic and wild type honey bees: anarchistic workers are not queen-like. Naturwissenschaften. 2003;90:189–192. doi: 10.1007/s00114-003-0406-7. [DOI] [PubMed] [Google Scholar]
- Benjamini Y, Hochberg Y. Controlling the false discovery rate – a practical and powerful approach to multiple testing. J R Stat Soc Series B-Methodol. 1995;57:289–300. [Google Scholar]
- Butler CG. The control of ovary development in worker honeybees (Apis mellifera) Experientia. 1957;13:256–257. doi: 10.1007/BF02157449. [DOI] [PubMed] [Google Scholar]
- Cleveland WS, Devlin SJ. Locally weighted regression – an approach to regression-analysis by local fitting. J Am Stat Assoc. 1988;83:596–610. [Google Scholar]
- Dade HA. Anatomy and Dissection of the Honeybee. London: International Bee Research Association; 1977. [Google Scholar]
- Dampney JR, Barron AB, Oldroyd BP. Measuring the cost of worker reproduction in honeybees: work tempo in an ‘anarchic’ line. Apidologie. 2004;35:83–88. [Google Scholar]
- Drapeau MD, Albert S, Kucharski R, Prusko C, Maleszka R. Evolution of the Yellow/Major Royal Jelly Protein family and the emergence of social behavior in honeybees. Genome Res. 2006a doi: 10.1101/gr.5012006. in press. [DOI] [PMC free article] [PubMed] [Google Scholar]
- Drapeau MD, Cyran SA, Viering MM, Geyer PK, Long AD. A cis-regulatory sequence within the yellow locus of Drosophila melanogaster required for normal male mating success. Genetics. 2006b;172:1009–1030. doi: 10.1534/genetics.105.045666. [DOI] [PMC free article] [PubMed] [Google Scholar]
- Engels W. Occurrence and significance of vitellogenins in female castes of social Hymenoptera. Am Zool. 1974;14:1229–1237. [Google Scholar]
- Evans JD, Wheeler DE. Expression profiles during honeybee caste determination. Genome Biol. 2000;2:1. doi: 10.1186/gb-2000-2-1-research0001. research0001.1–0001.6. [DOI] [PMC free article] [PubMed] [Google Scholar]
- Garver WS, Heidenreich RA. The Niemann-Pick C Proteins and trafficking of cholesterol through the late endosomal/lysosomal system. Curr Mol Med. 2002;2:485–505. doi: 10.2174/1566524023362375. [DOI] [PubMed] [Google Scholar]
- Gentleman RC, Carey VJ, Bates DM, Bolstad B, Dettling M, Dudoit S, et al. Bioconductor: open software development for computational biology and bioinformatics. Genome Biol. 2004;5:R80. doi: 10.1186/gb-2004-5-10-r80. [DOI] [PMC free article] [PubMed] [Google Scholar]
- Grozinger CM, Sharabash NM, Whitfield CW, Robinson GE. Pheromone-mediated gene expression in the honey bee brain. Proc Natl Acad Sci USA. 2003;100:14519–14525. doi: 10.1073/pnas.2335884100. [DOI] [PMC free article] [PubMed] [Google Scholar]
- Hamilton WD. The genetical evolution of social behaviour, I and II. J Theor Biol. 1964;7:1–52. doi: 10.1016/0022-5193(64)90038-4. [DOI] [PubMed] [Google Scholar]
- Honey Bee Genome Sequencing Consortium. Insights into social insects from the genome of the honeybee Apis mellifera. Nature. in press. [DOI] [PMC free article] [PubMed]
- Hoover SER, Keeling CI, Winston ML, Slessor KN. The effect of queen pheromones on worker honey bee ovary development. Naturwissenschaften. 2003;90:477–480. doi: 10.1007/s00114-003-0462-z. [DOI] [PubMed] [Google Scholar]
- Hoover SER, Oldroyd BP, Wossler TC, Winston ML. Anarchistic queen honey bees have normal queen mandibular pheromones. Insectes Soc. 2005;52:6–10. [Google Scholar]
- Imjongjirak C, Klinbunga S, Sittipraneed S. Cloning, expression and genomic organization of genes encoding Major Royal Jelly Protein 1 and 2 of the honey bee (Apis cerana) J Biochem Mol Biol. 2005;38:49–57. doi: 10.5483/bmbrep.2005.38.1.049. [DOI] [PubMed] [Google Scholar]
- Keller L, Nonacs P. The role of queen pheromones in social insects: queen control or queen signal? Anim Behav. 1993;45:787–794. [Google Scholar]
- Koywiwattrakul P, Thompson GJ, Sittipraneed S, Oldroyd BP, Maleszka R. Effects of carbon dioxide narcosis on ovary activation and gene expression in worker honey bees, Apis mellifera. J Insect Sci. 2005;5:36. doi: 10.1093/jis/5.1.36. insectscience.org/5.36. [DOI] [PMC free article] [PubMed] [Google Scholar]
- Kucharski R, Maleszka R. Transcriptional profiling reveals multifunctional roles for transferrin in the honeybee, Apis mellifera. J Insect Sci. 2003;3:27. doi: 10.1093/jis/3.1.27. insectscience.org/3.27. [DOI] [PMC free article] [PubMed] [Google Scholar]
- Maleszka R, Kucharski R. Analysis of Drosophila yellow-B cDNA reveals a new family of proteins related to the Royal Jelly proteins in the honeybee and to an orphan protein in an unusual bacterium Deinococcus radiodurans. Biochem Biophys Res Commun. 2000;270:773–776. doi: 10.1006/bbrc.2000.2506. [DOI] [PubMed] [Google Scholar]
- Michener CD. The Social Behavior of the Bees. Cambridge, MA: Harvard University Press; 1974. [Google Scholar]
- Montague CE, Oldroyd BP. The evolution of worker sterility in honey bees: an investigation into a behavioral mutant causing failure of worker policing. Evolution. 1998;52:1408–1415. doi: 10.1111/j.1558-5646.1998.tb02022.x. [DOI] [PubMed] [Google Scholar]
- Oldroyd BP, Osborne KE. The evolution of worker sterility in honeybees: the genetic basis of failure of worker policing. Proc R Soc Lond B. 1999;266:1335–1339. [Google Scholar]
- Oldroyd BP, Smolenski AJ, Cornuet JM, Crozier RH. Anarchy in the beehive. Nature. 1994;371:749–749. [Google Scholar]
- Oldroyd BP, Wossler TC, Ratnieks FLW. Regulation of ovary activation in worker honey-bees (Apis mellifera): larval signal production and adult response thresholds differ between anarchistic and wild-type bees. Behav Ecol Sociobiol. 2001;50:366–370. [Google Scholar]
- Seeley TD. Honeybee Ecology: A study of adaptation in social life. Princeton, NJ: Princeton University Press; 1985. [Google Scholar]
- Smyth GK. Linear models and empirical Bayes methods for assessing differential expression in microarray experiments. Stat Appl Gen Mol Biol. 2004;3 doi: 10.2202/1544-6115.1027. Article 3. [DOI] [PubMed] [Google Scholar]
- Smyth GK. Limma: linear models for microarray data. In: Gentleman R, Carey V, Dudoit S, Irizarry R, Huber W, editors. Bioinformatics and Computational Biology Solutions Using R and Bioconductor. New York: Springer; 2005. pp. 397–420. [Google Scholar]
- Smyth GK, Michaud J, Scott HS. Use of within-array replicate spots for assessing differential expression in microarray experiments. Bioinformatics. 2005;21:2067–2075. doi: 10.1093/bioinformatics/bti270. [DOI] [PubMed] [Google Scholar]
- Su SK, Albert S, Chen SL, Zhong BX. Molecular cloning and analysis of four cDNAs from the heads of Apis cerana cerana nurse honeybees coding for major royal jelly proteins. Apidologie. 2005;36:389–401. [Google Scholar]
- Visscher PK. A quantitative study of worker reproduction in honey bee colonies. Behav Ecol Sociobiol. 1989;25:247–254. [Google Scholar]
- Whitfield CW, Band MR, Bonaldo MF, Kumar CG, Liu L, Pardinas JR, Robertson HM, Soares MB, Robinson GE. Annotated expressed sequence tags and cDNA microarrays for studies of brain and behavior in the honey bee. Genome Res. 2002;12:555–566. doi: 10.1101/gr.5302. [DOI] [PMC free article] [PubMed] [Google Scholar]
- Whitfield CW, Cziko AM, Robinson GE. Gene expression profiles in the brain predict behavior in individual honey bees. Science. 2003;302:296–299. doi: 10.1126/science.1086807. [DOI] [PubMed] [Google Scholar]
- Winston ML. The Biology of the Honeybee. Cambridge, MA: Harvard University Press; 1987. [Google Scholar]
- Yang YH, Paquet AC. Preprocessing two-color spotted arrays. In: Gentleman R, Carey V, Dudoit S, Irizarry R, Huber W, editors. Bioinformatics and Computational Biology Solutions Using R and Bioconductor. New York: Springer; 2005. pp. 49–69. [Google Scholar]
- Yang YH, Speed T. Design issues for cDNA microarray experiments. Nat Rev Genet. 2002;3:579–588. doi: 10.1038/nrg863. [DOI] [PubMed] [Google Scholar]
- Yang YH, Speed TP. Design and analysis of comparative microarray experiments. In: Speed TP, editor. Statistical Analysis of Gene Expression Microarray Data. FL: Chapman & Hall/CRC Press; 2003. pp. 35–91. [Google Scholar]
Associated Data
This section collects any data citations, data availability statements, or supplementary materials included in this article.
Supplementary Materials
Summary plots of normalized expression data for a) brain and b) abdomen experiments. Comparative boxplots of M-values by array and experiment, and MA-plots of combined data, where M = log2 ratio and A = log2 intensity. Comparative boxplots show that the spread of M-values are roughly similar between arrays, and composite MA-plots are roughly symmetric about M = 0.