SYNOPSIS
Objective.
Survey instruments for evaluating public health preparedness have focused on measuring the structure and capacity of local, state, and federal agencies, rather than linkages among structure, process, and outcomes. To focus evaluation on the latter, we evaluated the linkages among individuals, organizations, and systems using the construct of “connectivity” and developed a measurement instrument.
Methods.
Results from focus groups of emergency preparedness first responders generated 62 items used in the development sample of 187 respondents. Item reduction and factors analyses were conducted to confirm the scale's components.
Results.
The 62 items were reduced to 28. Five scales explained 70% of the total variance (number of items, percent variance explained, Cronbachapos;s alpha) including connectivity with the system (8, 45%, 0.94), coworkers (7, 7%, 0.91), organization (7, 12%, 0.93), and perceptions (6, 6%, 0.90). Discriminant validity was found to be consistent with the factor structure.
Conclusion.
We developed a Connectivity Measurement Tool for the public health workforce consisting of a 34-item questionnaire found to be a reliable measure of connectivity with preliminary evidence of construct validity.
The terrorist attacks of September 11, 2001, prompted a national effort to prepare for the threat of international terrorism directed at targets in the United States. Recognizing the need to quickly and effectively coordinate this massive effort, and the many government agencies involved, the U.S. Congress passed the Homeland Security Act of 2002. This Act led to the establishment of the Department of Homeland Security, whose mission was to create one centralized agency. However, the natural tendency for government agencies to operate in keeping with their own very separate organizational frameworks, to compete for budget authority and autonomy, and to adhere to the primacy of their own defined missions frustrated the intention to quickly assemble one cohesive, integrated, focused, new government agency.1
The limitations of compressing all homeland security efforts into one agency became further frustrated by the fact that the activity and responsibility remained with agencies separate from this new Department of Homeland Security. These other agencies include the U.S. Northern Command, U.S. Department of Defense, the Centers for Disease Control and Prevention, and the U.S. Department of Health and Human Services. In addition, it became clear that emergency response itself is fundamentally a local activity. The responsible local and state municipal agencies have benefited in recent years from increased funding from the federal government, providing the opportunity for a buildup in the relationships, knowledge, and assets that can immediately manage the critical early moments of a crisis.2 Inevitably, then, emergency preparedness and response are in the province of numerous agencies, each of which could very well serve to promote and pursue its own priorities, operating procedures, and functioning.3
In practice, while government agencies and their staffs might effectively succeed in their individual tasks and activities, immediate response to a national emergency requires a seamless coordination of effort among all functional units. In those first critical moments of an emergency, numerous jurisdictions and agencies with different yet overlapping responsibilities must quickly coalesce. Even more critical, because the time and location of most emergencies are not predictable, agencies that may have no time to prepare must quickly leverage required information, assets, and response capacity, closely coordinating efforts in reaction to the immediate situation on the ground.
What quality of effort will be required in that moment? To help answer this question, we have defined the organizing construct “connectivity” to represent “a seamless web of people, organizations, resources, and information that can best catch, contain, and recover from a terrorist incident or other disaster.”4 The term connectivity has been used previously in social network theory to describe the social cohesion or solidarity of a group of individuals as measured by the pattern of network ties.5 Social cohesiveness increases with the level of redundancy of interconnections among its members.6 Within the social network framework connectivity was defined as the minimum number of individuals whose removal would not allow the group to remain connected or would reduce the group to a single member.7
The basis for building an evaluation framework for connectivity into emergency response is simply that the time to plan for that connectivity is not in the moment of crisis. Rather, evaluation of connectivity for those with leadership and operational responsibilities should be conducted during the precrisis, preparedness phase. And yet, without the urgency of an emergency, many agencies are reluctant to move beyond their own internal operational priorities to establish the necessary capacity to coordinate an effort that would result in a high degree of connectivity. This reluctance thus raises the level of local, and as a consequence, national vulnerability.
This observation raises the question of how to develop performance criteria against which the system can be challenged and assessed. Development of such criteria in the absence of a real event to test actual response capacity remains a point of considerable importance. Because the U.S. is in preparedness for a wide range of terrorist threats—nuclear, chemical, and biological—as well as naturally occurring disasters such as pandemic influenza, and because these incidents could occur anywhere in the country, it is impossible to identify an absolute gold standard against which a system';s preparedness can be judged. However, a number of analytical models have been proposed, including scenario-based metrics, capacity-based measures, and drills and exercises to challenge and test a system. Each has its strengths and weaknesses, and each ultimately serves as a predictive measure useful for answering the question of how well responders and the system designed to support them perform in an actual emergency.
The focus of our study and analysis rests on the assertion that no matter how much equipment, training, funding, or planning a system has under its command, these components will not optimally fulfill their functions if the system has not achieved a necessary level of connectivity—that human, person-to-person aspect of preparedness.8 For our evaluation framework, we have adopted the premise that if a system is not well connected, it will not be able to perform optimally during an event.9 Alternatively, if a system is well connected, it will more likely be able to effectively adapt itself as necessary, and to effectively improvise if the event itself is outside of the specific plans and contingencies that were previously in place. However, we also recognize that connectivity is necessary but not sufficient to a strong response.
The goal of our scaling for the connectivity instrument was to provide a quantifiable measure that would identify when individual functional units in the system would be less likely to be able to work together. By identifying low levels of connectivity, we believe that we can act in advance to provide an intervention that will allow organizations to better handle a mass casualty event that tests and extends their usual response capacity. The parallel assumption is that the country is preparing for events that will challenge usual response capacity, hence, requiring a massive national effort.10 As such, the primary objective of this study was to develop and validate an instrument to measure the level of connectivity of individuals, organizations, and systems to obtain a measure that could be used to evaluate preparedness and predict response performance.
METHODS
Conceptual model and item pool generation
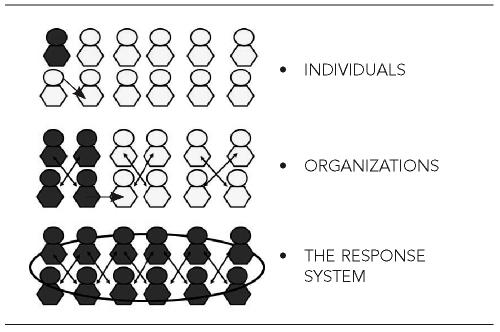
In pursuit of a measure of connectivity, we divided an individual's work contact into three primary sets of relationships. The first is with coworkers in the same functional unit within the organization, the second is within the organization itself, and the third is within the system in which the organization interacts. The term system is used here to characterize the group of interacting, interrelated agencies and organizations whose goal is to protect and improve the safety, welfare, and/or health of the community. We therefore directed our instrument development to include focus groups and item pool generation to reflect a conceptual model in which the level of preparedness in each of these three relationships was tested (Figure 1). We also adopted the assumption that system connectivity is important regardless of the amount of equipment or individual trainings received. Thus, all items were designed to evaluate connectivity from the perspective of linkages among individuals and their respective coworkers, organizations, and systems.
Figure 1.
Conceptual model: individual, organizational, and system connectivity
Legend: The arrows represent the relationships between individuals and organizations. In the first drawing, “individuals,” the arrows represent how the employee (shaded image) connects to the coworkers, and how coworkers connect to each other. In the second drawing, “organizations,” the arrows indicate how the connections develop within an organization, and how the organization works and relates outside of itself. Shaded individuals belong to the same organization. In the third drawing, “response system,” the arrows indicate the response team and how the many organizations in the team come together as one unit (i.e., all agencies working in concert in response to an event).
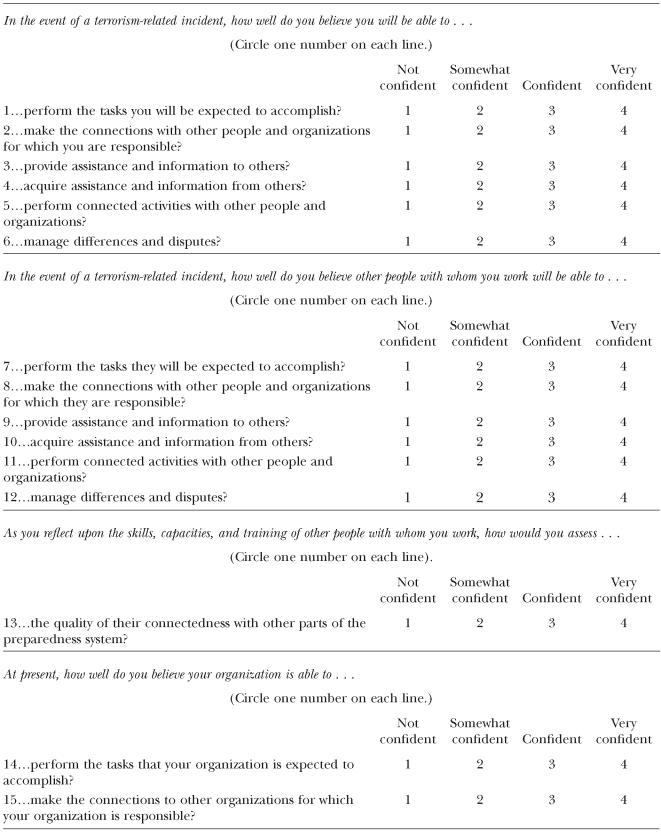
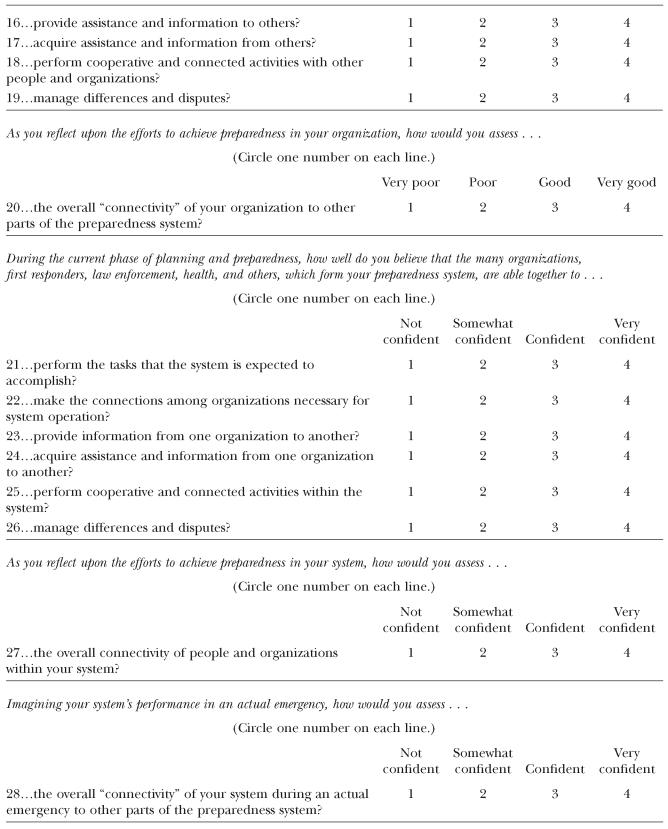
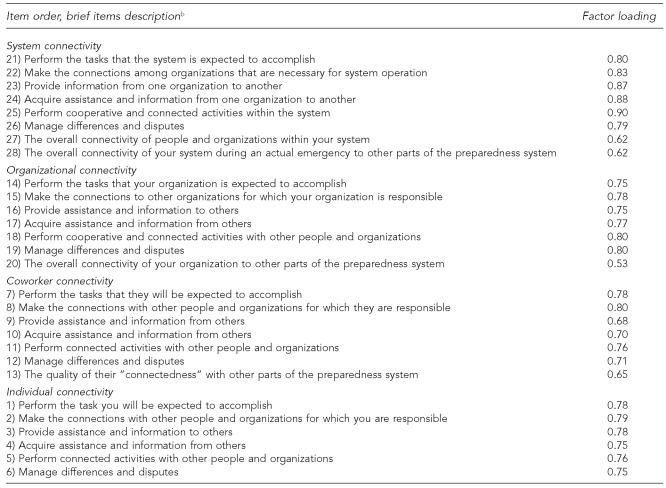
The specific items that make up the Connectivity Measurement Tool (CMT) were generated from six focus groups held with first responders in local cities and towns. After the focus groups were convened, a panel of experts from the Harvard Center for Public Health Preparedness met four times, vetted 62 questions, and made recommendations about grouping the questions according to the conceptual model. The initial instrument was then redistributed to groups of first responders, who gave their input as to the clarity of the questions and the content validity of the instrument. Subsequent analysis suggested the deletion of 34 items resulting in a final instrument that consists of 28 items (Figure 2). In addition to completing the CMT, respondents also completed a brief demographic questionnaire including age, gender, profession/occupation, years worked in the current job position, and type of organization where employed.
Figure 2.
Connectivity measurement tool
Description of items in development sample
Six items addressed the individual ability to connect with other people and organizations. Seven items described the individuals' perception of their coworkers' ability to connect with other people and organizations. Seven items described the level of connectivity of the organization in which the respondent was employed. Eight items addressed the level of connectivity of the many organizations forming the preparedness system. Full item wording and scaling is given in Figure 2. For each item, respondents indicated their level of confidence on their individual, organizational, or system ability to perform each specific function, using a four-point Likert scale (1 = not confident, 2 = somewhat confident, 3 = confident, 4 = very confident) or their judgment on a given statement (1 = very poor, 2 = somewhat poor, 3 = good, 4 = very good).
Study participants
The study population comprised 187 individuals who attended leadership training sessions given by faculty of the Harvard School of Public Health Center for Public Health Preparedness in the states of Massachusetts and Maine in April and May 2005. Respondents completed the connectivity questionnaires during the training program.
Statistical methods
Internal consistency of multi-item scales was calculated by means of Cronbach's alpha.11 Correlations were determined by Pearson's product moment coefficient. The empirical structure of the scales was determined by principal components analysis. The Kaiser-Guttman rule (eigenvalue>1) and the amount of variance explained (>70%) were used to determine the number of factors to be retained. Factors were rotated using varimax rotation. To compute the factor score for a given factor, we took the case's standardized score in each variable, multiplied this value by the corresponding factor loading of the variable for the given factor, and summed the products.12 Mean values were compared using t-tests, and the effect size was estimated according to Cohen's interpretation.13 The statistical analysis was performed using the statistical package SPSS version 11.05.14
RESULTS
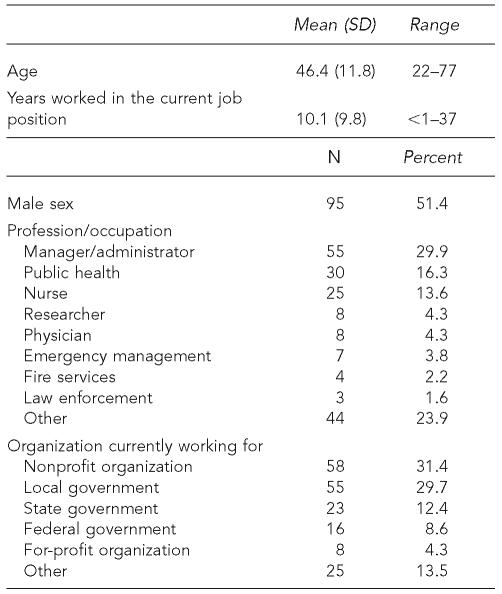
The respondent demographic variables are presented in Table 1. The sample was approximately equally distributed between males and females, who were on the average middle-aged, employed predominantly as managers, public health professionals, or nurses, and who in most cases were working for nonprofit organizations or for the state or local government.
Table 1.
Demographic characteristics of development sample (n=187)
SD = standard deviation
Empirical scale development
The 62-item CMT questionnaire completed by the developmental sample of 187 respondents was subjected to a principal components analysis. The four-factor solution (which accounted for 70% of the total variance) was found to be parsimonious, had good, simple structure, and could be meaningfully interpreted. CMT items with factor loadings greater than 0.40 were used to define the factors; considerations were also made about redundancy and structure simplicity. Abbreviated items and their corresponding factor loadings for the retained 28 items meeting these criteria are presented in Figure 3. Factor labels were generated for each factor, and their content is described in this article.
Figure 3.
Connectivity measurement tool questionnaire factor loadings
a Loadings following varimax rotation.
b Full-item wording and scaling in Figure 2.
The first factor consisted of eight items and accounted for 45% of the total variance. All eight items were related to system connectivity in terms of communication ability, connectivity skills, and specific training received. The second factor consisted of seven items that relate to organizational connectivity and explained 12% of the variance. The third factor included seven items describing the respondents' perception of their coworkers' level of connectivity. This factor accounted for 7% of the total variance and conceptually relates to individual connectivity and serves as an intermediary variable between the respondent's personal and organizational level of connectivity. The items in this factor relate to inter-individual connectivity within the individual's subunit within the organization. This fourth factor consisted of six items, explained 6% of the variance, and described the individual/respondent's perception of his/her level of connectivity. Subsequently, psychometric evaluation was performed on the empirically derived and constructed scales from the factor analysis.
Internal consistency
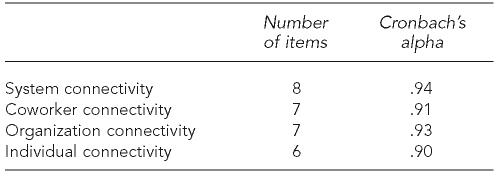
Cronbach's coefficient was calculated for the five CMT summary scales based upon the factor analysis, as well as for the total summative score based on all items. The overall measure of internal consistency for the total score was 0.95. All coefficients were 0.91 or higher. Results corresponding to each scale are shown in Table 2.
Table 2.
Internal consistency
CMT domain structure
In the conceptual model, we hypothesized that all scales were positively correlated with each other and that the items of the system connectivity component had a higher correlation with the items of the organizational component than with those of the individual component. The results supported our hypothesized structure: all items were positively correlated to each other and the correlation coefficients between the items of the system and those of the individual connectivity components ranged from 0.09 to 0.39 (p<0.001), while the correlation coefficients between the items of the system connectivity component and those of the organizational one ranged from 0.28 to 0.60 (p<0.001).
Approach to known group validity
The CMT is intended to identify differences in the level of connectivity of different organizations and systems. However, individual, organizational, and system connectivity are not attributes—such as height or weight—that are readily observable. The underlying factors computed by the factor analysis are referred to as hypothetical constructs. A construct is some postulated attribute of people, assumed to be reflected in test performance.15 In social science, a construct can also be thought of as a mini-theory to explain the relationships among attitudes, behaviors, and perceptions. Construct validation is an ongoing process of learning more about the construct, making new predictions, and then testing them. It is a process in which the theory and the measure are assessed at the same time.16
We developed three approaches to known group validity analysis, all based on comparisons of mean values in the identified factors' scores across categories such as professional role and type of organization. First, to analyze the system connectivity measurement, it was hypothesized that employees of different systems would have different levels of perceived system connectivity. The results of the known group validity analysis supported our hypothesis in that respondents working for the federal government reported a different perceived level of system connectivity (mean standard deviation [SD] 0.49 [0.82]) when compared to employees at the local (mean = –0.029 SD [1.04]) (t-test = 2.01, p=0.054) or state level (mean = –0.15 SD [0.94]) (t-test = 2.15, p=0.039). Effect size was considered to be of medium size for both comparisons (first Cohen's d=0.55 effect-size r=0.27, second Cohen's d=0.72 effect-size r=0.34). A marginally statistically significant difference in system connectivity was also found between fire services employees and law enforcement employees (Mann-Whitney test p=0.057).
The second approach focused on organizational connectivity. We hypothesized that differences in perceived organizational connectivity would be demonstrated between organizations with a very different organizational structure. The descriptive analysis suggested a difference between employees of the federal government and nonprofit organizations' employees; however, we failed to demonstrate a statistically significant difference. We also hypothesized that subjects working for the same organization would report similar levels of organizational connectivity. However, we could not test this hypothesis because respondents were not willing to report the name of the organization for which they worked.
The third approach assessed the individual connectivity component across professional roles. Physicians and law enforcement employees demonstrated a higher level of individual connectivity when compared to other professional categories. Fire services employees had the lowest level of perceived individual connectivity. However, the sample sizes were too small to identify statistically significant differences. No relationship was found between the level of individual connectivity and the years worked in the current job position, as hypothesized, not even when data were grouped by type of job.
DISCUSSION
In this research, we assume that connectivity is an important aspect of a public health system's preparedness: the better connected emergency responders are, the better they will be able to prepare for and manage the consequences of a disaster. Our framework for assessment posits that measuring connectivity is an integral part of evaluating public health preparedness. While the most valid measure of preparedness involves the ascertainment of outcomes, those outcomes generally cannot be measured empirically; disasters are thankfully rare. As such, it is important to identify potential predictors of outcomes.
In practice, connectivity is a function of both perception and behavior. Connectivity develops as a consequence of relationships with other agencies and professionals who are knowledgeable of roles and responsibilities, is based on practiced and successful experiences, and requires the mutual respect of connecting parties and organizations. Our instrument assesses what people believe to be their level of connectivity, rather than gathering objective evidence. As such, the instrument falls into the class of measures categorized as subjective perceptions. To the extent that these perceptions are predictive of actual behavior, knowing what people believe to be true is in fact useful. That factor—people's perceptions about connectivity—is the primary focus of our evaluation. Thus, the psychometric analysis results support the construct validity of the CMT.
In some circumstances, the subjective nature of our connectivity measure can compromise the results. It should be noted, for instance, that if those who complete the CMT perceive that their organizations will be rewarded or penalized if the results suggest that they are more or less connected (and hence prepared), the results may not be valid.
While we recognize that the proposed measure of connectivity has limitations, we believe that aggregated scores collected from a specific organization or system do provide data that can be used for comparative purposes. For example, preparedness levels in two different cities could be surveyed, and to the extent that there is a significant difference in self-reported perceptions of connectivity, one could with confidence reach a conclusion about the relative quality of working relationships in those cities. Furthermore, we are aware of no other proxies of actual connectivity that could be used to measure and predict what would occur in the midst of an actual response.
While evaluation during an actual emergency might be considered disruptive, doing so in the midst of a simulated exercise is acceptable and in fact an expected feature of a drill.
The work presented here represents the first step in that process—a method to measure connectivity as perceived across professional and agency lines. The next step in the research will require expansion of this tool to include assessment of performance pertinent to connectivity. To further validate the subjective perceptions of the CMT, we propose correlating the CMT with these expanded measures of performance obtained during an exercise or drill, as further validation will require correlating the findings of perceptions with the results of an exercise or drill. We hypothesize that systems that are better connected will perform more effectively and efficiently during an exercise, because they will be better able to share information and leverage resources.
Neither subjective perceptions of behavior derived from simulated drills nor exercises are actual measures of performance or outcomes. What people do during the artificial staging of an exercise could be very different from how they would respond in the midst of an actual emergency. Nevertheless, assessment and analysis of perceptions combined with performance measures from drills and exercises is a longstanding and validated method of evaluation. And in the absence of outcomes, data provide what is likely the most valid predictor of actual connectivity during an emergency. Future research of these combined measures of perceptions and drill performance will offer a new dimension to after-action reporting, and subsequent corrective actions for emergency and disaster planning.
CONCLUSION
The events of September 11 and the naturally occurring consequences of Hurricane Katrina have focused new attention on the importance of preparedness for the unique contingencies of unprecedented events. Such events, because they cannot call upon prior experience, demand that a response system manage contingencies whose scale, novelty, and impact challenge the capacity to cope with the event. While hurricanes, tornados, and a flu pandemic often provide some lead time for last-minute preparations, many large-scale disasters such as earthquakes and terrorism do not. Systems are required to respond with flexibility and resilience under conditions that require extensive improvisation. Measures that can reliably assess system strengths and weaknesses can prompt work to fix those weaknesses before they become a liability during a disaster.
The CMT presented in this article has demonstrated significant strength in assessing one essential aspect of preparedness: connectivity of information, resources, people, and organization. Given the lessons of Hurricane Katrina's response, why is this important? The failures of that response were not solely a function of a lack of food, water, or supplies to respond to disaster victims. Rather, the lag in the response was a function of human factors of leadership, disconnectivity among local, state, and federal leaders and agencies, and a lack of situational awareness that did not correlate the response to the size and scope of the disaster. Greater attention to strategic efforts to enhance connectivity represents one of the system improvements that could emerge out of the Katrina experience and that is timely in the face of a possible avian flu pandemic. This study attempted to advance the preparedness process by providing a tool that will not only measure connectivity, but also provide data that will motivate efforts to improve it.
REFERENCES
- 1.Lichtveld M, Cioffi J, Henderson J, Sage M, Steele L. People protected—public health preparedness through a competent workforce. J Public Health Manag Pract. 2003;9:340–3. doi: 10.1097/00124784-200309000-00002. [DOI] [PubMed] [Google Scholar]
- 2.McHugh M, Staiti AB, Felland LE. How prepared are Americans for public health emergencies? Twelve communities weigh in. Health Aff. 2004;23:201–9. doi: 10.1377/hlthaff.23.3.201. [DOI] [PubMed] [Google Scholar]
- 3.Bashir Z, Lafronza V, Fraser MR, Brown CK, Cope JR. Local and state collaboration for effective preparedness planning. J Public Health Manag and Pract. 2003;9:344–51. doi: 10.1097/00124784-200309000-00003. [DOI] [PubMed] [Google Scholar]
- 4.Marcus LJ, Dorn BC, Henderson JM. Meta-leadership and national emergency preparedness: a model to build government connectivity. Biosecur Bioterror. 2006;4:128–34. doi: 10.1089/bsp.2006.4.128. [DOI] [PubMed] [Google Scholar]
- 5.Scott J. 2nd ed. London: Sage Publications; 2000. Social network analysis: a handbook. [Google Scholar]
- 6.Hummon NP, Doreian P. Computational methods for social network analysis. Social Networks. 1990;12:273–88. [Google Scholar]
- 7.Schwartz JE, Sprinzen M. Structures of connectivity. Social Networks. 1984;6:103–40. [Google Scholar]
- 8.Kerby DS, Brand MW, Elledge BL, Johnson DL, Magas OK. Are public health workers aware of what they don't know? Biosecur Bioterror. 2005;3:31–8. doi: 10.1089/bsp.2005.3.31. [DOI] [PubMed] [Google Scholar]
- 9.Geiger HJ. Terrorism, biological weapons, and bonanzas: assessing the real threat to public health. Am J Public Health. 2001;91:708–9. doi: 10.2105/ajph.91.5.708. [DOI] [PMC free article] [PubMed] [Google Scholar]
- 10.Lurie N, Wasserman J, Stoto M, Myers S, Namkung P, Fielding J, et al. Local variation in public health preparedness: lessons from California. Health Aff. 2004;W4:341–53. doi: 10.1377/hlthaff.w4.341. [DOI] [PubMed] [Google Scholar]
- 11.Cronbach LJ. Coefficient alpha and the internal structure of tests. Psykometrika. 1951;16:297–333. [Google Scholar]
- 12.Dunteman GH. Principal components analysis: quantitative applications in the social sciences. Newbury Park (CA): Sage Books; 1989. [Google Scholar]
- 13.Cohen J. 2nd ed. Hillsdale (NJ): Lawrence Earlbaum Associates; 1988. Statistical power analysis for the behavioral sciences. [Google Scholar]
- 14.Chicago: SPSS Inc.; 2003. SPSS for Windows Rel. 12.0.0. [Google Scholar]
- 15.Cronbach LJ, Meehl PE. Construct validity in psychological tests. Psychol Bull. 1955;52:281–302. doi: 10.1037/h0040957. [DOI] [PubMed] [Google Scholar]
- 16.Streiner DL, Norman GR. Health measurement scales. New York: Oxford University Press; 1992. [Google Scholar]


