

Abstract
IGF-I is essential to normal brain growth and exerts actions on neural stem cells and each major neural cell lineage. Whereas many studies show that IGF-I regulates gene expression, mechanisms by which it modulates transcription have not been explored. Chromatin modifications, such as histone phosphorylation, acetylation, and methylation, are known to be important initial steps in gene regulation, and acetylation of histone H3 and H4 is associated with gene activation. In this study, we show that IGF-I modulates the acetylation of H3 and H4 histones in the brain of two transgenic mouse lines and that these effects are associated with activation of the phosphoinositide 3-kinase/Akt signaling pathway. This provides evidence that the chromatin architecture modification contributes to the action of IGF-I on gene expression in the mammalian central nerve system.
IGF-I is essential for normal mammalian brain growth and development (1–6). During embryonic life it stimulates neurogenesis by shortening the length of the cell cycle (7), whereas postnatally it inhibits apoptosis of neurons and oligodendrocytes (1). Other known IGF-I actions include the stimulation of myelination and neuritic outgrowth. Numerous studies, including microarray studies, have documented that IGF-I can up- or down-regulate the expression of multiple genes in many tissues, including the brain (8). Whereas much of IGF-I gene regulation is likely to be transcriptional, the mechanisms by which IGF-I regulates transcription have not been explored.
As a first step toward investigating the mechanisms by which IGF-I regulates gene expression in the brain, we asked whether IGF-I is capable of modulating chromatin structure in vivo. Covalent modification of the N-terminal tails of chromatin core histone proteins, such as acetylation, phosphorylation, and methylation, often correlates with transcriptional events (9–11). It is believed that these histone modifications are essential to gene expression (11, 12). More specifically, they affect a reshaping of nucleosomal structure such that key DNA sequences are made more accessible for regulatory interactions. Acetylation of histone H3 and H4 relieves structural chromatin compaction, possibly through disruption of interactions between adjacent nucleosomes or by loosening contacts between histones and DNA (11, 12). This in turn is thought to make DNA regulatory regions more accessible to transcription factors and other DNA binding proteins.
We asked, therefore, whether IGF-I signaling influences the acetylation of histone H3 and H4. We used two transgenic (Tg) mouse lines with alterations in IGF-I expression or availability: in one line IGF-I is conditionally overexpressed in astrocytes (13), and in the other ectopic brain expression of IGF binding protein-1 (IGFBP-1), an inhibitor of IGF action, results in a blunting of IGF-I actions (14). We show here that IGF-I stimulates the acetylation of H3 and H4 histones in neurons and that these effects are associated with activation of Akt, a component of the phosphoinositide 3-kinase (PI-3-kinase) pathway.
Materials and Methods
Mice
Two lines of Tg mice were used is this study, IGF-IAst/Tet-Off Tg mice and IGFBP-1 Tg mice, and each has been described in detail previously (13, 14). IGF-IAst/Tet-Off Tg mice are derived from the breeding of IGF-IpTRE and tetracycline-controlled transactivator protein (tTA)GFAP Tg mice, such that the resulting IGF-IAst/Tet-Off Tg mice are heterozygous for each transgene (13). Briefly, in IGF-IpTRE Tg mice, a tetracycline response element fused to a minimal cytomegalovirus promoter drives the expression of a human IGF-I cDNA, whereas in tTAGFAP Tg mice, a human glial fibrillary acidic protein (GFAP) promoter controls the expression of a tTA cDNA. IGF-I overexpression is constitutive in astrocytes of mice carrying both transgenes (IGF-IAst/Tet-Off Tg mice) and can be suppressed by the addition of doxycycline (Dox; 0.4 mg/ml to drinking water), which binds to the tTA making it unavailable to interact with the IGF-IpTRE transgene. The genotype of these mice was routinely identified by PCR of tail genomic DNA. The IGFBP-1 Tg mice studied also were heterozygous for the transgene (14). All Tg mice and their wild-type (Wt) littermate controls were maintained in a vivarium at 22 C with a 12-h light, 12-h dark cycle. All mice were killed with CO2, and brains were dissected, weighed, frozen in liquid nitrogen, and stored at −80 C until used. All procedures were approved by the Institutional Review Committee of the University of North Carolina at Chapel Hill.
Antibodies
The primary antibodies and their final dilutions used in these studies are as follows: antiphospho-Akt (Thr308 and Ser473, 1:2000; Cell Signaling, Danvers, MA), antiphospho MAPK kinase (MEK) (1:1000; Cell Signaling), antiphospho p44/42 MAPK (1:1000; Cell Signaling), antihistone H3 (mouse monoclonal, 1:500; Upstate, Charlottesville, VA), antiacetyl Lys-9 histone H3 (1:1000; Upstate), antihistone H4 (1:500; Upstate), and antiacetyl Lys-8 histone H4 (1:1000; Upstate); mouse monoclonal anti-β-actin IgG (1:2000; Sigma Chemical Co., St. Louis, MO); mouse antineuronal nuclear antigen (anti-NeuN) IgG (1:100; Chemicon, Temecula, CA), anti-myelin basic protein (MBP) (mouse monoclonal, 1:400; Chemicon); and rabbit anti-GFAP IgG, (1:300; Chemicon). The following secondary antibodies from Jackson Immuno-Research (West Grove, PA) were used: fluorescein isothiocyanate (FITC)-conjugated donkey-mouse IgG, 1:500; FITC-conjugated donkey-rabbit IgG, 1:500; rhodamine Red-X-conjugated donkey-goat IgG, 1:500; rhodamine Red-X-conjugated donkey-mouse IgG, 1:500; rhodamine Red-X-conjugated donkey-rat IgG, 1:500; or biotin-conjugated donkey-rat IgG, 1:500.
Real-time RT-PCR
Quantitative real-time PCR was performed using a LightCycler system (Roche Diagnostics, Indianapolis, IN) with a QuantiTect SYBR Green RT-PCR kit (QIAGEN) as described (15). In brief, tissue was homogenized with RNA extraction buffer (TRIZOL reagent; Invitrogen Life Technologies, Inc., Carlsbad, CA) to yield total RNA following the manufacturer’s instructions. Total RNA was reverse transcribed with poly-dT oligodeoxynucleotide and SuperScript II (Invitrogen Life Technologies), again using the manufacturer’s recommended conditions. After an initial denaturation step (95 C for 90 sec), amplification was performed over 40–45 cycles of denaturation (95 C for 10 sec), annealing (60 C for 5 sec), and elongation (72 C for 13 sec). Amplification was monitored by measuring the fluorometric intensity of SYBR Green I at the end of each elongation phase. Glyceraldehyde-3-phosphate dehydrogenase (GAPDH) expression was quantified to normalize the amount of cDNA in each sample. The change in threshold cycle number (ΔCt) was normalized to the GAPDH reference gene by subtracting ΔCtGAPDH from ΔCtgene. The effect of treatment (ΔΔCt) was calculated by subtracting ΔCtnormal from ΔCtTg. Fold induction was determined by calculating 2ΔΔCt.
Western blot analysis
Histone isolation and assessment of histone acetylation was performed following a reported procedure (16). In brief, tissues were homogenized in 800 μl of lysis buffer A (25 mM Tris-HCl, 50 mM KCl, 2 mM MgCl2, 1 mM EDTA, 5 mM dithiothreitol, and 5 mM sodium butyrate). Nuclei were pelleted at 1700 × g at 4 C for 10 min and washed with lysis buffer A. High-salt extraction of nuclear proteins was performed by incubation of nuclei with buffer B [25 mM Tris-HCl, 0.42 M NaCl, 1.5 mM MgCl2, 0.5 mM EDTA, 1 mM dithiothreitol, 5 mM sodium butyrate, 1× protease inhibitor cocktail (Roche Molecular Biochemicals, Indianapolis, IN), and 25% sucrose] for 30 min on ice. The lysate was then centrifuged at 8000 × g for 10 min at 4 C and the supernatant (nuclear extract) used for analysis. Total brain proteins were determined by a colorimetric method using BSA protein assay reagent (Pierce, Rockford, IL). Protein levels were quantified by Western blotting using antibodies specific for the respective proteins as previously described (15, 17). In brief, homogenate proteins (30 μg/well) were subjected to SDS-PAGE and then transferred to nitrocellulose membranes by electroblotting. Subsequently the membrane was incubated with appropriately diluted primary antibody overnight at 4 C. After incubation and three washes, the membrane was probed with the specified horseradish peroxidase-linked second antibody for 2 h at room temperature. Antibodies were removed with stripping buffer [100 mM 2-mercaptoethanol/2% sodium dodecyl sulfate/62.5 mM Tris-HCl (pH 6.7)] at 50 C for 30 min, followed by washing with PBS/Tween 20, and membranes were reprobed with β-actin antibody. Specific immunoreactivity was visualized by using an enhanced chemiluminescence kit (Amersham Pharmacia Biotech, Piscataway, NJ) or an ABC colometric kit (Vector Laboratories, Burlingame, CA). To ensure equal loading of protein, membranes were incubated with β-actin after probing with first antibody. The protein abundance in each lane was normalized to the β-actin abundance. Relative OD readings for the immunoreactive bands were determined by using a computer-assisted densitometry program (Image-Pro Plus; Media Cybernetics, Silver Spring, MD).
Histology
Anesthetized mice were perfused with 0.9% NaCl followed by 4% paraformaldehyde. Dissected brains were postfixed overnight in 4% paraformaldehyde at 4 C and then equilibrated in 30% sucrose for an additional 24 h. Sections 20 μm thick were prepared in the coronal plane using a microtome.
Immunohistochemistry and double-labeling immunofluorescence
Free-floating sections were treated with 0.6% H2O2 in PBS for 30 min to block endogenous peroxidase. Several rinses in PBS were followed by incubation in PBS/0.1% Triton X-100/3% normal horse serum for 30 min and incubation with primary antibodies in PBS/0.1% Triton X-100/3% normal horse serum overnight at 4 C. After rinsing in PBS, sections were incubated for 1 h with secondary antibody. Tissues were washed in PBS and then incubated for 30 min in preassembled biotin-avidin-horseradish peroxidase complex according to the manufacturer’s recommendations (ABC Elite; Vector). Sections were then washed and incubated in diaminobenzidine solution for sufficient time to develop intense brown staining in the labeled nuclei. Rinsed sections were then mounted on uncoated Superfrost slides (Fisher Scientific, Santa Clara, CA), dried, dehydrated through a graded alcohol series into xylenes, and cover-slipped with Permount mounting medium (Fisher). Sections were treated to denature DNA as described above, followed by several rinses in PBS and incubation in PBS/0.1% Triton X-100/3% normal donkey serum for 30 min. For labeling of acetyl-H3 and cell-specific markers, sections were incubated with rabbit antiacetyl-H3 antibody and either anti-NeuN (Chemicon), anti-MBP (Chemicon), or anti-GFAP (Chemicon) at 4 C overnight followed by antirat rhodamine Red-X IgG and antimouse or antirabbit FITC IgG for 2 h at room temperature. Sections were washed, wet mounted, and then dried in the dark. Control experiments to measure nonspecific binding to tissue sections were performed by preabsorbing antisera overnight with 100 μM of the relevant peptide and omitting the primary antibody.
Histone H3 acetylation was analyzed in coronal brain sections by immunofluorescence with the use of antiacetylhistone H3 antibody double labeling with cell specific markers NeuN (neurons), MBP (oligodendrocytes), and GFAP (astrocytes). Fluorescent mounting media were applied before placing coverslips onto the slides. For visualization and photography, specimens were observed under a confocal microscope. Quantification of immunoreactive cells was performed following a reported procedure (18) with image analyzer software (Image-Pro Plus; Media Cybernetics). Only the cells with nuclear immunofluorescence above background were counted.
Statistical analyses
All data are presented as mean ± SEM, and the statistical significance of differences between experimental groups and controls was determined by Student’s t test or ANOVA for repeated measures using StatView (version 4.5; Abacus Concepts, Berkeley, CA). P < 0.05 was considered statistically significant.
Results
IGF-IAst/Tet-Off Tg mice have increased brain size
Birth weight and somatic growth of IGF-IAst/Tet-Off Tg mice in which the transgene was allowed to express continuously (i.e. no Dox supplementation) did not differ from that of their non-Tg, littermates. As expected, brain weights of 4-wk-old IGF-IAst/Tet-Off Tg mice were significantly larger (28%) than those of their non-Tg littermates (601 ± 11 mg, compared with 448 ± 20 mg, n = 8 each genotype, P < 0.03). There was no significant difference in brain weight between male and female IGF-IAst/Tet-Off Tg and Wt littermate mice.
IGF-IAst/Tet-Off Tg mice display increased acetylation of histone H3 and H4
To determine the effect of IGF-I overexpression and increased IGF-I signaling on histone modification, acetylated histone H3 (Lys-9) and H4 (Lys-8) were assessed in IGF-IAst/Tet-Off Tg and control mice by Western blot. In IGF-IAst/Tet-Off Tg mice, levels of acetylated H3 and H4 were elevated in the cerebral cortex (CTX) and hippocampus (HIP) (Fig. 1). Acetylated H3, but not acetylated H4, was increased in the cerebellum (CB) of Tg mice, compared with their littermate, control mice. We also evaluated histone acetylation in the liver, a tissue with no transgene expression, and found no evidence of increased H3 or H4 acetylation in IGF-IAst/Tet-Off Tg mouse liver. To evaluate whether the increased histone acetylation was due to IGF-I overexpression, we asked whether blunting IGF-I overexpression could return the magnitude of histone acetylation to normal. IGF-IAst/Tet-Off Tg mice were given Dox in their drinking water for 2 wk from postnatal d 30 to 45. Consistent with our previous report (13), the IGF-I transgene was down-regulated. As judged by RT-PCR analysis, IGF-I transgene expression was reduced to 0.4% of that seen in the non-Dox-treated mice in the brain, including in CTX, HIP. and CB, by Dox treatment (Fig. 2A). Consistent with the blunting of IGF-I overexpression, the brain weights of IGF-IAst/Tet-Off Tg mice treated with Dox were significantly decreased, compared with Tg mice not so treated, i.e. mice in which IGF-I overexpression is ongoing (Fig. 2B). By Western blot, the expression of acetylation of histone H3 and H4 in CTX and HIP were down-regulated (Fig. 3) in the Dox-treated group, compared with those that were not treated. No significant differences, however, were detected in the CB between the two groups (data not shown).
Fig. 1.
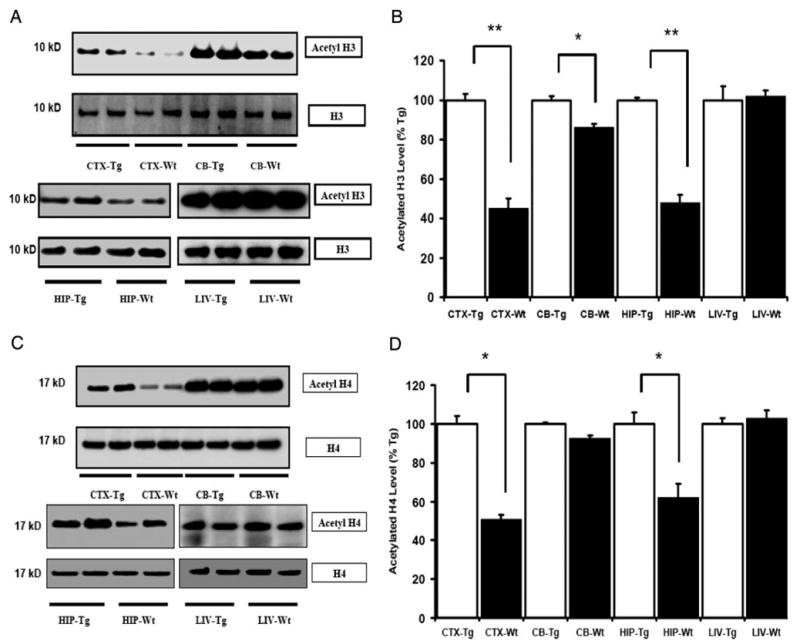
Acetylation of histone H3 and H4 is increased in the brain of IGF-IAst/Tet-Off Tg mice. A and C, Representative autoradiographs of Western blots for acetylated and total H3 and H4 proteins, respectively, in Tg and Wt control mice. B and D, Quantification of acetylated H3 and H4 protein expressed, respectively, as a percentage of the levels in Tg mice. Means ± SEM are shown (n = 5 or 6 per group; *, P < 0.05; **, P < 0.01). Levels of acetylated histone H3 and H4 are elevated CTX and HIP of IGF-IAst/Tet-Off Tg mice, and acetylated H3 also was increased in CB of the Tg mice. No difference in H3 and H4 acetylation was detectable in the liver (LIV).
Fig. 2.
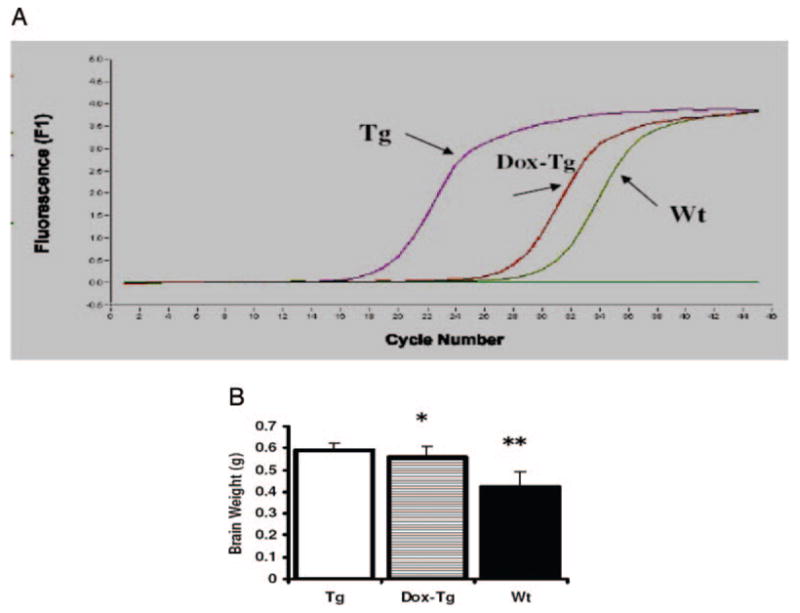
IGF-I mRNA and brain weights of IGF-IAst/Tet-Off Tg mice without (Tg) and with Dox treatment (Dox-Tg), compared with Wt, control mice. A, Real-time RT-PCR shows that IGF-I transgene mRNA is significantly suppressed in the brain of IGF-IAst/Tet-Off Tg mice by Dox treatment. B, Brain weights in the same mice. *, P < 0.05; **, P < 0.01.
Fig. 3.
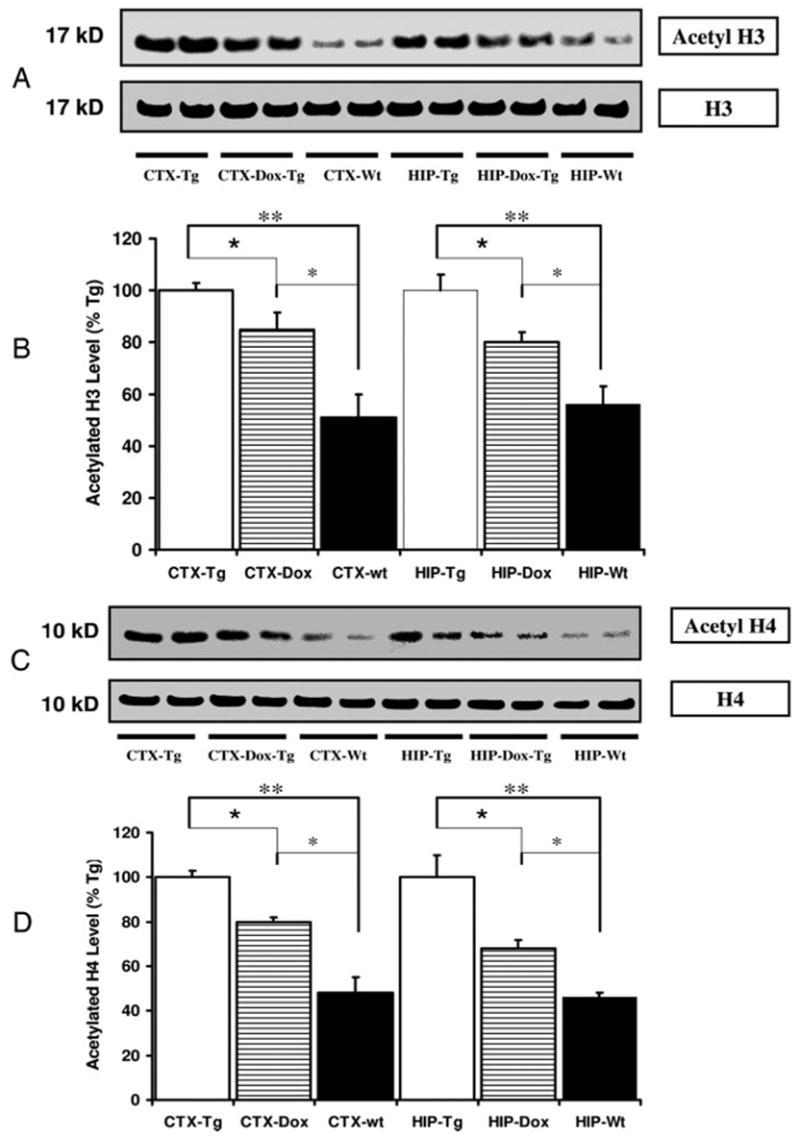
Dox suppression of the IGF-I transgene results in decreased abundance of acetylated histone H3 and H4 in the brain. A, Autoradiograph of a representative Western blot of acetylated H3 and total H3 in the CTX and HIP of Tg mice without (Tg) and with Dox treatment (Dox-Tg). B, Quantification of acetylated H3 abundance expressed as a percentage of levels in Tg tissue. C, Autoradiograph of a representative Western blot of acetylated H4 and total H4 in CTX and HIP of Tg mice without (Tg) and with Dox treatment (Dox-Tg). D, Quantification of acetylated H4 abundance expressed as a percentage of levels in Tg tissue. *, P < 0.05; **, P < 0.01.
To further confirm that IGF-I overexpression is responsible for the increased histone acetylation observed, we evaluated histone acetylation in Tg mice that ectopically express IGFBP-1 in the brain. Because of its capacity to avidly bind IGFs, IGFBP-1, when present in molar excess, is capable of inhibiting IGF-I action (19, 20). Our prior studies show that IGFBP-1 expression in the brain, an organ in which it is not normally expressed, results in retardation of brain growth by the second week of post-natal life (14). As expected, brain weights of IGFBP-1 Tg mice were significantly smaller than those of their non-Tg littermates (376 ± 18 mg, compared with 450 ± 10 mg, n = 8 in each group, P < 0.05). We found that acetylated H3 and H4 were decreased in CTX, CB, and HIP of the IGFBP-1 Tg mice when compared with the control mice (Fig. 4).
Fig. 4.
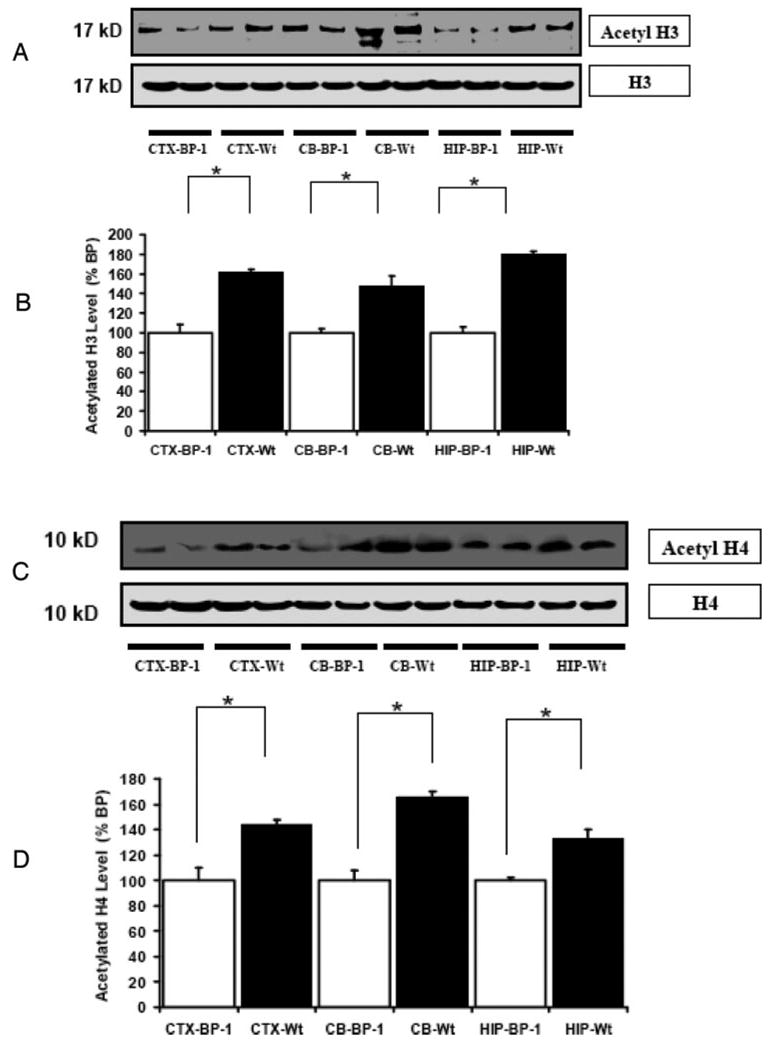
Acetylation of histone H3 and H4 is decreased in the brain of IGFBP-1 transgenic (BP-1) mice. A, Representative autoradiograph of a Western blot of acetylated and total H3 in the CTX, CB, and HIP of IGFBP-1 Tg and Wt mice. B, Quantification of acetylated H3 expressed as a percentage of Tg tissue. C, Representative autoradiograph of a Western blot of acetylated and total H4 in the CTX, CB, and HIP of IGFBP-1 Tg and Wt mice. D, Quantification of phosphorylated H4 abundance expressed as a percentage of levels in Tg mice. Data are means ± SEM; n = 6 per group. *, P < 0.05; **, P < 0.01.
Increased activation of PI-3-kinase/Akt signaling pathway but not MAPK signaling pathway
To determine whether the astrocyte-specific overexpression of IGF-I was associated with the activation of a pathway known to be involved in increased IGF-I expression, we assessed phosphorylation of Akt and MEK1/2 by immunoblot analysis. Using an antibody that specifically recognized Thr308 phosphorylated Akt, we observed a marked increase in Akt activation in the CTX, CB, and HIP of Tg mice, compared with control mice (P < 0.05) (Fig. 5, A and B). Total Akt protein did not differ between Tg and control mice. In addition, using an antibody that specifically recognizes Akt Ser473 phosphorylation site, we confirmed that phosphor-Thr473 Akt also was increased in the CTX, CB, and HIP of Tg mice (data not shown). In contrast, analysis of a phosphorylated form of MEK1/2 by Western blot indicated that there is no significant difference of activation in this signaling pathway in the brain between Tg and control mice (Fig. 5, C and D). Moreover, we found no difference between Tg and control mice when an antibody directed at p44/42 MAPK (data not shown). In a variety of cultured cells IGF-I is well documented to signal through the PI3-kinase pathway and stimulate the phosphorylation of Akt (3, 21, 22). These findings therefore suggest that IGF-I in vivo actions include activation of the PI-3-kinase pathway and that IGF-I stimulation of this pathway could be the mechanism leading to IGF-I-induced histone acetylation. To further assess the regulation of Akt activation by IGF-I, we performed Western blot analysis on tissue sections from IGFBP-1 Tg mice. We found a marked decrease in phosphorylated Akt in the CTX, CB, and HIP of Tg mice, compared with control mice (P < 0.05) (Fig. 6B). The finding of decreased Akt activation in IGFBP-1 provides further evidence of decreased IGF-I signaling in these mice and supports the hypothesis that IGF-I-stimulated PI-3-kinase signaling leads to histone modification.
Fig. 5.
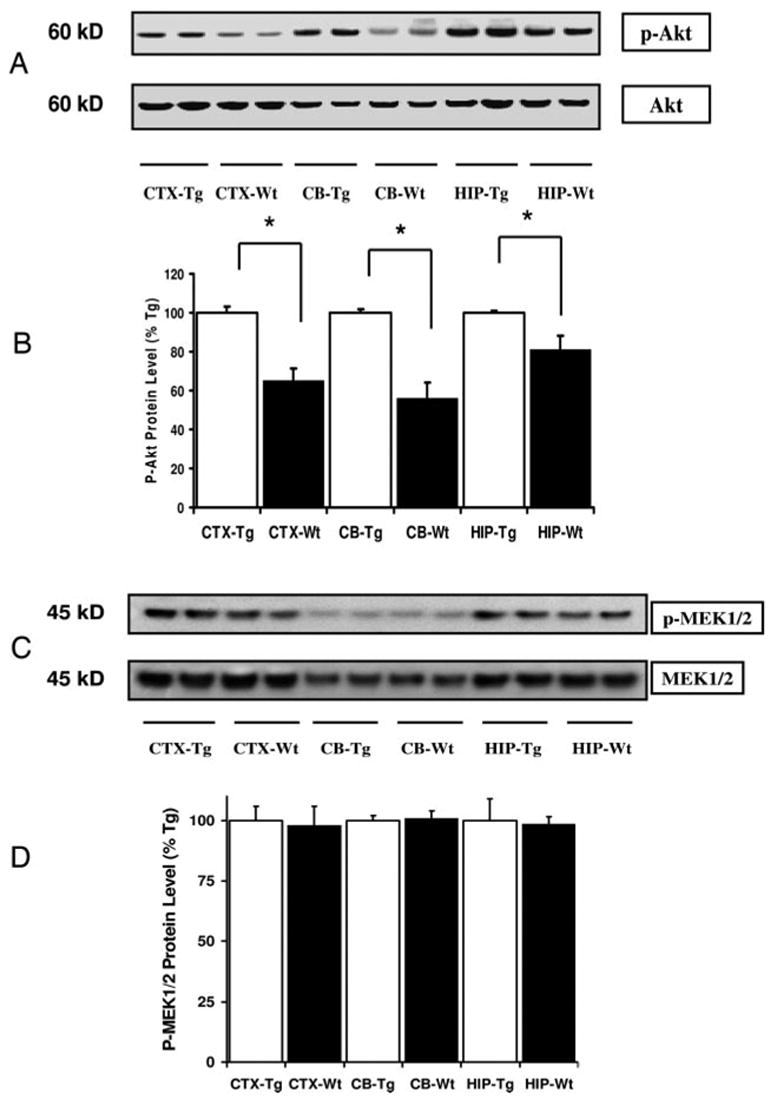
Abundance of phosphorylation of Akt (Thr308) and MEK 1/2 in brain regions of IGF-IAst/Tet-Off Tg and control mice. A, Autoradiograph of representative Western blot of phosphorylated Akt (p-Akt) and total Akt in the CTX, CB, and HIP of IGF-IAst/Tet-Off Tg mice and Wt mice. B, Quantification of p-Akt expressed as a percent of levels found in Tg mice (means ± SEM, n = 5 or 6 per group). *, P < 0.05. C, Autoradiograph of Western blot of phosphorylated MEK1/2 and total MEK in the CTX, CB, and HIP of IGF-IAst/Tet-Off Tg and Wt mice. D, Quantification of p-MEK1/2 expressed as a percentage of levels found in Tg mice (means ± SEM, n = 5 or 6 per group).
Fig. 6.
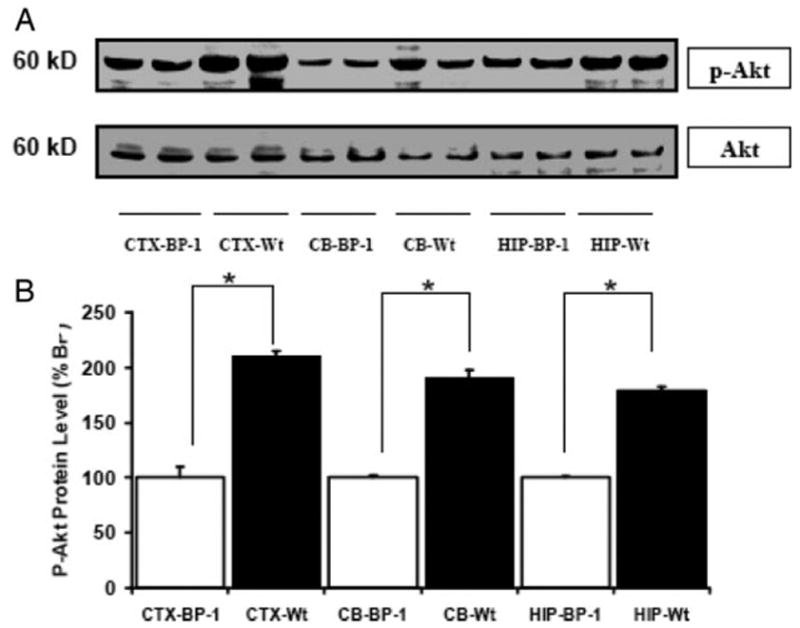
Akt phosphorylation in IGFBP-1 transgenic mice. A, Representative autoradiograph of Western blot of phosphorylated Akt (p-Akt) and total Akt in the CTX, CB, and HIP of IGFBP-1 transgenic (BP-1) mice and Wt mice. B, Quantification of p-Akt abundance expressed as a percentage of levels in Tg mice. Data are means ± SEM; n = 6 per group. *, P < 0.05.
Immunohistochemical detection of histone H3 acetylation in the brain regions
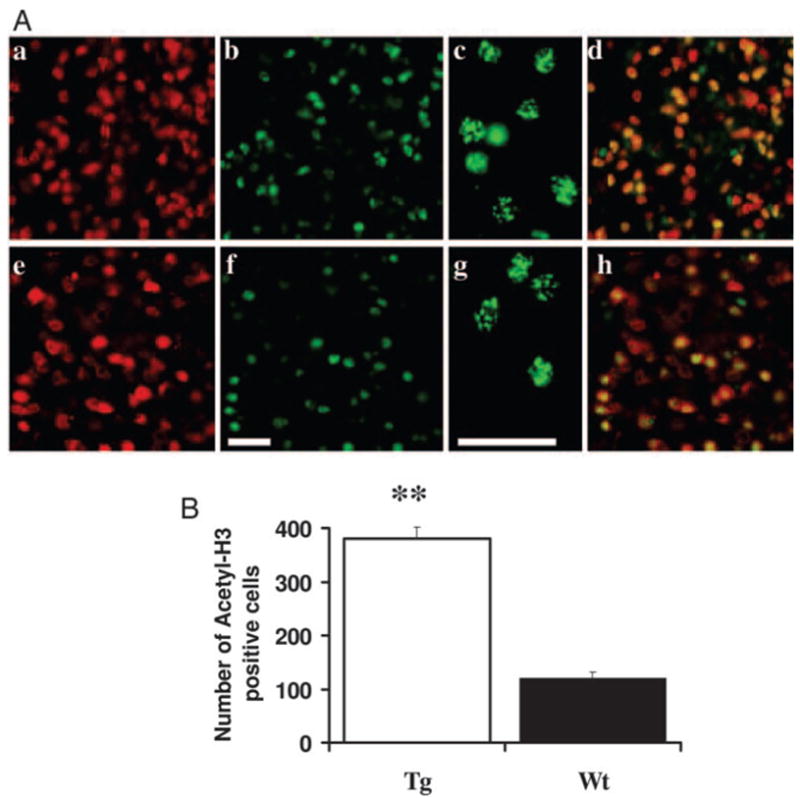
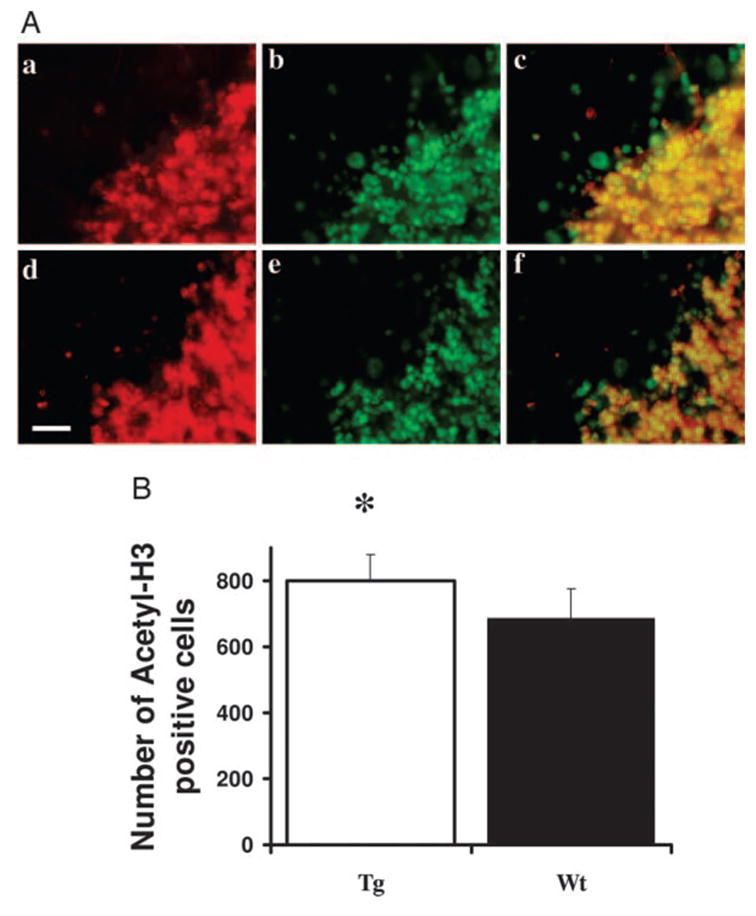
To determine the cellular sites of IGF-I-stimulated histone modification, we examined histone H3 acetylation in cortex CTX, CB, and HIP by immunohistochemistry. Compared with control non-Tg mice, IGF-IAst/Tet-Off Tg mice show a significant increase in the number of intensely labeled acetyl-histone H3 immunoreactive cells in the frontal cortex (Fig. 7). Only intense immunostaining that that was observed in nuclei on confocal microscopy was considered positive (see high-magnification image in Fig. 7A, c and g). This immunostaining often exhibited a speckled pattern, as is typically observed for nuclear histone proteins. Greater than 90% acetyl-histone H3 immunoreactivity in the CTX colocalized to cells that also reacted with NeuN (Fig. 7A, d and h). The number of cells that double labeled with acetyl-H3 and NeuN antibodies also was significantly increased in the frontal cortex of Tg mice, compared with normal mice (data not shown). Similar immunoreactivity patterns (greater than 90% acetyl-H3 cells are NeuN positive) were found in the cerebellar granule cell layer of Tg mice (Fig. 8). Consistent with the Western blot data, the expression of acetyl-histone H3 immunoreactivity is highest in the CB. An increased number of acetyl-histone H3-immunopositive neurons (Fig. 9) was also observed in the CA3 region of Tg mouse HIP. The number of double-labeled MBP and acetyl-H3-positive cells also was significantly increased in the corpus callosum of Tg mice (data not shown). Only a small portion of GFAP-positive cells immunostained with antibody to acetylhistone H3 and no differences in the number of these double-labeled cells were observed between IGF-I-overexpressing and control littermate mice. In addition, there is decrease of histone H3 acetylation staining in the brain of IGFBP-1 Tg mice, including cortex and hippocampus (not shown).
Fig. 7.
Acetylated H3 in the CTX. A, Confocal images of IGF-IAst/Tet-Off Tg (a–d) and control mice (eh). CTX sections were immunofluorescently labeled for acetylated histone H3 (green; b, c, f, and g) or NeuN (red; a and e). The merged images in d and h show cells reacting with both the acetyl-H3 and NeuN antibodies (yellow). Scale bar, 40 μm. B, Quantification of the number of acetylated histone H3-positive cells. Only cells giving fluorescence above a threshold determined from the control section of normal mice (using Image-Pro Plus software) were counted. **, P < 0.01.
Fig. 8.
Acetylated histone H3-positive cells in the CB. A, Confocal images IGF-IAst/Tet-Off Tg (a–c) and control mice (d–f) CB sections immunofluorescently labeled for acetylated histone H3 (green; b and e) or NeuN (red; a and d) cells The merged images in c and f show cells reacting with both acety-H3 and NeuN antibodies (yellow). Scale bar, 20 μm. B, Quantification of the number of acetylated histone H3-positive cells. Only cells giving fluorescence above a threshold determined from the control section of normal mice using Image-Pro Plus software) were counted. (**, P < 0.05).
Fig. 9.
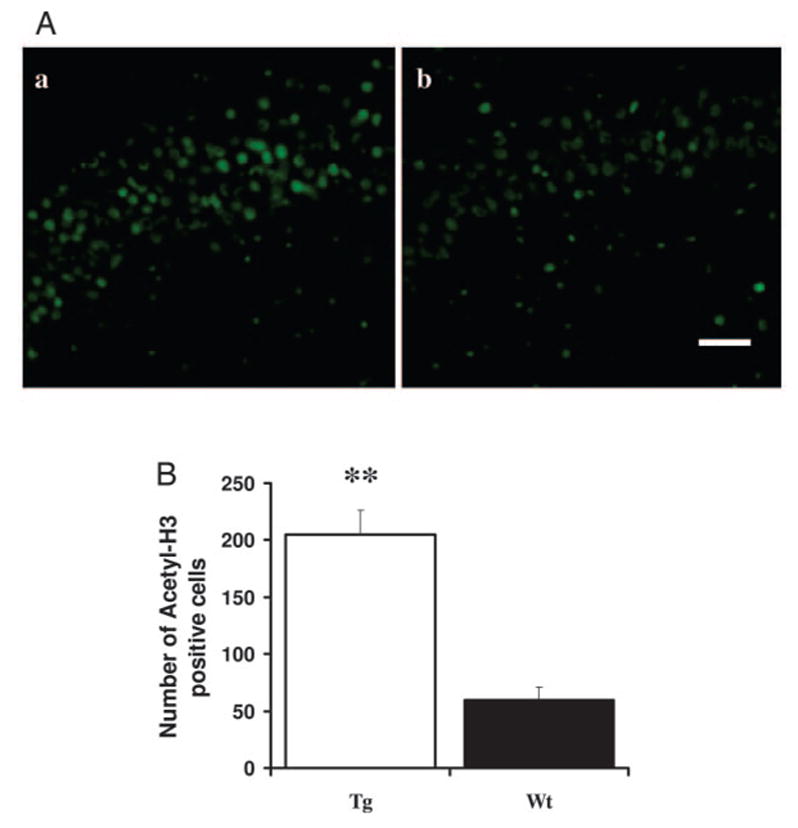
Acetylated histone H3-positive cells in the HIP. A, Confocal images IGF-IAst/Tet-Off Tg (left) and control mice (right) HIP CA3 sections immunofluorescently labeled for acetylated histone H3. Scale bar, 20 μm. B, Quantification of the number of acetylated histone H3-positive cells. **, P < 0.01.
Discussion
Our data provide compelling evidence that IGF-I can regulate histone acetylation in vivo. We found that acetylation of histone H3 and H4 is significantly increased in neurons and to a lesser extent in oligodendrocytes of mice engineered to conditionally overexpress IGF-I in astrocytes (IGF-IAst/Tet-Off Tg mice). Furthermore, the increased histone acetylation observed with IGF-I overexpression was reduced toward normal when transgene IGF-I overexpression was reduced. As has been our experience, Dox treatment does not totally ablate IGF-I overexpression, and thus, modest but dramatically reduced IGF-I overexpression persists despite Dox treatment. Nonetheless, the reduction in IGF-I overexpression resulted in a significant reduction in acetylated H3 and H4 histones, indicating that IGF-I signaling stimulates acetylation.
Additional evidence of IGF-I regulation of histone modification comes from our finding that histone acetylation was reduced in the brains of mice that ectopically express IG-FBP-1. IGFBP-1 is one of six high-affinity IGFBPs (20), and it inhibits IGF action when present in molar excess. Although IGFBP-1 can be transported to the brain from its sites of synthesis, it is not normally expressed in the brain. When expressed in the brain of these Tg mice at relatively high concentrations, brain growth retardation results due to inhibition of IGF-I availability.
We also found evidence that IGF-I stimulated Akt activation. Specifically we observed that the abundance of phosphorylated Akt was increased in IGF-IAst/Tet-Off Tg mice and decreased in IGFBP-1 Tg mice. IGF-I interactions with the type I IGF receptor are known to signal through both the PI-3-kinase and MAPK pathways. Our findings of activation of Akt, a component of the PI-3-kinase pathway but not that of MEK1/2 or MAPK, components of the MAPK pathway, suggests (but does not prove) a causal association. We speculate therefore that IGF-I signaling through the PI-3-kinase pathway leads to histone modification. Consistent with this hypothesis are the findings that inhibition of PI-3-kinase/Akt reduces histone deacetylase inhibitor-induced gene activation (24).
In this study we assessed lys-9 histone H3 and lys-8 his-tone H4 acetylation as markers for IGF-I-stimulated histone modification. H3 and H4 each have multiple potential acetylation sites, and it remains possible that IGF-I influenced acetylation at multiple H3 and H4 sites. In addition, IGF-I could modify histones in other ways. Our results also indicate that IGF-I stimulated acetylation of histone varies in magnitude among the brain regions studied. Cerebellum exhibited the least marked of these changes. Specifically acetylation of the lys-9 H3 was only minimally increased, whereas the acetylation lys-8 H4 showed no change. We have no certain explanation for this finding. The type I IGF receptor is ubiquitously expressed in neural cells, and our previous studies of various IGF-I-overexpressing Tg mice do not point to any brain regions incapable of responding to IGF-I. In fact, brain overgrowth is significant and not dissimilar in each region of IGF-IAst/Tet-Off Tg mice evaluated. The relative increases in wet weight in these mice at 35 d of age are as follows: HIP, 59% greater than Wt; CB, 42%; diencephalon, 41%; brain stem, 38%; and CTX, 32% (13). Furthermore, in a line of mice in which IGF-II genomic regulatory elements drive IGF-I expression, the CB reaches double normal size in adulthood (25).
Among our various lines of IGF-I Tg mice, the magnitude of transgene expression appears to be the major correlate of IGF-I stimulated effects, and our previous data in IGF-IAst/Tet-Off Tg mice demonstrate a correlation between the magnitude of IGF-I overexpression and brain region overgrowth. We speculate, therefore, that IGF-I mechanisms of action in the CB might involve histone acetylation at sites that we did not evaluate or involves histone modifications other than acetylation. Histone H3 and H4 acetylation in the hippocampus were found to be increased in IGF-IAst/Tet-Off Tg mice and decreased in IGFBP-1 mice and thus demonstrate a positive correlation between IGF-I expression and histone modification in this brain region. IGF-I has been found to be capable of increasing hippocampal neurogenesis (6, 17, 26, 28). Furthermore, several studies suggest that an inhibitor of histone deacetylase can promote proliferation and induce neuronal differentiation of hippocampal neural progenitors (29, 30). IGF-I-mediated histone modification thus might be part of its molecular mechanism that leads to its capacity to stimulate of neurogenesis in the hippocampus.
Another possible explanation for the regional-specific differences in IGF-I-stimulated acetylation could be regional differences in histone acetyltransferases (HATs) and histone deacetylases (HDAC) activity and/or the influence of IGF-I on these activities. Steady-state levels of histone acetylation in the brain are dynamically maintained by the opposing actions of HATs and HDACs (31). The distribution of HATs and HDACs in different tissues has recently been described (32) and indicates that histone acetylation mechanisms may differ somewhat among specific areas in the brain. Our observation that IGF-I actions on histone acetylation, at least at lys-9 H3 and lys-8 H4, thus are brain region selective might be due to brain regional and cellular difference in the distribution of HATs and HDACs.
Our data also suggest that neurons are the predominant site of IGF-I-stimulated histone acetylation. Recent reports have shown that IGF-I promotes neurogenesis and may induce neuronal precursors to differentiate into mature neurons in both developing and adult nervous system (6, 7, 17, 33, 34). Neural development is determined by both extrinsic and intrinsic factors that interface to regulate gene programs for controlling neuronal cell fate and function (30). Chromatin remodeling and epigenetic gene regulation play an important role in neurogenesis and synaptic development and function (30, 35); thus, it may be that histone modification contributes to the molecular mechanism of IGF-I action to promote neurogenesis. IGF-I also is capable of promoting the survival of mature oligodendrocytes and the differentiation of oligodendrocyte progenitors (1). Recent evidence shows that rat oligodendrocyte precursors can be induced by extracellular signals to convert into multipotent neural stem-like cells, and this conversion was associated with the modification of Lys 4 and Lys 9 of histone H3 (23). Histone deacetylation, rather than histone acetylation, however, appeared critical to oligodendrocyte differentiation and myelination in the developing corpus callosum (27). In contrast, we found evidence that IGF-I stimulated H3 acetylation in corpus collosum oligodendrocytes. Taken together these latter findings raise the possibility that IGF-I has multiple effects on histone acetylation and modification, including deacetylation.
In summary, our data show that IGF-I can modulate histone acetylation. The consequences of this IGF-I action on gene transcription, however, remain to be determined. It seems likely that histone modification is an early step in IGF-I influences on gene transcription, and we are exploring other evidence of IGF-I stimulated histone modification.
Acknowledgments
We thank members of the laboratory for helpful discussions on the study. We thank Drs. Billie Moats-Staats and Andrzej Bartke for critique of the manuscript.
Abbreviations
- CB
Cerebellum
- ΔCt
change in threshold cycle number
- CTX
cerebral cortex
- Dox
doxycycline
- FITC
fluorescein isothiocyanate
- GAPDH
glyceraldehyde-3-phosphate dehydrogenase
- GFAP
glial fibrillary acidic protein
- HAT
histone acetyltransferase
- HDAC
histone deacetylases
- HIP
hippocampus
- IGFBP-1
IGF binding protein-1
- MBP
myelin basic protein
- MEK
MAPK kinase
- NeuN
neuronal nuclear antigen
- PI-3-kinase
phosphoinositide 3-kinase
- Tg
transgenic
- tTA
tetracycline-controlled transactivator protein
- Wt
wild-type
Footnotes
This work was supported by National Institutes of Health Grants NS048868 and HD008299 (to A.J.D.).
References
- 1.D’Ercole AJ, Ye P, Calikoglu AS, Gutierrez-Ospina G. The role of the insulin-like growth factors in the central nervous system. Mol Neurobiol. 1996;13:227–255. doi: 10.1007/BF02740625. [DOI] [PubMed] [Google Scholar]
- 2.Werther GA, Russo V, Baker N, Butler G. The role of the insulin-like growth factor system in the developing brain. Horm Res. 1998;49(Suppl 1):37–40. doi: 10.1159/000053066. [DOI] [PubMed] [Google Scholar]
- 3.Russo VC, Gluckman PD, Feldman EL, Werther GA. The insulin-like growth factor system and its pleiotropic functions in brain. Endocr Rev. 2005;26:916–943. doi: 10.1210/er.2004-0024. [DOI] [PubMed] [Google Scholar]
- 4.D’Ercole AJ, Ye P, O’Kusky JR. Mutant mouse models of insulin-like growth factor actions in the central nervous system. Neuropeptides. 2002;36:209–220. doi: 10.1054/npep.2002.0893. [DOI] [PubMed] [Google Scholar]
- 5.Anlar B, Sullivan KA, Feldman EL. Insulin-like growth factor-I and central nervous system development. Horm Metab Res. 1999;31:120–125. doi: 10.1055/s-2007-978708. [DOI] [PubMed] [Google Scholar]
- 6.Anderson MF, Aberg MA, Nilsson M, Eriksson PS. Insulin-like growth factor-I and neurogenesis in the adult mammalian brain. Brain Res Dev Brain Res. 2002;134:115–122. doi: 10.1016/s0165-3806(02)00277-8. [DOI] [PubMed] [Google Scholar]
- 7.Hodge RD, D’Ercole AJ, O’Kusky JR. Insulin-like growth factor-I accelerates the cell cycle by decreasing G1 phase length and increases cell cycle reentry in the embryonic cerebral cortex. J Neurosci. 2004;24:10201–10210. doi: 10.1523/JNEUROSCI.3246-04.2004. [DOI] [PMC free article] [PubMed] [Google Scholar]
- 8.Chrysis D, Calikoglu AS, Ye P, D’Ercole AJ. Insulin-like growth factor-I overexpression attenuates cerebellar apoptosis by altering the expression of Bcl family proteins in a developmentally specific manner. J Neurosci. 2001;21:1481–1489. doi: 10.1523/JNEUROSCI.21-05-01481.2001. [DOI] [PMC free article] [PubMed] [Google Scholar]
- 9.Fischle W, Wang Y, Allis CD. Binary switches and modification cassettes in histone biology and beyond. Nature. 2003;425:475–479. doi: 10.1038/nature02017. [DOI] [PubMed] [Google Scholar]
- 10.Cheung P, Allis CD, Sassone-Corsi P. Signaling to chromatin through histone modifications. Cell. 2000;103:263–271. doi: 10.1016/s0092-8674(00)00118-5. [DOI] [PubMed] [Google Scholar]
- 11.Strahl BD, Allis CD. The language of covalent histone modifications. Nature. 2000;403:41–45. doi: 10.1038/47412. [DOI] [PubMed] [Google Scholar]
- 12.Jenuwein T, Allis CD. Translating the histone code. Science. 2001;293:1074–1080. doi: 10.1126/science.1063127. [DOI] [PubMed] [Google Scholar]
- 13.Ye P, Popken GJ, Kemper A, McCarthy K, Popko B, D’Ercole AJ. As-trocyte-specific overexpression of insulin-like growth factor-I promotes brain overgrowth and glial fibrillary acidic protein expression. J Neurosci Res. 2004;78:472–484. doi: 10.1002/jnr.20288. [DOI] [PubMed] [Google Scholar]
- 14.D’Ercole AJ, Dai Z, Xing Y, Boney C, Wilkie MB, Lauder JM, Han VK, Clemmons DR. Brain growth retardation due to the expression of human insulin like growth factor binding protein-1 in transgenic mice: an in vivo model for the analysis of IGF function in the brain. Brain Res Dev Brain Res. 1994;82:213–222. doi: 10.1016/0165-3806(94)90164-3. [DOI] [PubMed] [Google Scholar]
- 15.Sun LY, Al Regaiey K, Masternak MM, Wang J, Bartke A. Local expression of GH and IGF-1 in the hippocampus of GH-deficient long-lived mice. Neurobiol Aging. 2005;26:929–937. doi: 10.1016/j.neurobiolaging.2004.07.010. [DOI] [PubMed] [Google Scholar]
- 16.Shahbazian M, Young J, Yuva-Paylor L, Spencer C, Antalffy B, Noebels J, Armstrong D, Paylor R, Zoghbi H. Mice with truncated MeCP2 recapitulate many Rett syndrome features and display hyperacetylation of histone H3. Neuron. 2002;35:243–254. doi: 10.1016/s0896-6273(02)00768-7. [DOI] [PubMed] [Google Scholar]
- 17.Sun LY, Evans MS, Hsieh J, Panici J, Bartke A. Increased neurogenesis in dentate gyrus of long-lived Ames dwarf mice. Endocrinology. 2005;146:1138–1144. doi: 10.1210/en.2004-1115. [DOI] [PubMed] [Google Scholar]
- 18.Brami-Cherrier K, Valjent E, Herve D, Darragh J, Corvol JC, Pages C, Simon AJ, Girault JA, Caboche J. Parsing molecular and behavioral effects of cocaine in mitogen- and stress-activated protein kinase-1-deficient mice. J Neurosci. 2005;25:11444–11454. doi: 10.1523/JNEUROSCI.1711-05.2005. [DOI] [PMC free article] [PubMed] [Google Scholar]
- 19.Lee PD, Giudice LC, Conover CA, Powell DR. Insulin-like growth factor binding protein-1: recent findings and new directions. Proc Soc Exp Biol Med. 1997;216:319–357. doi: 10.3181/00379727-216-44182. [DOI] [PubMed] [Google Scholar]
- 20.Jones JI, Clemmons DR. Insulin-like growth factors and their binding proteins: biological actions. Endocr Rev. 1995;16:3–34. doi: 10.1210/edrv-16-1-3. [DOI] [PubMed] [Google Scholar]
- 21.Zheng WH, Kar S, Dore S, Quirion R. Insulin-like growth factor-1 (IGF-1): a neuroprotective trophic factor acting via the Akt kinase pathway. J Neural Transm Suppl. 2000:261–272. doi: 10.1007/978-3-7091-6301-6_17. [DOI] [PubMed] [Google Scholar]
- 22.Dudek H, Datta SR, Franke TF, Birnbaum MJ, Yao R, Cooper GM, Segal RA, Kaplan DR, Greenberg ME. Regulation of neuronal survival by the serine-threonine protein kinase Akt. Science. 1997;275:661–665. doi: 10.1126/science.275.5300.661. [DOI] [PubMed] [Google Scholar]
- 23.Kondo T, Raff M. Chromatin remodeling and histone modification in the conversion of oligodendrocyte precursors to neural stem cells. Genes Dev. 2004;18:2963–2972. doi: 10.1101/gad.309404. [DOI] [PMC free article] [PubMed] [Google Scholar]
- 24.Denlinger CE, Rundall BK, Jones DR. Inhibition of phosphatidyl-inositol 3-kinase/Akt and histone deacetylase activity induces apoptosis in non-small cell lung cancer in vitro and in vivo. J Thorac Cardiovasc Surg. 2005;130:1422–1429. doi: 10.1016/j.jtcvs.2005.06.051. [DOI] [PubMed] [Google Scholar]
- 25.Ye P, Xing Y, Dai Z, D’Ercole AJ. In vivo actions of insulin-like growth factor-I (IGF-I) on cerebellum development in transgenic mice: evidence that IGF-I increases proliferation of granule cell progenitors. Brain Res Dev Brain Res. 1996;95:44–54. doi: 10.1016/0165-3806(96)00492-0. [DOI] [PubMed] [Google Scholar]
- 26.O’Kusky JR, Ye P, D’Ercole AJ. Insulin-like growth factor-I promotes neurogenesis and synaptogenesis in the hippocampal dentate gyrus during postnatal development. J Neurosci. 2000;20:8435–8442. doi: 10.1523/JNEUROSCI.20-22-08435.2000. [DOI] [PMC free article] [PubMed] [Google Scholar]
- 27.Shen S, Li J, Casaccia-Bonnefil P. Histone modifications affect timing of oligodendrocyte progenitor differentiation in the developing rat brain. J Cell Biol. 2005;169:577–589. doi: 10.1083/jcb.200412101. [DOI] [PMC free article] [PubMed] [Google Scholar]
- 28.Aberg MA, Aberg ND, Hedbacker H, Oscarsson J, Eriksson PS. Peripheral infusion of IGF-I selectively induces neurogenesis in the adult rat hippocampus. J Neurosci. 2000;20:2896–2903. doi: 10.1523/JNEUROSCI.20-08-02896.2000. [DOI] [PMC free article] [PubMed] [Google Scholar]
- 29.Hsieh J, Nakashima K, Kuwabara T, Mejia E, Gage FH. Histone deacetylase inhibition-mediated neuronal differentiation of multipotent adult neural progenitor cells. Proc Natl Acad Sci USA. 2004;101:16659–16664. doi: 10.1073/pnas.0407643101. [DOI] [PMC free article] [PubMed] [Google Scholar]
- 30.Hsieh J, Gage FH. Epigenetic control of neural stem cell fate. Curr Opin Genet Dev. 2004;14:461–469. doi: 10.1016/j.gde.2004.07.006. [DOI] [PubMed] [Google Scholar]
- 31.Waterborg JH. Dynamics of histone acetylation in vivo. A function for acetylation turnover? Biochem Cell Biol. 2002;80:363–378. doi: 10.1139/o02-080. [DOI] [PubMed] [Google Scholar]
- 32.Khochbin S, Kao HY. Histone deacetylase complexes: functional entities or molecular reservoirs. FEBS Lett. 2001;494:141–144. doi: 10.1016/s0014-5793(01)02327-4. [DOI] [PubMed] [Google Scholar]
- 33.McCurdy RD, Feron F, McGrath JJ, Mackay-Sim A. Regulation of adult olfactory neurogenesis by insulin-like growth factor-I. Eur J Neurosci. 2005;22:1581–1588. doi: 10.1111/j.1460-9568.2005.04355.x. [DOI] [PubMed] [Google Scholar]
- 34.Popken GJ, Hodge RD, Ye P, Zhang J, Ng W, O’Kusky JR, D’Ercole AJ. In vivo effects of insulin-like growth factor-I (IGF-I) on prenatal and early postnatal development of the central nervous system. Eur J Neurosci. 2004;19:2056–2068. doi: 10.1111/j.0953-816X.2004.03320.x. [DOI] [PubMed] [Google Scholar]
- 35.Hsieh J, Gage FH. Chromatin remodeling in neural development and plasticity. Curr Opin Cell Biol. 2005;17:664–671. doi: 10.1016/j.ceb.2005.09.002. [DOI] [PubMed] [Google Scholar]