

Abstract
The natural vitamin E tocotrienols possess properties not shared by tocopherols. Nanomolar alpha-tocotrienol, not alpha-tocopherol, is potently neuroprotective (JBC 275:13049; 278:43508; Stroke 36:2258). On a concentration basis, this finding represents the most potent of all biological functions exhibited by any natural vitamin E molecule. We sought to dissect the antioxidant-independent and –dependent neuroprotective properties of alphatocotrienol by using two different triggers of neurotoxicity, homocysteic acid (HCA) and linoleic acid. Both HCA and linoleic acid caused neurotoxicity with comparable features such as increased GSSG/GSH, elevated [Ca2+]i and compromised mitochondrial Δψ . Mechanisms underlying HCA-induced neurodegeneration were comparable to the path implicated in glutamate-induced neurotoxicity. Inducible activation of c-Src and 12-lipoxygenase (12-Lox) represented early events in that pathway. Over-expression of active c-Src or 12-Lox sensitized cells to HCA-induced death. Nanomolar alpha-tocotrienol protected. Knock-down of c-Src or 12-Lox attenuated HCA-induced neurotoxicity. Oxidative stress represented a late event in HCA-induced death. The observation that micromolar, but not nanomolar, alpha-tocotrienol functions as an antioxidant was verified in the model involving linoleic acid induced oxidative stress and cell death. Oral supplementation of alpha-tocotrienol to humans results in a peak plasma concentration of 3 micromolar. Thus, oral alpha-tocotrienol may be neuroprotective by antioxidant-independent as well as antioxidant-dependent mechanisms.
INTRODUCTION
Vitamin E is a generic term for tocopherols and tocotrienols which qualitatively exhibit the biological activity of α-tocopherol (Sen et al. 2004). Compared to tocopherols, tocotrienols have been poorly studied (Traber and Packer 1995; Traber and Sies 1996; Sen et al. 2004, 2006). It is clear, however, that members of the vitamin E family are not redundant with respect to their biological functions. α-Tocotrienol, γ-tocopherol, and δ-tocotrienol have emerged as vitamin E molecules with functions in health and disease that are clearly distinct from that of α-tocopherol (Hensley et al. 2004; Sen et al. 2006). At concentrations 25-50 μM, α-tocopherol uniquely regulates specific signal transduction pathways by mechanisms that are independent of its antioxidant properties (Boscoboinik et al. 1994). Micromolar amounts of tocotrienol, not tocopherol, suppress the activity of hydroxy-3-methylglutaryl coenzyme A reductase (Pearce et al. 1992; Pearce et al. 1994). Tocotrienols possess anti-cancer and cholesterol lowering properties that are often not exhibited by tocopherols (Theriault et al. 1999; Packer et al. 2001; Schaffer et al. 2005; Sen et al. 2006).
Tocotrienols differ from tocopherols by possessing a farnesyl (isoprenoid) rather than a saturated phytyl side chain. We have reported that at nanomolar concentration, α-tocotrienol, not α-tocopherol, prevents stroke-related neurodegeneration (Sen et al. 2000; Khanna et al. 2003). On a concentration basis, this finding represents the most potent of all biological functions exhibited by any natural vitamin E molecule. Our recent work has demonstrated the efficacy of α-tocotrienol in protecting against stroke-induced injury to the brain in vivo (Khanna et al. 2005b). Orally supplemented tocotrienols are transported to vital organs including the brain and spinal cord (Khanna et al. 2005a). The unsaturated side chain of tocotrienol allows for more efficient penetration into tissues that have saturated fatty layers such as the brain and liver (Suzuki et al. 1993). Following supplementation to humans, micromolar concentration of α-tocotrienol has been detected in the blood plasma (O’Byrne et al. 2000; Khosla et al. 2006). The maximal α tocotrienol concentrations in supplemented individuals averaged approximately 3 μM in blood plasma, 1.7 μM in low density lipoprotein, 0.9 μM in triglyceride rich lipoprotein and 0.5 μM in high density lipoprotein (Khosla et al. 2006). Thus, the peak plasma level corresponded to 12–30-fold more than the concentration of α-tocotrienol required to completely prevent stroke-related neurodegeneration (Sen et al. 2000; Khanna et al. 2003).
Murine HT hippocampal neural cell line, lacking the intrinsic excitotoxicity-pathway, represent an useful model to characterize redox-sensitive pathways involved in neurotoxicity (Sen et al. 2000; Schubert and Piasecki 2001; Tan et al. 2001; Dargusch and Schubert 2002; Khanna et al. 2003; Khanna et al. 2005b). In this study, we sought to develop an understanding of the antioxidant-independent and –dependent neuroprotective properties of α-tocotrienol by using two different triggers of neurotoxicity, homocysteic acid (HCA) and linoleic acid. Pathways for neurodegeneration induced by HCA are akin to those induced by glutamate (Sagara et al. 2002; Baydas et al. 2005). In contrast, linoleic acid is known to directly induce oxidative stress (Greene and Hammock 1999; Turpeinen et al. 1999; Sasaki et al. 2003; Reiterer et al. 2004; Terrasa et al. 2005).
MATERIAL AND METHODS
Materials
The following materials were obtained from the source indicated. L-homocysteic acid, dimethyl sulfoxide, xylenol orange, ammonium ferrous sulfate, sorbitol (Sigma St. Louis, MO); baicalein, 5,6,7,-trihydroxyflavone (BL15; Oxford Biomedical Research, Oxford, MI); herbimycin A, geldanamycin (EMD Biosciences, San Diego, CA); linoleic acid (Nu-Chek Prep, Elysian, MN); α-tocotrienol and α-tocopherol (Carotech Bhd, Malaysia). For cell culture, Dulbecco’s modified Eagle medium, minimum essential medium, fetal calf serum and penicillin and streptomycin were purchased from Invitrogen Corporation, Carlsbad, CA. Culture dishes were obtained from Nunc, Denmark.
Cell Culture
Mouse hippocampal HT4 neural cells were grown in Dulbecco’s modified Eagle’s medium supplemented with 10% fetal calf serum, 100 units/ml penicillin, and 100 μg/ml streptomycin at 37 °C in a humidified atmosphere of 95% air and 5% CO2 as described previously (Tirosh et al. 1999; Sen et al. 2000; Tirosh et al. 2000; Khanna et al. 2003; Sen et al. 2004).
Treatment with neurotoxic agents
Immediately before experiments, the culture medium was replaced with fresh medium supplemented with serum and antibiotics. L-homocysteic acid (1 mM) was added to the medium as an aqueous solution (Sen et al. 2000; Khanna et al. 2003). Homocysteic acid was diluted from 100-fold concentrated solutions that were adjusted to pH 7.5. For linoleic acid (18:2) treatment, stock solutions (103X of working concentration) were prepared in ethanol. Linoleic acid was dissolved in serum before adding to cells. Respective controls were treated with equal volume (0.1%, v/v) of ethanol in serum.
Vitamin E treatment
Stock solutions (103X of working concentration) of α-tocotrienol and α-tocopherol were prepared in ethanol. Respective controls were treated with equal volume (0.1%, v/v) of ethanol. In cases of pre-treatment, α tocotrienol or α-tocopherol was added to the culture dishes 5 min before exposure to homocysteic or linoleic acid.
Primary cortical neurons
Cells were isolated from the cerebral cortex of rat feti (Sprague-Dawley, day 17 of gestation) as described (Murphy et al. 1990; Khanna et al. 2003). After isolation from the brain, cells were counted and seeded on culture plates at a density of 2–3 x 10⁶ cells per well of six-well plates (Murphy et al. 1990). Cells were grown in minimal essential medium supplemented with 10% heat-inactivated fetal bovine serum, 40 μM cystine, and antibiotics (100 μg/ml streptomycin, 100 units/ml penicillin, and 0.25 μg/ml amphotericin). Cultures were maintained at 37°C in 5% CO2 and 95% air in a humidified incubator. All experiments were carried out 24 h after plating (Khanna et al. 2003).
Determination of cell viability
The viability of cells in culture was assessed by measuring the leakage of lactate dehydrogenase (LDH) (Han et al. 1997a) from cells to media 18–24 h following homocysteic acid or linoleic acid (18:2) treatment using the in vitro toxicology assay kit from Sigma Chemical Co. (St. Louis, MO, USA). The protocol has been described in detail in previous reports (Han et al. 1997b; Han et al. 1997a). In brief, LDH leakage was determined using the following equation: % of total LDH leaked = (LDH activity in the cell culture media / total LDH activity)*100 where total LDH activity = LDH activity in cell monolayer + LDH activity of detached cells + LDH activity in the cell culture media (Sen et al. 2000; Khanna et al. 2003; Khanna et al. 2005b). The approach has been used to measure necrotic (Steiner et al. 2000; Lopez et al. 2003) as well as apoptotic (Liu et al. 2003; Kajta et al. 2004) death of neurons. The LDH release approach has been utilized to study neurotoxicity caused by HCA (Parsons et al. 1998) as well as by oxidative stress (Kraus et al. 2005).
c-Src over-expression
Following 18h of seeding, HT4 cells were transfected with an eukaryotic expression vector containing mouse Src (activated or kinase-dead) cDNA under the control of a cytomegalovirus promoter (Upstate Biotechnology, Inc., Lake Placid, NY). The kinase activating mutation (srcY529F) is a substitution of phenylalanine for tyrosine at position 529. The kinase-inactivating mutation (srcK297R) is a substitution of arginine for lysine at position 297 (Sen et al. 2000; Khanna et al. 2005b). Lipofectamine 2000 (Invitrogen, Carlsbad, CA) was used to carry out the transfection. After 3h of lipofectamine treatment, the transfection reagent was replaced with regular cell culture medium. The cells were maintained in regular culture condition for 24h to allow for protein expression. At this point, the cells were harvested and seeded for treatment with tocotrienol, BL15 and/or homocysteic acid. After 12h of seeding, culture medium was changed, and cells were treated as described (Fig. 2B). To assess the level of c-Src expression, HT4 cells were harvested 24h after transfection, seeded for 12h and collected for analysis of protein expression by Western blot (Fig. 2A). The protein concentrations were determined using BCA protein reagents. Samples (20 μg of protein/lane) were electrophoresed on a 10% SDS-polyacrylamide gel, and probed with anti-c-Src (Upstate cell signaling solutions, Lake Placid, NY). To evaluate the loading efficiency, membranes were stripped and re-probed with anti β-actin antibody (Sigma).
Figure 2. Involvement of c-Src kinase activity in homocysteic acid induced neuronal death and its sensitivity to α-tocotrienol.
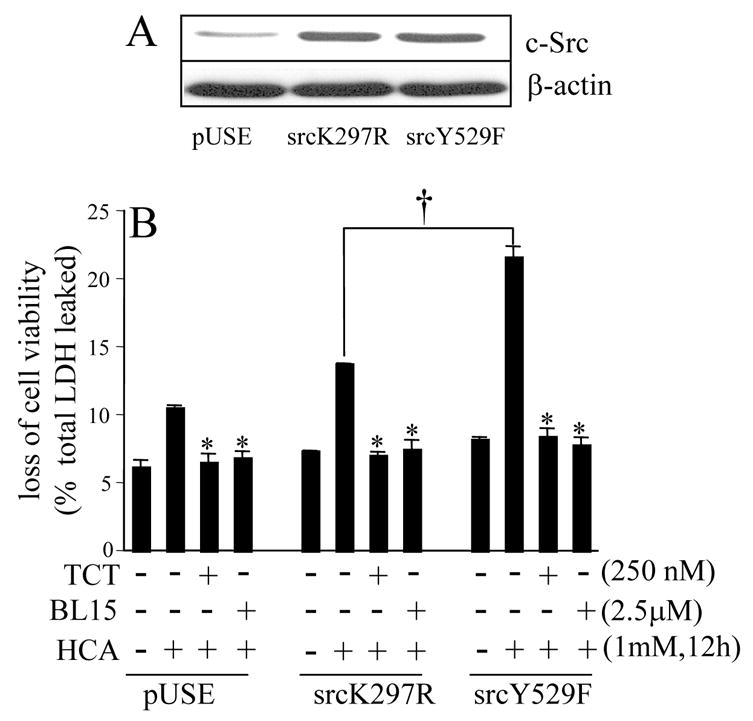
A, Western blot demonstrating over-expression of kinase-dead (K297R) and kinase-active (Y529F) c-Src protein in HT4 neuronal cells. pUSE, empty plasmid control. B, active (Y529F), but not kinase-dead (K297R), c-Src accelerated HCA-induced cell death. Both TCT (0.25μM) as well as BL15 (2.5μM) protected against the toxic effects of active c-Src. *, lower than group treated with HCA alone; †, higher in Y529F than in K297R group treated with HCA. TCT, α-tocotrienol.
12-Lipoxygenase over-expression
This procedure was performed as described previously (Khanna et al. 2003). Following 18 h of seeding, HT4 cells were transfected with plasmid pcDNA3.1+12-Lox (ResGen, Invitrogen) or empty pcDNA3.1 using Lipofectamine 2000 transfection reagent (Invitrogen, Carlsbad, CA.). The experiment was performed the same way as for c-Src over-expression described above. After 12 h of seeding, the culture medium was changed, and cells were treated as described in Figure 4. To assess the level of 12-Lox protein expression, HT4 cells were harvested 24h after transfection, seeded for 12h and harvested for extraction of protein. The sample protein concentrations were determined using the BCA protein reagents. Samples (10 μg of protein/lane) were separated by 10% SDS-polyacrylamide gel electrophoresis, and probed with anti 12-Lox polyclonal antiserum (Cayman Chemical Co., Inc., Ann Arbor, MI). To evaluate the loading efficiency, membranes were stripped and re-probed with anti β-actin antibody (Sigma St. Louis, MO).
Figure 4. Involvement of 12-lipoxygenase in homocysteic acid induced neuronal death and its sensitivity to α-tocotrienol.
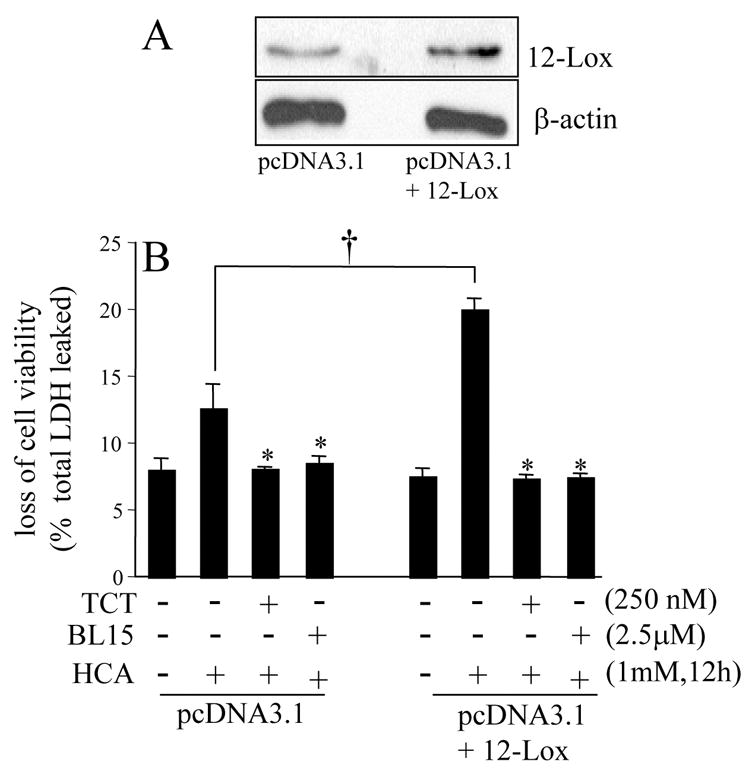
A, Western blot demonstrating over-expression of 12-lipoxygenase (12-Lox) in HT4 cells. pcDNA3.1, empty plasmid control; pcDNA3.1+12-Lox, 12-Lox expression vector. B, 12-Lox over-expression accelerated HCA-induced cell death. Both TCT (0.25μM) as well as BL15 (2.5μM) protected against the toxic effects of 12-Lox. *, lower than group treated with HCA alone; †, HCA induced more toxicity in 12-Lox over-expressing cells than in control cells. TCT, α-tocotrienol.
siRNA delivery and analysis of genes and proteins
Cells (0.1x10⁶ cells/well in 12-well plate) were seeded in antibiotic-free medium for 24h prior to transfection. DharmaFECT™ 1 transfection reagent (Dharmacon RNA technologies, Lafayette, CO) was used to transfect cells with 100nM siRNA pool (Dharmacon RNA technologies, Lafayette, CO) for 72h according to manufacturer’s protocol. For control, siControl non-targeting siRNA pool (mixture of 4 siRNA, designed to have ≥4 mismatches with the corresponding mouse gene) was used. A transfection efficiency of >90% was achieved. Cells were harvested and seeded for treatment with tocotrienol, BL15 and/or homocysteic acid as indicated in respective figure legends. After 12h of seeding, culture media was changed and the cells were treated as described in the respective figure legends. For quantification of mRNA and protein expression, samples were collected after 72h of siRNA transfection. Total RNA was isolated from cells using the Absolutely RNA® Miniprep kit (Stratagene, La Jolla, CA). The abundance of mRNA for c-Src and 12-lipoxygenase were quantitated using real-time PCR.
The double-stranded DNA binding dye SYBR green-I was used. The following primer sets were used:
m_GAPDH F: 5′- ATG ACC ACA GTC CAT GCC ATC ACT -3′
m_GAPDH R: 5′- TGT TGA AGT CGC AGG AGA CAA CCT -3′
m_12-Lox F: 5′-ACC CCT ACT ACA TCC AGG CTT CCA-3′
m_12-Lox R: 5′-TGA CAT CCG CCC TAT ATG CTG AA-3′
m_c-Src F: 5′-TCC ACA CCT CTC CGA AGC AA-3′
m_c-Src R: 5′-CAT GCT GAT GGC CTG TGT CA-3′
After protein extraction, protein concentrations were determined using BCA protein reagents. Samples (20 μg of protein/lane) were separated on a 10% SDS-polyacrylamide gel electrophoresis, and probed with anti-c-Src and ant-12-lipoxygenase antibodies. To evaluate the loading efficiency, membranes were probed with anti-β-actin antibody (Khanna et al. 2005b).
Reduced and oxidized glutathione assay
Reduced (GSH) and oxidized (GSSG) glutathione were detected simultaneously from HT4 cell acid lysates using HPLC coulometric electrode array detector (CoulArray Detector, model 5600 with 12 channels; ESA Inc., Chelmsford, MA) as described previously (Sen et al. 2002; Khanna et al. 2003; Khanna et al. 2005b). The CoulArray detector employs multiple channels set at specific redox potentials as described (Roy et al. 2002). Data were collected using channels set at 600, 700, and 800 mV. The samples were snap-frozen and stored in liquid nitrogen until HPLC assay. Sample preparation, composition of the mobile phase, and specification of the column used have been previously reported (Sen et al. 2000; Sen et al. 2002).
Determination of intracellular Ca2+
Intracellular free Ca2+ levels were measured using cell-permeant calcium green-1, acetomethoxyl ester (Molecular Probes, Eugene, OR) as described previously (Tirosh et al. 2000). Following different treatments, cells were washed three times with PBS. Cells were detached from monolayer using trypsin, and centrifuged (600g, 5 min). After another wash, the cells were resuspended in PBS and loaded with the acetomethoxyl ester of calcium green-1 (1 μM) for 20 min at room temperature. For the detection of intracellular fluorescence, the fluorochrome-loaded cells were excited using a 488-nm argon-ion laser in a flow cytometer. The emission was recorded at 530 nm. Data were collected from at least 10,000 cells per sample.
Visualization of reactive oxygen species in live cells
The Image-iT™ live green reactive oxygen species detection system (Molecular Probes, Eugene, OR) was used to visualize reactive oxygen species in live HT4 cells. This new assay approach is based on 5-(and-6)-carboxy-2′,7′-dichlorodihydrofluorescein diacetate (carboxy-H2DCFDA) (Armeni et al. 2004; Minami et al. 2005). The non-fluorescent carboxy-H2DCFDA permeates live cells and is deacetylated by nonspecific intracellular esterases. In the presence of nonspecific reactive oxygen species, the reduced fluorescein compound is oxidized and emits bright green. Fluorescence microscopy (Axiovert 200M, Zeiss, Germany) was performed to capture images of nuclei (blue-fluorescent, Hoechst 33342) and oxidized fluorescein.
Determination of lipid hydroperoxides
For lipid hydroperoxide measurement, the ferrous oxidation in xylenol orange or FOX1 assay was used (Jiang et al. 1992; Bleau et al. 1998). After 4h of treatment with linoleic acid (or not), cells were washed and collected in PBS. Cells were homogenized on ice and the homogenate was used to measure lipid hydroperoxides.
Measurement of mitochondrial membrane potential
Mitochondrial membrane potential was measured using fluorescent lipophilic cationic dye tetramethylrhodamine methyl ester (TMRM, Molecular Probes, Eugene, OR), which accumulates within mitochondria in a potential-dependent manner (Reid et al. 2005). Following 24h of seeding, cells were exposed to the desired concentrations of HCA or linoleic acid for the specified time period. The cells were then resuspended in Hanks’ balanced salt solution (HBSS) and stained with 4μM TMRM for 15 min at 37 °C in the dark. The cells were washed twice with ice-cold PBS, and the fluorescence was measured using a fluorometer (Cytofluor II, PerSeptive Biosystems, Inc, Framingham, MA) at excitation and emission wavelengths of 530 and 590 nm.
Statistical analyses
Data are reported as mean ± S.D. of at least three experiments. Comparisons between multiple groups were made by analysis of variance (ANOVA). p<0.05 was considered statistically significant.
RESULTS
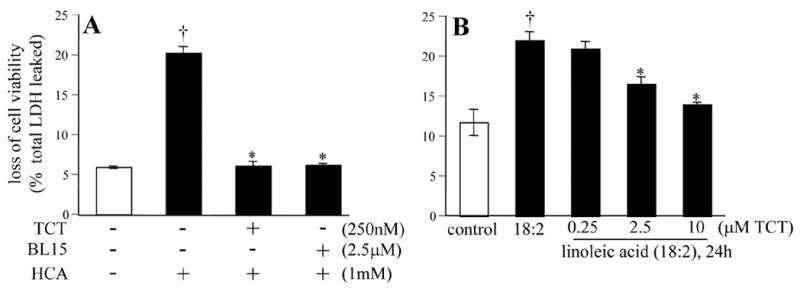
Treatment of HT4 neural cell line with homocysteic acid (HCA) resulted in overt toxicity within the first 24h of exposure. Such HCA-induced death of HT4 cells was completely prevented in cells pre-treated with nanomolar concentration of α-tocotrienol. At comparable doses, α-tocopherol failed to protect the cells against HCA-induced toxicity demonstrating increased neuroprotective ability of α-tocotrienol when compared to its better known isoform α-tocopherol (Fig. 1A). Counting of cells following a trypan blue stain revealed that 95% of the cells were viable under control conditions. Treatment of cells with HCA for 24h as shown in Fig. 1A resulted in the death of 91% of cells. At nanomolar concentration α-tocotrienol decreased, albeit not completely, HCA-induced loss of cell viability even when treated 8h after HCA challenge (Fig. 1B). At such late stage, micromolar concentration of α-tocotrienol had a more significant protective effect (Fig. 1B). These results point towards a difference in the mechanism of action of nanomolar compared to micromolar α-tocotrienol. Neurotoxicity caused by HCA was significantly prevented by pharmacological inhibitors of c-Src kinase and 12-lipoxygenase suggesting the possible involvement of these pathways in the neurodegenerative process (Fig. 1A). To establish the significance of c-Src kinase in HCA-induced neurotoxicity, a genetic approach was employed. HT4 cells were transfected with activated (Y529F) c-Src, kinase-dead (K297R) c-Src, or the corresponding empty vector (pUSE). Such transfection significantly increased c-Src protein expression (Fig. 2A). To test whether over-expression of active c-Src exacerbates HCA-induced neurotoxicity, we chose to study cells treated with HCA for 12h. At this time point, HCA induced loss of viability of very few cells offering the opportunity to investigate exacerbation of toxicity. Akin to control cells transfected with empty vector pUSE, cells over-expressing kinase-dead (K297R) c-Src exhibited marginal toxicity in response to HCA treatment. Over-expressiion of kinase active (Y529F) c-Src, however, clearly accelerated HCA-induced cell death (Fig. 2B). HCA-induced death in basal as well as in active c-Src over-expressed cells was completely prevented by nanomolar α-tocotrienol (Fig. 2B). These findings indicate that c-Src executes HCA-induced neurotoxicity and that nanomolar α-tocotrienol is capable of not only preventing HCA-induced death but that exacerbated in the presence of excess active c-Src as well. To test whether c-Src directly participates in the causation of HCA-induced neural cell death, we adopted the knock-down approach. c-Src knock-down was performed using siRNA (Fig. 3). Cells with c-Src knock-down were observed to be significantly resistant to HCA-induced loss of viability (Fig. 3).
Figure 1. Protection against homocysteic acid induced toxicity.
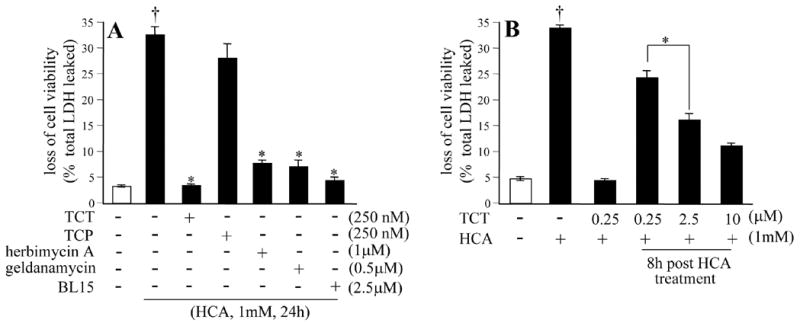
A, HT4 cells were either treated or not with α-tocotrienol (TCT), α-tocopherol (TCP), BL15, herbimycin, or geldanamycin (as indicated) for 5 min and challenged with homocysteic acid (HCA, 1mM) for 24h. B, higher (μM), but not lower (nM), concentration of TCT protected cells when TCT was treated 8h after HCA challenge. HT4 neuronal cells were either treated or not with TCT for 5 min pre or 8h after HCA. Viability was measured 24h after HCA challenge. †, higher than control (no HCA) group. *, lower than group treated with HCA alone.
Figure 3. Knock-down of c-Src attenuated homocysteic acid (HCA) induced cell death.

Transfection with c-Src siRNA decreased c-Src mRNA (A; *, lower in c-Src siRNA group compared to control siRNA group) and protein (B) expression. C, c-Src knock-down attenuated HCA-induced loss of cell viability. The results of BL-15 and TCT treatment are shown in these siRNA transfected cells as positive control for complete protection. †, lower than HCA control siRNA; *, lower than corresponding HCA-treated group. Results are mean ± S.D. p<0.05.
The pharmacological inhibitor of 12-lipoxygenase, BL15, prevented neurotoxicity caused by HCA in the presence of excess active c-Src (Fig. 2B). These findings suggest that the ability of c-Src to execute death in HCA-challenged neural cells is dependent on the activity of 12-lipoxygenase. We were therefore led to test the significance of 12-lipoxygenase in HCA-induced cell death. To address that goal, 12-lipoxygenase was over-expressed in HT4 cells (Fig. 4A). Compared to control cells transfected with the empty vector pcDNA3.1, cells over-expressing 12-lipoxygenase were sensitized to HCA-induced death (Fig. 4B). HCA-induced death of basal as well as in 12-lipoxygenase over-expressed cells was completely prevented by nanomolar α-tocotrienol and by BL15 (Fig. 4B). To test the significance of 12-Lox as a trigger of HCA-induced neural cell death, we performed studies with knock-down cells. 12-Lox knock-down was performed using siRNA (Fig. 5A&B). Cells with 12-Lox knockdown were significantly resistant to HCA-induced loss of viability (Fig. 5C). These findings firmly establish that 12-lipoxygenase is a central executioner of HCA-induced neurotoxicity and that nanomolar α-tocotrienol is capable of not only preventing HCA-induced death but that exacerbated in the presence of excess 12-lipoxygenase as well.
Figure 5. Knock-down of 12-lipoxygenase attenuated homocysteic acid (HCA) induced nerve cell death.
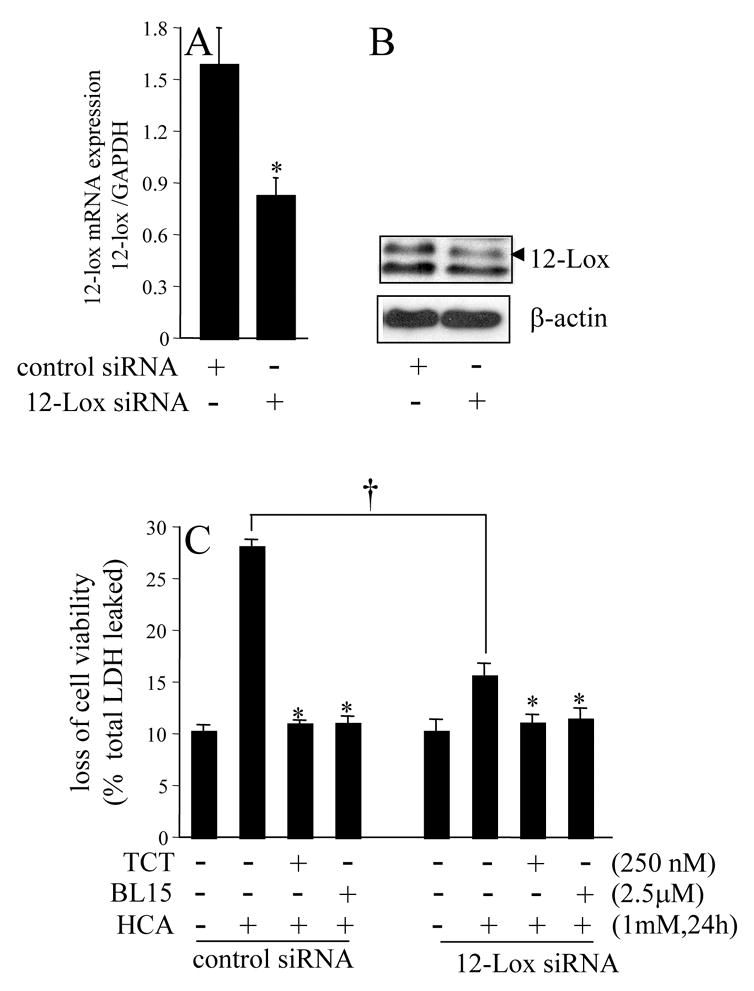
Transfection with 12-Lox siRNA decreased 12-Lox mRNA (A; *, lower in 12-Lox siRNA group compared to control siRNA group) and protein (B) expression. C, 12-Lox knock-down attenuated HCA-induced loss of cell viability. The results of BL-15 and TCT treatment are shown in these siRNA transfected cells as positive control for complete protection. †, lower than HCA control siRNA; *, lower than corresponding HCA-treated group. Results are mean ± S.D. p<0.05.
HCA-induced neurotoxicity was associated with oxidant insult. Cellular oxidant load rapidly manifests in the form of glutathione oxidation and loss (O’Donovan and Fernandes 2000; Sen 2000). Thus, we sought to monitor the levels of reduced (GSH) and oxidized (GSSG) glutathione in cells challenged in HCA. HCA caused rapid oxidation and loss of cellular GSH. Significant changes were noted already in 2h after HCA treatment. The changes became more prominent at 6h after challenge of HT4 cells with HCA (Fig. 6). GSSG/GSH ratio serves as a marker of oxidative stress (Sen 2000; Rahman et al. 2005). HCA induced significant increase in cellular GSSG/GSH ratio. While nanomolar α-tocotrienol completely prevented HCA-induced cell death (Figs 1–5), such defense was not associated with protection against loss or oxidation of GSH (Fig. 6). The Image-iT™ assay system (Molecular Probes, Eugene, OR) enables the detection of reactive oxygen species in live cells (Maurer et al. 1999; Konorev et al. 2000). Using that approach, it was possible to visualize the build-up of intracellular reactive oxygen species after challenge of cells with HCA. Using this approach, overt accumulation of intracellular ROS was detected in part at 4h. The response was more overt at 8h (Fig. 7). Micromolar α-tocotrienol completely prevented HCA-induced accumulation of intracellular ROS (Fig. 7). These results support the antioxidant efficacy of micromolar, but not nanomolar, α-tocotrienol.
Figure 6. Homocysteic acid induced cellular glutathione oxidation.
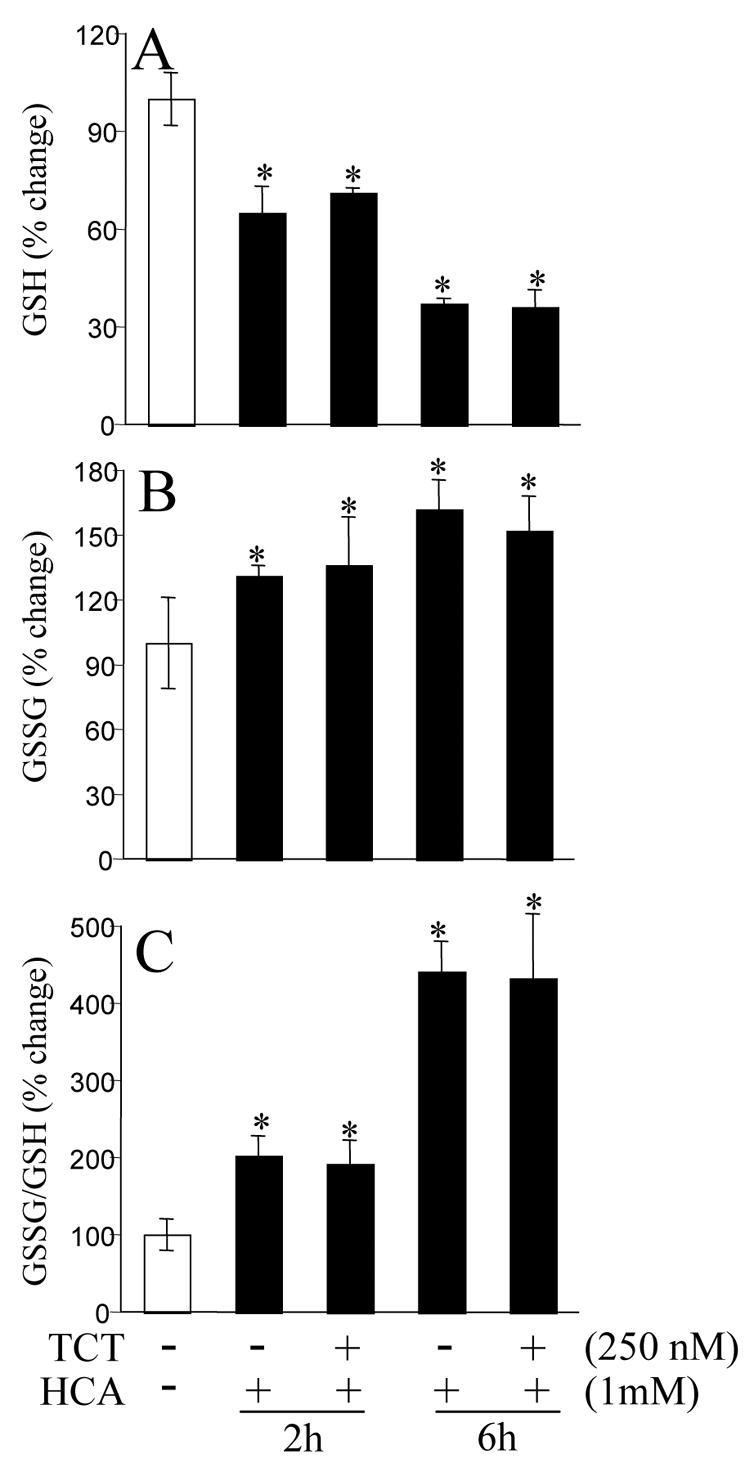
A, HT4 cell GSH levels; B, cellular GSSG levels; C, cellular GSSG/GSH ratio as a marker of oxidative stress. *, significantly different from cells not treated with HCA. TCT, α-tocotrienol.
Figure 7. Homocysteic acid induced elevation of cellular reactive oxygen species.

Reactive oxygen species (ROS) production in live cells was visualized using the Image-iT™ system from Molecular Probes. In 8h, most of the cells were ROS-positive (green). Pretreatment of cells with micromolar (2.5 μM) TCT completely eliminated the green ROS signal. Nuclei are stained in blue.
Treatment of cells with HCA resulted in marked increase in [Ca2+]i and simultaneous loss of mitochondrial membrane potential (Δψ ). Both cellular responses were observed in the late phase of HCA treatment. While the changes were not significant up to 4h after HCA challenge, at 8h after HCA treatment changes in [Ca2+]i and mitochondrial Δψ were highly significant (Fig. 8). Of note, at this time point no change in cell viability was observed in response to HCA treatment. Thus, the observed changes in [Ca2+]i and Δψ were not a mere consequence of dying cells. Both of these adverse cellular responses were prevented in the presence of nanomolar α-tocotrienol (Fig. 8). These observations indicate that oxidation and loss of GSH, as noted under the given experimental conditions, was not a critical determinant of cell survival. Nanomolar α-tocotrienol did not seem to serve simply as an antioxidant to protect against HCA-induced death. Nanomolar α-tocotrienol, however, was effective in preventing HCA-induced perturbations in [Ca2+]i and Δψ .
Figure 8. Homocysteic acid induced changes in [Ca2+]i and mitochondrial Δψ.
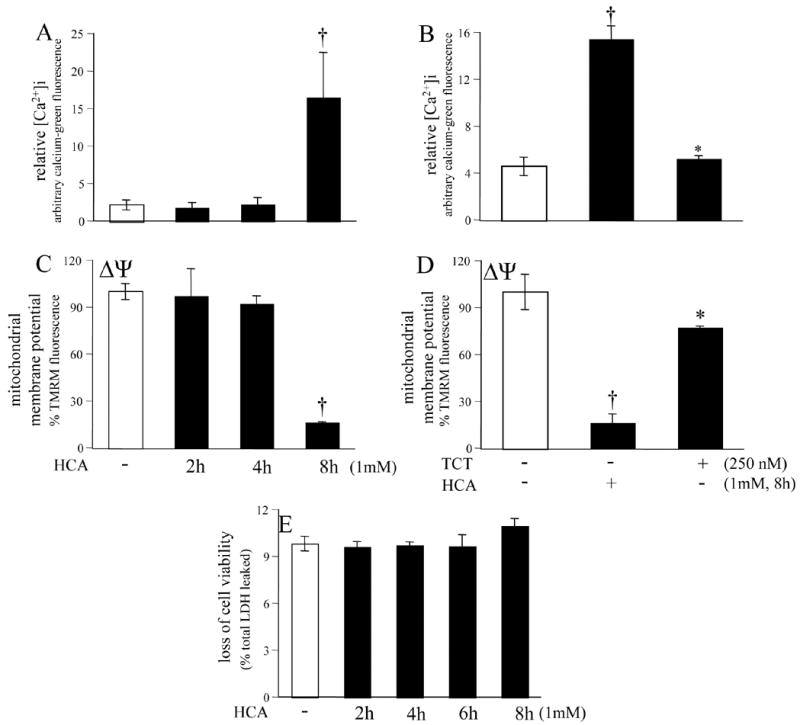
†, different than control (open bar); *, different than cells treated with HCA alone. TMRM, tetramethylrhodamine methyl ester. TCT, α-tocotrienol. E, there was no significant change in cell viability during the time frame studied.
The ω-6 polyunsaturated fatty acid, linoleic acid, induced neurotoxicity at a threshold dose of 50 μM (Fig. 9A). Overt toxicity was induced by linoleic acid in 12h, but maximal effects were noted in 24h (Fig. 9B). In this system of neurodegeneration, known to be primarily caused by oxidative stress (Greene and Hammock 1999; Turpeinen et al. 1999; Sasaki et al. 2003; Reiterer et al. 2004; Terrasa et al. 2005), nanomolar α-tocotrienol failed to protect. In contrast to the situation observed with HCA, both α-tocotrienol and α-tocopherol exhibited comparable protective effects at micromolar concentrations (Fig. 9C). Linoleic acid induced neurotoxicity was associated with oxidative stress. Elevated levels of reactive oxygen species was detected in linoleic acid treated live cells. Micromolar, but not nanomolar, α-tocotrienol completely prevented such build-up of reactive oxygen species (Fig 10A-D). These observations again indicate that at nanomolar concentration, α-tocotrienol is not an effective antioxidant. Additional evidence along this line was generated by estimating the levels of lipid hydroperoxides in cells treated with linoleic acid. Exposure of cells to linoleic acid resulted in clear increase in lipid hydroperoxide levels as measured using the FOX1 assay. Such oxidative stress response was not sensitive to nanomolar α-tocotrienol. Micromolar α-tocotrienol, however, significantly prevented linoleic acid induced formation of lipid hydroperoxides (Fig. 10E). Analysis of cellular glutathione status confirmed that micromolar, but not nanomolar, α-tocotrienol serves as an antioxidant. Linoleic acid induced loss of GSH, increased GSSG, and increased GSSG/GSH ratio. All of these changes were sensitive to micromolar α-tocotrienol, but not to nanomolar α-tocotrienol (Fig. 11A-C). In the linoleic acid system of neurotoxicity that relies primarily on oxidative stress, cell death was associated with increased [Ca2+]i and compromised mitochondrial Δψ . These adverse cellular responses were sensitive to micromolar, but not nanomolar, α-tocotrienol (Fig. 12A-B).
Figure 9. Linoleic acid induced neurotoxicity.
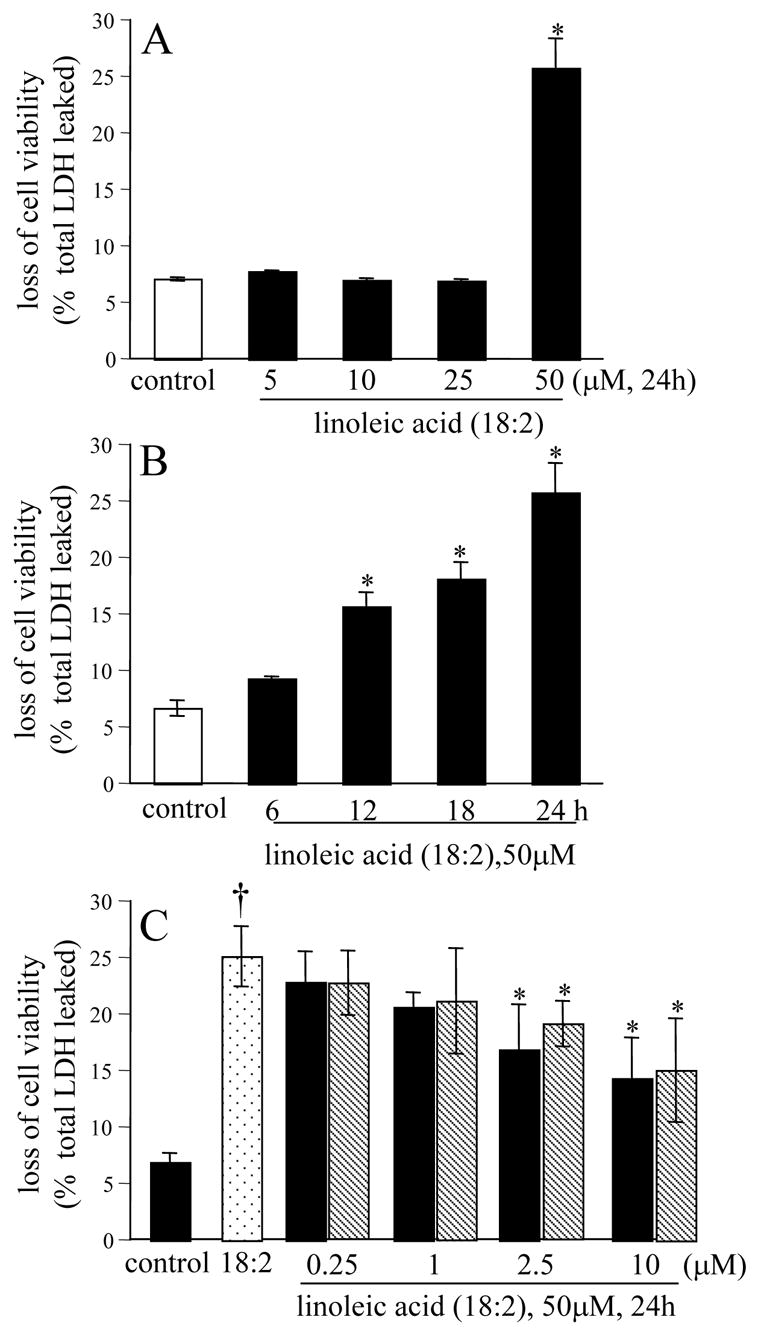
A, comparison of the doses of linoleic acid (18:2), *, higher than control; B, time-course of toxicity, *, higher than control; C, micromolar, but not nanomolar, concentrations of vitamin E protected against linoleic acid induced toxicity. Solid bar, α-tocotrienol; hatched bar, α-tocopherol. †, higher than control; *, lower than cells challenged with 18:2 alone.
Figure 10. Linoleic acid induced oxidative stress.
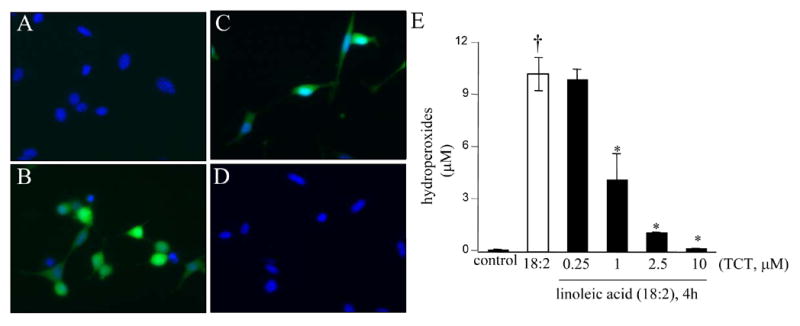
A-D, reactive oxygen species production in live cells was visualized using the Image-iT™ system from Molecular Probes. A, control (to B, passage and time matched); B, linoleic acid (50 μm, 4h); C, linoleic acid (50 μm, 4h) pre-treated (5 min) with 250 nM μ-tocotrienol; D, linoleic acid (50 μm, 4h) pre-treated with 2.5 μM α-tocotrienol; E, lipid hydroperoxide levels assayed using the Fox-1 method. HT4 cells were pre-treated with specified concentration of α-tocotrienol for 5 minute prior to exposure to linoleic acid (50 μM). After 4h of linoleic acid exposure, cells were harvested to measure hydroperoxides. †, higher than control (not treated with 18:2); *, lower than the group treated with 18:2 alone. TCT, α-tocotrienol.
Figure 11. Linoleic acid induced cellular glutathione oxidation and loss.
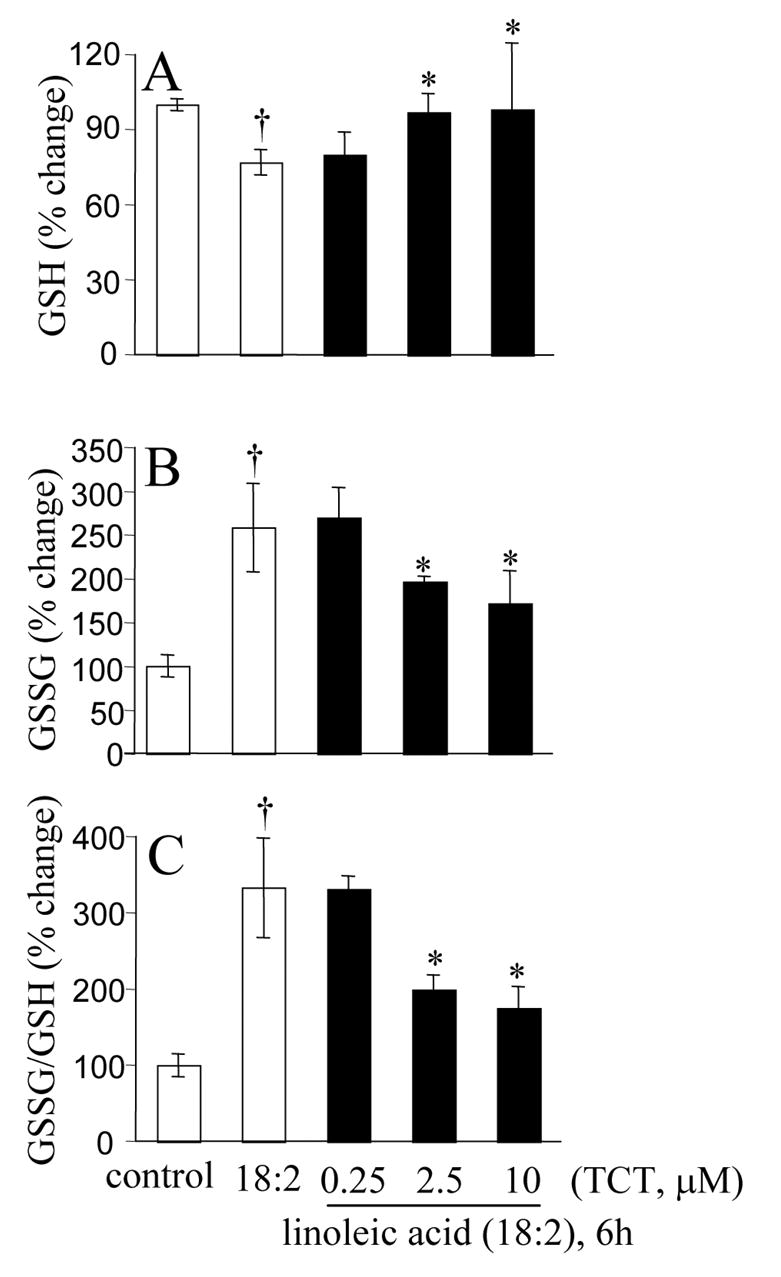
A, cellular GSH levels; B, cellular GSSG levels; C, cellular GSSG/GSH ratio as a marker of oxidative stress. †, higher than control (not treated with 18:2); *, significantly lower than in cells treated with linoleic acid alone. TCT, α-tocotrienol.
Figure 12. Linoleic acid induced changes in [Ca2+]i and mitochondrial Δψ.

†, different than control (open bar); *, different than cells treated with 18:2 alone. TMRM, tetramethylrhodamine methyl ester. TCT, α-tocotrienol.
Finally, we sought to verify whether the protective effects of nanomolar α-tocotrienol against HCA and that of micromolar α-tocotrienol against holds good in primary neurons. The study of immature primary cortical neurons resulted in findings that were tightly consistent with the results from the HT4 neural cell line. While nanomolar α-tocotrienol protected cells against HCA, it failed to protect neurons against linoleic acid. Neuronal cell death caused by linoleic acid was successfully attenuated by micromolar α-tocotrienol (Fig. 13).
Figure 13. Protective effects of α-tocotrienol in primary cortical neurons.
A, Neurons were either treated or not with α- tocotrienol (TCT) or BL15 for 5 min and challenged with homocysteic acid (HCA, 1mM) for 24h; B, Neurons were either treated or not with different doses of TCT as indicated for 5 min and then challenged with linoleic acid (25 μM) for 24h. †, higher than corresponding control (open bar); *, lower than corresponding HCA or linoleic acid treated group. Results are mean ± S.D. p<0.05.
DISCUSSION
Hyperhomocysteinemia is a risk factor for vascular and neuronal lesions often observed with concomitant high levels of HCA. HCA, an oxidized metabolite of homocysteine, induces neurotoxicity (Hasegawa et al. 2005). HCA, an endogenous agonist for glutamatergic N-methyl-D-aspartate receptors, is predominantly localized in glial cells (Benz et al. 2004). In contrast to homocysteine, HCA induces calcium influx into neurons, with characteristics of an excitotoxic glutamatergic agonist at elevated concentrations (Sommer et al. 2004). HCA disrupts calcium homeostasis and induces degeneration of neurons in vivo (Adalbert et al. 2002). Recently it has been demonstrated that glutamate induces the release of the excitatory amino acid HCA from astrocytes following the stimulation of ionotropic and metabotropic L-glutamate receptors (Benz et al. 2004). In this work, a previously established model of HCA-induced neurotoxicity was investigated (Khanna et al. 2003; Ryu et al. 2003). Our findings show that c-Src facilitates HCA-induced neurotoxicity. c-Src is heavily expressed in the brain (Soriano et al. 1991) and in human neural tissues (Pyper and Bolen 1989). Differentiating rodent neurons are known to express high levels of c-Src. Initially, c-Src was identified as being important in growth cone-mediated neurite extension and synaptic plasticity (Maness et al. 1988) and in neuronal differentiation (Ingraham et al. 1989). Targeted disruption of c-Src, however, did not cause any abnormality in the brain (Soriano et al. 1991). Our laboratory presented the first evidence demonstrating that c-Src plays a central role in executing glutamate-induced death of HT4 neural cells (Sen et al. 2000). Consistently, it was demonstrated in a subsequent report that Src deficiency or blockade of Src activity in mice provides cerebral protection following stroke. Thus, Src emerged as a key intermediate and novel therapeutic target in the pathophysiology of cerebral ischemia (Paul et al. 2001). Recently it has been confirmed that the Src family kinase-inhibitor PP2 reduces focal ischemic brain injury (Lennmyr et al. 2004). This study presents the first evidence indicating the involvement of c-Src in HCA-induced neurotoxicity.
Lipoxygenases, mainly 5-, 12- and 15-Lox, are named for their ability to insert molecular oxygen at the 5, 12, or 15-carbon atom of arachidonic acid forming a distinct hydroperoxy-eicosatetraenoic (HPETE) acid (Yamamoto 1992). 12-Lox produces 12(S)-HPETE which is further metabolized into four distinct products: an alcohol [12(S)-HETE], a ketone (12-keto-eicosatetraenoic acid), or two epoxy alcohols (hepoxilin A3 and B3). Immunohistochemical studies revealed the occurrence of 12-Lox in neurons; particularly in hippocampus, striatum, olivary nucleus, as well as in glial and in cerebral endothelial cells (Nishiyama et al. 1992; Nishiyama et al. 1993). Using immature cortical neurons and HT neural cells, it has been shown that a decrease in [GSH]i triggers the activation of neuronal 12-Lox, which leads to the production of peroxides, the influx of Ca2+, and ultimately to cell death (Li et al. 1997). We have previously reported a central role of 12-Lox in glutamate-induced death of primary neuronal cultures by demonstrating that 12-Lox deficient neurons are resistant to glutamate-induced toxicity (Khanna et al. 2003). Furthermore, we have recently demonstrated that 12-Lox deficient mice are substantially protected against damage to the brain tissue caused by stroke in vivo (Khanna et al. 2005b). This work presents the first evidence depicting 12-Lox as a central player in HCA-induced neurotoxicity.
Involvement of c-Src and 12-Lox represent the hallmark of glutamate-induced neurotoxicity (Sen et al. 2000; Khanna et al. 2002; Khanna et al. 2003; Khanna et al. 2005b). Thus, involvement of c-Src and 12-Lox in HCA-induced neurotoxicity may be viewed as a parallel between the two death pathways. This observation is consistent with previous reports indicating that HCA and glutamate kills neurons by comparable mechanisms (Sagara et al. 2002; Baydas et al. 2005). We have previously characterized that glutamate-induced neurotoxicity involves an early signaling component and a late oxidant-insult component. c-Src and 12-Lox represent central players in the early signaling component. Inducible activation of both of these signaling mediators is inhibited by nanomolar α-tocotrienol (Sen et al. 2000; Khanna et al. 2003). Results of this study support that while nanomolar α-tocotrienol is capable of protecting neurons from HCA-induced neurotoxic signaling, it does not serve potent antioxidant functions. This is supported by the current observation that nanomolar α-tocotrienol protects only when treated early on. Micromolar α-tocotrienol was required to safeguard the neural cells when the treatment was performed 8h after glutamate treatment, a time point when oxidant levels in the cell are high.
To further test the hypothesis that nanomolar α-tocotrienol functions via antioxidant-independent mechanism while micromolar α-tocotrienol serves as an antioxidant we investigated linoleic acid induced neurotoxicity. Unsaturated fatty acids rapidly accumulate during ischemia and participate in inducing irreversible brain injury, especially because they are highly susceptible to peroxidation when the tissue is reoxygenated (Zaleska and Wilson 1989). Linoleic acid represents the main polyunsaturated fatty acid in mammals (Spiteller 2001). Linoleic acid induces oxidative stress (Reiterer et al. 2004). A high linoleic acid diet increases oxidative stress in vivo in humans (Turpeinen et al. 1999). Oxidized derivatives of linoleic acid induce oxidative stress (Goodfriend et al. 2004; Lee et al. 2005; Terrasa et al. 2005) and kills PC12 cells (Sasaki et al. 2003). Consistently, it was observed in the current study that exposure to linoleic acid resulted in oxidant-insult and subsequent neurotoxicity. In this experimental system micromolar, but not nanomolar, α-tocotrienol protected the neurons. These findings establish that micromolar, but not nanomolar, α-tocotrienol functions as an antioxidant to protect neurons. Given that after oral supplementation to humans, peak plasma concentration of α-tocotrienol is in the range of 3 micromolar (Khosla et al. 2006), α-tocotrienol may be expected to exert its neuroprotective effects in vivo by both antioxidant-independent as well as antioxidant-dependent mechanisms. Indeed, oral supplementation of α tocotrienol has been observed to protect against stroke in spontaneously hypertensive rats in vivo (Khanna et al. 2005b).
Taken together, although both HCA and linoleic acid caused neurotoxicity with comparable features such as increased GSSG/GSH, elevated [Ca2+]i and compromised mitochondrial Δψ , some fundamental differences in the neurodegenerative pathway were noted. Mechanisms underlying HCA-induced neurodegeneration were comparable to the path implicated in glutamate-induced neurotoxicity. Inducible activation of c-Src and 12-lipoxygenase represented early events in that neurodegenerative pathway. The implication of these data for excitotoxicity is yet unclear. Nanomolar α tocotrienol inhibited both HCA-induced responses conferring neuroprotection to the HCA-challenged neurons. Oxidative stress ensued as a late event in HCA-induced neurotoxicity. Micromolar, not nanomolar, α tocotrienol protected the neural cells by virtue of its antioxidant function. This property was shared between α tocotrienol and α tocopherol. Importantly, although pre-treatment with nanomolar α tocotrienol completely protected against HCA-induced cell death, loss and oxidation of cellular GSH was not prevented. Thus, nanomolar α tocotrienol did not function as an antioxidant. Consistently nanomolar α tocopherol, which is known to have antioxidant properties comparable to that of α tocotrienol, did not protect. The observation that micromolar, but not nanomolar, α tocotrienol functions as an antioxidant was verified in the experimental model involving linoleic acid induced oxidative stress and cell death. Oral supplementation of α tocotrienol to humans results in a peak plasma concentration of 3 micromolar. Thus, it is prudent to conclude that orally supplemented α tocotrienol may protect neurons from toxic insults by antioxidant-independent as well as -dependent mechanisms.
Acknowledgments
This work was supported by NIH RO1 NS42617.
Contributor Information
Savita Khanna, Laboratory of Molecular Medicine, Davis Heart & Lung Research Institute, The Ohio State University Medical Center, Columbus, Ohio 43210.
Narasimham L. Parinandi, Departments of Surgery and Internal Medicine, Davis Heart & Lung Research Institute, The Ohio State University Medical Center, Columbus, Ohio 43210
Mariah Maurer, Laboratory of Molecular Medicine, Davis Heart & Lung Research Institute, The Ohio State University Medical Center, Columbus, Ohio 43210.
Chandan K. Sen, Laboratory of Molecular Medicine, Davis Heart & Lung Research Institute, The Ohio State University Medical Center, Columbus, Ohio 43210
References
- Adalbert R, Engelhardt JI, Siklos L. DL-Homocysteic acid application disrupts calcium homeostasis and induces degeneration of spinal motor neurons in vivo. Acta Neuropathol (Berl) 2002;103:428–436. doi: 10.1007/s00401-001-0485-5. [DOI] [PubMed] [Google Scholar]
- Armeni T, Damiani E, Battino M, Greci L, Principato G. Lack of in vitro protection by a common sunscreen ingredient on UVA-induced cytotoxicity in keratinocytes. Toxicology. 2004;203:165–178. doi: 10.1016/j.tox.2004.06.008. [DOI] [PubMed] [Google Scholar]
- Baydas G, Reiter RJ, Akbulut M, Tuzcu M, Tamer S. Melatonin inhibits neural apoptosis induced by homocysteine in hippocampus of rats via inhibition of cytochrome c translocation and caspase-3 activation and by regulating pro- and anti-apoptotic protein levels. Neuroscience. 2005;135:879–886. doi: 10.1016/j.neuroscience.2005.05.048. [DOI] [PubMed] [Google Scholar]
- Benz B, Grima G, Do KQ. Glutamate-induced homocysteic acid release from astrocytes: possible implication in glia-neuron signaling. Neuroscience. 2004;124:377–386. doi: 10.1016/j.neuroscience.2003.08.067. [DOI] [PubMed] [Google Scholar]
- Bleau G, Giasson C, Brunette I. Measurement of hydrogen peroxide in biological samples containing high levels of ascorbic acid. Anal Biochem. 1998;263:13–17. doi: 10.1006/abio.1998.2801. [DOI] [PubMed] [Google Scholar]
- Boscoboinik DO, Chatelain E, Bartoli GM, Stauble B, Azzi A. Inhibition of protein kinase C activity and vascular smooth muscle cell growth by d-alpha-tocopherol. Biochim Biophys Acta. 1994;1224:418–426. doi: 10.1016/0167-4889(94)90277-1. [DOI] [PubMed] [Google Scholar]
- Dargusch R, Schubert D. Specificity of resistance to oxidative stress. Journal of Neurochemistry. 2002;81:1394–1400. doi: 10.1046/j.1471-4159.2002.00950.x. [DOI] [PubMed] [Google Scholar]
- Goodfriend TL, Ball DL, Egan BM, Campbell WB, Nithipatikom K. Epoxy-keto derivative of linoleic acid stimulates aldosterone secretion. Hypertension. 2004;43:358–363. doi: 10.1161/01.HYP.0000113294.06704.64. [DOI] [PubMed] [Google Scholar]
- Greene JF, Hammock BD. Toxicity of linoleic acid metabolites. Adv Exp Med Biol. 1999;469:471–477. doi: 10.1007/978-1-4615-4793-8_69. [DOI] [PubMed] [Google Scholar]
- Han D, Sen CK, Roy S, Kobayashi MS, Tritschler HJ, Packer L. Protection against glutamate-induced cytotoxicity in C6 glial cells by thiol antioxidants. Am J Physiol. 1997a;273:R1771–1778. doi: 10.1152/ajpregu.1997.273.5.R1771. [DOI] [PubMed] [Google Scholar]
- Han D, Handelman G, Marcocci L, Sen CK, Roy S, Kobuchi H, Tritschler HJ, Flohe L, Packer L. Lipoic acid increases de novo synthesis of cellular glutathione by improving cystine utilization. Biofactors. 1997b;6:321–338. doi: 10.1002/biof.5520060303. [DOI] [PubMed] [Google Scholar]
- Hasegawa T, Ukai W, Jo DG, Xu X, Mattson MP, Nakagawa M, Araki W, Saito T, Yamada T. Homocysteic acid induces intraneuronal accumulation of neurotoxic Abeta42: implications for the pathogenesis of Alzheimer’s disease. J Neurosci Res. 2005;80:869–876. doi: 10.1002/jnr.20514. [DOI] [PubMed] [Google Scholar]
- Hensley K, Benaksas EJ, Bolli R, Comp P, Grammas P, Hamdheydari L, Mou S, Pye QN, Stoddard MF, Wallis G, Williamson KS, West M, Wechter WJ, Floyd RA. New perspectives on vitamin E: gamma-tocopherol and carboxyelthylhydroxychroman metabolites in biology and medicine. Free Radic Biol Med. 2004;36:1–15. doi: 10.1016/j.freeradbiomed.2003.10.009. [DOI] [PubMed] [Google Scholar]
- Ingraham CA, Cox ME, Ward DC, Fults DW, Maness PF. c-src and other proto-oncogenes implicated in neuronal differentiation. Mol Chem Neuropathol. 1989;10:1–14. doi: 10.1007/BF02969481. [DOI] [PubMed] [Google Scholar]
- Jiang ZY, Hunt JV, Wolff SP. Ferrous ion oxidation in the presence of xylenol orange for detection of lipid hydroperoxide in low density lipoprotein. Anal Biochem. 1992;202:384–389. doi: 10.1016/0003-2697(92)90122-n. [DOI] [PubMed] [Google Scholar]
- Kajta M, Lason W, Kupiec T. Effects of estrone on N-methyl-D-aspartic acid- and staurosporine-induced changes in caspase-3-like protease activity and lactate dehydrogenase-release: time- and tissue-dependent effects in neuronal primary cultures. Neuroscience. 2004;123:515–526. doi: 10.1016/j.neuroscience.2003.09.005. [DOI] [PubMed] [Google Scholar]
- Khanna S, Venojarvi M, Roy S, Sen CK. Glutamate-induced c-Src activation in neuronal cells. Methods Enzymol. 2002;352:191–198. doi: 10.1016/s0076-6879(02)52019-x. [DOI] [PubMed] [Google Scholar]
- Khanna S, Patel V, Rink C, Roy S, Sen CK. Delivery of orally supplemented alpha-tocotrienol to vital organs of rats and tocopherol-transport protein deficient mice. Free Radic Biol Med. 2005a;39:1310–1319. doi: 10.1016/j.freeradbiomed.2005.06.013. [DOI] [PMC free article] [PubMed] [Google Scholar]
- Khanna S, Roy S, Ryu H, Bahadduri P, Swaan PW, Ratan RR, Sen CK. Molecular basis of vitamin E action: tocotrienol modulates 12-lipoxygenase, a key mediator of glutamate-induced neurodegeneration. J Biol Chem. 2003;278:43508–43515. doi: 10.1074/jbc.M307075200. [DOI] [PMC free article] [PubMed] [Google Scholar]
- Khanna S, Roy S, Slivka A, Craft TK, Chaki S, Rink C, Notestine MA, DeVries AC, Parinandi NL, Sen CK. Neuroprotective properties of the natural vitamin E alpha-tocotrienol. Stroke. 2005b;36:2258–2264. doi: 10.1161/01.STR.0000181082.70763.22. [DOI] [PMC free article] [PubMed] [Google Scholar]
- Khosla P, Patel V, Whinter J, Khanna S, Rakhkovskaya M, Roy S, Sen CK. Postprandial levels of the natural vitamin E tocotrienol in human circulation. Antioxid Redox Signal. 2006;8 doi: 10.1089/ars.2006.8.1059. in press. [DOI] [PubMed] [Google Scholar]
- Konorev EA, Zhang H, Joseph J, Kennedy MC, Kalyanaraman B. Bicarbonate exacerbates oxidative injury induced by antitumor antibiotic doxorubicin in cardiomyocytes. Am J Physiol Heart Circ Physiol. 2000;279:H2424–2430. doi: 10.1152/ajpheart.2000.279.5.H2424. [DOI] [PubMed] [Google Scholar]
- Kraus RL, Pasieczny R, Lariosa-Willingham K, Turner MS, Jiang A, Trauger JW. Antioxidant properties of minocycline: neuroprotection in an oxidative stress assay and direct radical-scavenging activity. J Neurochem. 2005;94:819–827. doi: 10.1111/j.1471-4159.2005.03219.x. [DOI] [PubMed] [Google Scholar]
- Lee SH, Oe T, Arora JS, Blair IA. Analysis of FeII-mediated decomposition of a linoleic acid-derived lipid hydroperoxide by liquid chromatography/mass spectrometry. J Mass Spectrom. 2005;40:661–668. doi: 10.1002/jms.838. [DOI] [PubMed] [Google Scholar]
- Lennmyr F, Ericsson A, Gerwins P, Akterin S, Ahlstrom H, Terent A. Src family kinase-inhibitor PP2 reduces focal ischemic brain injury. Acta Neurol Scand. 2004;110:175–179. doi: 10.1111/j.1600-0404.2004.00306.x. [DOI] [PubMed] [Google Scholar]
- Li Y, Maher P, Schubert D. A role for 12-lipoxygenase in nerve cell death caused by glutathione depletion. Neuron. 1997;19:453–463. doi: 10.1016/s0896-6273(00)80953-8. [DOI] [PubMed] [Google Scholar]
- Liu R, Liu W, Doctrow SR, Baudry M. Iron toxicity in organotypic cultures of hippocampal slices: role of reactive oxygen species. J Neurochem. 2003;85:492–502. doi: 10.1046/j.1471-4159.2003.01708.x. [DOI] [PubMed] [Google Scholar]
- Lopez E, Figueroa S, Oset-Gasque MJ, Gonzalez MP. Apoptosis and necrosis: two distinct events induced by cadmium in cortical neurons in culture. Br J Pharmacol. 2003;138:901–911. doi: 10.1038/sj.bjp.0705111. [DOI] [PMC free article] [PubMed] [Google Scholar]
- Maness PF, Aubry M, Shores CG, Frame L, Pfenninger KH. c-src gene product in developing rat brain is enriched in nerve growth cone membranes. Proc Natl Acad Sci U S A. 1988;85:5001–5005. doi: 10.1073/pnas.85.14.5001. [DOI] [PMC free article] [PubMed] [Google Scholar]
- Maurer BJ, Metelitsa LS, Seeger RC, Cabot MC, Reynolds CP. Increase of ceramide and induction of mixed apoptosis/necrosis by N-(4-hydroxyphenyl)- retinamide in neuroblastoma cell lines. J Natl Cancer Inst. 1999;91:1138–1146. doi: 10.1093/jnci/91.13.1138. [DOI] [PubMed] [Google Scholar]
- Minami T, Adachi M, Kawamura R, Zhang Y, Shinomura Y, Imai K. Sulindac enhances the proteasome inhibitor bortezomib-mediated oxidative stress and anticancer activity. Clin Cancer Res. 2005;11:5248–5256. doi: 10.1158/1078-0432.CCR-05-0085. [DOI] [PubMed] [Google Scholar]
- Murphy TH, Schnaar RL, Coyle JT. Immature cortical neurons are uniquely sensitive to glutamate toxicity by inhibition of cystine uptake. Faseb J. 1990;4:1624–1633. [PubMed] [Google Scholar]
- Nishiyama M, Watanabe T, Ueda N, Tsukamoto H, Watanabe K. Arachidonate 12-lipoxygenase is localized in neurons, glial cells, and endothelial cells of the canine brain. Journal of Histochemistry & Cytochemistry. 1993;41:111–117. doi: 10.1177/41.1.8417106. [DOI] [PubMed] [Google Scholar]
- Nishiyama M, Okamoto H, Watanabe T, Hori T, Hada T, Ueda N, Yamamoto S, Tsukamoto H, Watanabe K, Kirino T. Localization of arachidonate 12-lipoxygenase in canine brain tissues. Journal of Neurochemistry. 1992;58:1395–1400. doi: 10.1111/j.1471-4159.1992.tb11355.x. [DOI] [PubMed] [Google Scholar]
- O’Byrne D, Grundy S, Packer L, Devaraj S, Baldenius K, Hoppe PP, Kraemer K, Jialal I, Traber MG. Studies of LDL oxidation following alpha-, gamma-, or delta-tocotrienyl acetate supplementation of hypercholesterolemic humans. Free Radical Biology & Medicine. 2000;29:834–845. doi: 10.1016/s0891-5849(00)00371-3. [DOI] [PubMed] [Google Scholar]
- O’Donovan DJ, Fernandes CJ. Mitochondrial glutathione and oxidative stress: implications for pulmonary oxygen toxicity in premature infants. Mol Genet Metab. 2000;71:352–358. doi: 10.1006/mgme.2000.3063. [DOI] [PubMed] [Google Scholar]
- Packer L, Weber SU, Rimbach G. Molecular aspects of alpha-tocotrienol antioxidant action and cell signalling. J Nutr. 2001;131:369S–373S. doi: 10.1093/jn/131.2.369S. [DOI] [PubMed] [Google Scholar]
- Parsons RB, Waring RH, Ramsden DB, Williams AC. In vitro effect of the cysteine metabolites homocysteic acid, homocysteine and cysteic acid upon human neuronal cell lines. Neurotoxicology. 1998;19:599–603. [PubMed] [Google Scholar]
- Paul R, Zhang ZG, Eliceiri BP, Jiang Q, Boccia AD, Zhang RL, Chopp M, Cheresh DA. Src deficiency or blockade of Src activity in mice provides cerebral protection following stroke. Nat Med. 2001;7:222–227. doi: 10.1038/84675. [DOI] [PubMed] [Google Scholar]
- Pearce BC, Parker RA, Deason ME, Qureshi AA, Wright JJ. Hypocholesterolemic activity of synthetic and natural tocotrienols. Journal of Medicinal Chemistry. 1992;35:3595–3606. doi: 10.1021/jm00098a002. [DOI] [PubMed] [Google Scholar]
- Pearce BC, Parker RA, Deason ME, Dischino DD, Gillespie E, Qureshi AA, Volk K, Wright JJ. Inhibitors of cholesterol biosynthesis. 2. Hypocholesterolemic and antioxidant activities of benzopyran and tetrahydronaphthalene analogues of the tocotrienols. Journal of Medicinal Chemistry. 1994;37:526–541. doi: 10.1021/jm00030a012. [DOI] [PubMed] [Google Scholar]
- Pyper JM, Bolen JB. Neuron-specific splicing of C-SRC RNA in human brain. J Neurosci Res. 1989;24:89–96. doi: 10.1002/jnr.490240113. [DOI] [PubMed] [Google Scholar]
- Rahman I, Biswas SK, Jimenez LA, Torres M, Forman HJ. Glutathione, stress responses, and redox signaling in lung inflammation. Antioxid Redox Signal. 2005;7:42–59. doi: 10.1089/ars.2005.7.42. [DOI] [PubMed] [Google Scholar]
- Reid AB, Kurten RC, McCullough SS, Brock RW, Hinson JA. Mechanisms of acetaminophen-induced hepatotoxicity: role of oxidative stress and mitochondrial permeability transition in freshly isolated mouse hepatocytes. J Pharmacol Exp Ther. 2005;312:509–516. doi: 10.1124/jpet.104.075945. [DOI] [PubMed] [Google Scholar]
- Reiterer G, Toborek M, Hennig B. Quercetin protects against linoleic acid-induced porcine endothelial cell dysfunction. J Nutr. 2004;134:771–775. doi: 10.1093/jn/134.4.771. [DOI] [PubMed] [Google Scholar]
- Roy S, Venojarvi M, Khanna S, Sen CK. Simultaneous detection of tocopherols and tocotrienols in biological samples using HPLC-coulometric electrode array. Methods Enzymol. 2002;352:326–332. doi: 10.1016/s0076-6879(02)52029-2. [DOI] [PubMed] [Google Scholar]
- Ryu H, Lee J, Zaman K, Kubilis J, Ferrante RJ, Ross BD, Neve R, Ratan RR. Sp1 and Sp3 are oxidative stress-inducible, antideath transcription factors in cortical neurons. J Neurosci. 2003;23:3597–3606. doi: 10.1523/JNEUROSCI.23-09-03597.2003. [DOI] [PMC free article] [PubMed] [Google Scholar]
- Sagara Y, Ishige K, Tsai C, Maher P. Tyrphostins protect neuronal cells from oxidative stress. J Biol Chem. 2002;277:36204–36215. doi: 10.1074/jbc.M203895200. [DOI] [PubMed] [Google Scholar]
- Sasaki N, Toda T, Kaneko T, Baba N, Matsuo M. Protective effects of flavonoids on the cytotoxicity of linoleic acid hydroperoxide toward rat pheochromocytoma PC12 cells. Chem Biol Interact. 2003;145:101–116. doi: 10.1016/s0009-2797(02)00248-x. [DOI] [PubMed] [Google Scholar]
- Schaffer S, Muller WE, Eckert GP. Tocotrienols: constitutional effects in aging and disease. J Nutr. 2005;135:151–154. doi: 10.1093/jn/135.2.151. [DOI] [PubMed] [Google Scholar]
- Schubert D, Piasecki D. Oxidative glutamate toxicity can be a component of the excitotoxicity cascade. Journal of Neuroscience. 2001;21:7455–7462. doi: 10.1523/JNEUROSCI.21-19-07455.2001. [DOI] [PMC free article] [PubMed] [Google Scholar]
- Sen CK. Cellular thiols and redox-regulated signal transduction. Curr Top Cell Regul. 2000;36:1–30. doi: 10.1016/s0070-2137(01)80001-7. [DOI] [PubMed] [Google Scholar]
- Sen CK, Khanna S, Roy S. Tocotrienol: the natural vitamin E to defend the nervous system? Ann N Y Acad Sci. 2004;1031:127–142. doi: 10.1196/annals.1331.013. [DOI] [PubMed] [Google Scholar]
- Sen CK, Khanna S, Roy S. Tocotrienols: vitamin E beyond tocopherols. Life Sci. 2006 doi: 10.1016/j.lfs.2005.12.001. in press. [DOI] [PMC free article] [PubMed] [Google Scholar]
- Sen CK, Khanna S, Roy S, Packer L. Molecular basis of vitamin E action. Tocotrienol potently inhibits glutamate-induced pp60(c-Src) kinase activation and death of HT4 neuronal cells. J Biol Chem. 2000;275:13049–13055. doi: 10.1074/jbc.275.17.13049. [DOI] [PubMed] [Google Scholar]
- Sen CK, Khanna S, Babior BM, Hunt TK, Ellison EC, Roy S. Oxidant-induced vascular endothelial growth factor expression in human keratinocytes and cutaneous wound healing. J Biol Chem. 2002;277:33284–33290. doi: 10.1074/jbc.M203391200. [DOI] [PubMed] [Google Scholar]
- Sommer S, Hunzinger C, Schillo S, Klemm M, Biefang-Arndt K, Schwall G, Putter S, Hoelzer K, Schroer K, Stegmann W, Schrattenholz A. Molecular analysis of homocysteic acid-induced neuronal stress. J Proteome Res. 2004;3:572–581. doi: 10.1021/pr034115o. [DOI] [PubMed] [Google Scholar]
- Soriano P, Montgomery C, Geske R, Bradley A. Targeted disruption of the c-src proto-oncogene leads to osteopetrosis in mice. Cell. 1991;64:693–702. doi: 10.1016/0092-8674(91)90499-o. [DOI] [PubMed] [Google Scholar]
- Spiteller G. Peroxidation of linoleic acid and its relation to aging and age dependent diseases. Mech Ageing Dev. 2001;122:617–657. doi: 10.1016/s0047-6374(01)00220-2. [DOI] [PubMed] [Google Scholar]
- Steiner MR, Holtsberg FW, Keller JN, Mattson MP, Steiner SM. Lysophosphatidic acid induction of neuronal apoptosis and necrosis. Ann N Y Acad Sci. 2000;905:132–141. doi: 10.1111/j.1749-6632.2000.tb06545.x. [DOI] [PubMed] [Google Scholar]
- Suzuki YJ, Tsuchiya M, Wassall SR, Choo YM, Govil G, Kagan VE, Packer L. Structural and dynamic membrane properties of alpha-tocopherol and alpha-tocotrienol: implication to the molecular mechanism of their antioxidant potency. Biochemistry. 1993;32:10692–10699. doi: 10.1021/bi00091a020. [DOI] [PubMed] [Google Scholar]
- Tan S, Schubert D, Maher P. Oxytosis: A novel form of programmed cell death. Current Topics in Medicinal Chemistry. 2001;1:497–506. doi: 10.2174/1568026013394741. [DOI] [PubMed] [Google Scholar]
- Terrasa AM, Guajardo MH, de Armas Sanabria E, Catala A. Pulmonary surfactant protein A inhibits the lipid peroxidation stimulated by linoleic acid hydroperoxide of rat lung mitochondria and microsomes. Biochim Biophys Acta. 2005;1735:101–110. doi: 10.1016/j.bbalip.2005.05.007. [DOI] [PubMed] [Google Scholar]
- Theriault A, Chao JT, Wang Q, Gapor A, Adeli K. Tocotrienol: a review of its therapeutic potential. Clin Biochem. 1999;32:309–319. doi: 10.1016/s0009-9120(99)00027-2. [DOI] [PubMed] [Google Scholar]
- Tirosh O, Sen CK, Roy S, Packer L. Cellular and mitochondrial changes in glutamate-induced HT4 neuronal cell death. Neuroscience. 2000;97:531–541. doi: 10.1016/s0306-4522(00)00028-2. [DOI] [PubMed] [Google Scholar]
- Tirosh O, Sen CK, Roy S, Kobayashi MS, Packer L. Neuroprotective effects of alpha-lipoic acid and its positively charged amide analogue. Free Radic Biol Med. 1999;26:1418–1426. doi: 10.1016/s0891-5849(99)00014-3. [DOI] [PubMed] [Google Scholar]
- Traber MG, Packer L. Vitamin E: beyond antioxidant function. Am J Clin Nutr. 1995;62:1501S–1509S. doi: 10.1093/ajcn/62.6.1501S. [DOI] [PubMed] [Google Scholar]
- Traber MG, Sies H. Vitamin E in humans: demand and delivery. Annu Rev Nutr. 1996;16:321–347. doi: 10.1146/annurev.nu.16.070196.001541. [DOI] [PubMed] [Google Scholar]
- Turpeinen AM, Basu S, Mutanen M. A high linoleic acid diet increases oxidative stress in vivo and affects nitric oxide metabolism in humans. Lipids. 1999;34(Suppl):S291–292. doi: 10.1007/BF02562321. [DOI] [PubMed] [Google Scholar]
- Yamamoto S. Mammalian lipoxygenases: molecular structures and functions. Biochimica et Biophysica Acta. 1992;1128:117–131. doi: 10.1016/0005-2760(92)90297-9. [DOI] [PubMed] [Google Scholar]
- Zaleska MM, Wilson DF. Lipid hydroperoxides inhibit reacylation of phospholipids in neuronal membranes. J Neurochem. 1989;52:255–260. doi: 10.1111/j.1471-4159.1989.tb10925.x. [DOI] [PubMed] [Google Scholar]