

Abstract
Purpose
To compare reaction time (RT) to rod incremental and decremental stimuli expressed in physical contrast units or psychophysical threshold units.
Methods
Rod contrast detection thresholds and suprathreshold RTs were measured for Rapid-On and Rapid-Off ramp stimuli.
Results
Threshold sensitivity to Rapid-Off stimuli was higher than to Rapid-On stimuli. Suprathreshold RTs specified in Weber contrast for Rapid-Off stimuli were shorter than for Rapid-On stimuli. Reaction time data expressed in multiples of threshold reversed the outcomes: Reaction times for Rapid-On stimuli were shorter than those for Rapid-Off stimuli. The use of alternative contrast metrics also failed to equate RTs.
Conclusions
A case is made that the interpretation of RT data may be confounded when expressed in threshold units. Stimulus energy or contrast is the only metric common to the response characteristics of the cells underlying speeded responses. The use of threshold metrics for RT can confuse the interpretation of an underlying physiological process.
Keywords: Reaction time, metric, contrast, threshold unit, suprathreshold
1. Introduction
Scaling suprathreshold stimuli in multiples of an observer's detection threshold has sometimes been used in attempts to compare suprathreshold performance to stimuli manipulated along disparate stimulus dimensions (Díaz, Barco, Jiminéz & Hita, 2001; McKeefry, Parry & Murray, 2003; Mollon & Krauskopf, 1973; Switkes & Crognale, 1999; Webster & Mollon, 1994). The principal rationale for scaling stimuli in threshold units is that it provides an indication of the perceptual strength (Fechner, 1860/1912) or effectiveness of suprathreshold stimuli and might therefore equate the neural responses of the mechanisms (Luce & Edwards, 1958). Threshold units provide a scaling method related to the specification of sensation differences in just-noticeable difference (JND) units, obtained with a procedure wherein an observer discriminates between stimuli that evoke only slight differences in sensation (Woodworth, 1938; Wyszecki & Stiles, 1982). An alternative scaling metric to threshold units is contrast, where stimuli are characterized by the physical properties of the stimulus. Michelson and Weber contrasts are two commonly adopted choices. Michelson contrast is used for periodic distributions of light in space or time, and Weber contrast is used to characterize a pulse of light in space or time.
Variants of Michelson and Weber contrasts have suggested for the purpose of equating visual performance measured under disparate stimulus dimensions. Whittle (1986) demonstrated that cone increment and decrement thresholds could be equated using the W-metric (defined below). More recently, Plainis and Murray (2000) showed that for reaction times (RT) to a fixed spatial frequency, the reciprocal of the slope derived from the linear fit of the RT data versus 1/contrast curve revealed the effective contrast range of the different stimuli.
Here we ask whether the psychophysical threshold unit is an appropriate metric for comparing speeded responses to stimuli that vary on different stimulus dimensions. We investigated this issue using rod reaction times measured with Rapid-On and Rapid-Off ramp stimuli that share a common physical metric, but give rise to different threshold sensitivities. We conclude from these data and other considerations that the interpretation of the results for suprathreshold reaction time tasks is confounded when threshold units are used for scaling.
2. Methods
The data were collected as part of a larger study that considered rod and cone reaction times to Rapid-On and Rapid-Off stimuli as a function of Weber contrast and retinal illuminance (Cao, Zele & Pokorny, In Press). Here we use the results for rod stimuli at a single retinal illuminance to demonstrate that the metric can have an effect on suprathreshold task analysis. A detailed description of the reaction time method is given in Cao et al., (In Press); a brief overview of the experiment is given here.
Authors AJZ and DC, both experienced psychophysical observers, participated in the experiment. Independent control of rod and cone activity (Shapiro, Pokorny & Smith, 1996) was achieved using a 2-channel, 4-primary Maxwellian view photostimulator (Pokorny, Smithson & Quinlan, 2004). Equipment and individual observer calibrations are described in detail by Cao, Zele & Pokorny (2006). All stimuli were presented in a center-surround stimulus arrangement that included a 2° diameter center and a 13° annular surround, positioned at a 7.5° eccentricity in the nasal visual field. The chromaticities of the center and surround were the same, metameric to the equal-energy-spectrum [L/(L+M) = 0.667, S/(L+M) = 1.0]. For threshold and suprathreshold reaction time measurements, the rod signal waveform in the center field was either a Rapid-On or Rapid-Off one-second ramp. Detection threshold contrasts were determined according to a two-yes-one-no double random alternating staircase procedure. Suprathreshold reaction times were measured for a range of physical Weber contrasts (15 – 60%) limited by the observer detection threshold contrast at the low end and the photostimulator gamut at the high end. The retinal illuminance was 0.2 Td. All experiments were conducted in accordance with requirements of the Institutional Review Board at The University of Chicago.
3. Results
Contrast detection thresholds for rod Rapid-Off stimuli were lower than for rod Rapid-On stimuli. The contrast detection thresholds for the rod Rapid-Off and Rapid-On ramps for observer AJZ were 0.05 and 0.11 respectively. For observer DC, the values were 0.08 and 0.18. Consistent with the literature (Watson, 1986), the contrast threshold ratio of decremental to incremental stimuli for each observer was ~2.2. The upper panels of Figure 1 show the reaction times (ms) as a function of Weber contrast for the rod Rapid-On and Rapid-Off ramp stimuli (unfilled and filled symbols). Reaction times to rod Rapid-Off stimuli are shorter than those to rod Rapid-On stimuli.
Figure 1.
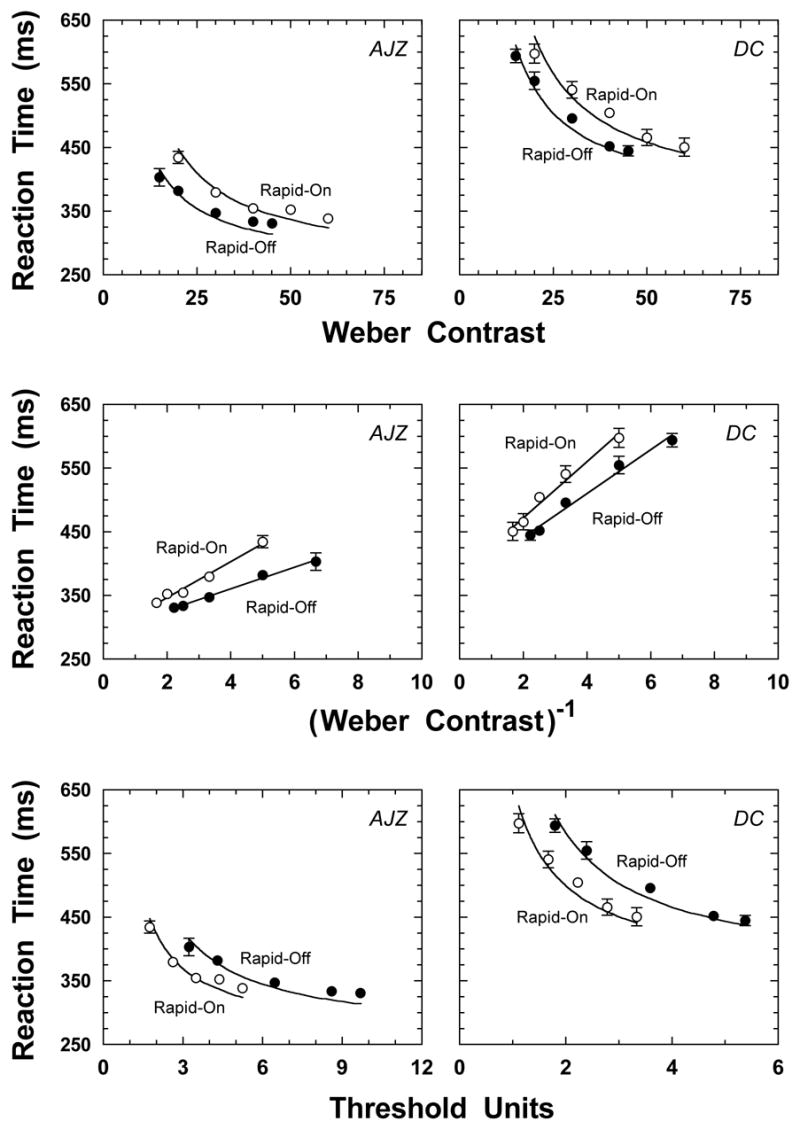
The data in the upper panels show reaction time (ms) as a function of Weber contrast for two observers (left and right panels). The filled circles show the reaction times to a Rapid-Off ramp, the unfilled symbols show reaction time to a Rapid-On ramp. The middle panels show RT versus 1/contrast, a transform suggested by Plainis and Murray (2000). The data in the lower panels show reaction time as a function of the multiple of observer threshold. Note that the abscissas have different ranges due to individual sensitivity differences. The solid lines in upper and lower panels represent fits of the reaction time model described by Cao, Zele and Pokorny (In Press).
We evaluated two published transforms to see if the incremental and decremental rod RT data might be made congruent. Whittle (1986) proposed a contrast metric, W = ΔL/Lmin, that uses Lmin rather than Lb in the denominator, where L is the luminance of the test stimulus, Lmin is the minimum luminance of the test stimulus and Lb is the luminance of the adapting background. The W-metric equated discrimination thresholds for cone detected increments and decrements, when the decrements were higher contrast, particularly ΔL> Lb/2. The rod RT data in Figure 1 show an approximately vertical displacement, therefore the W-metric would not equate the rod RTs to Rapid-ON and Rapid-OFF ramps. Plainis and Murray (2000) proposed that the slope of the RT versus 1/contrast function can equate the sensitivity of different detection mechanisms. We examined whether this metric equates the sensitivity differences between the rod Rapid-On and -Off stimuli shown in the upper panels of Figure 1. The middle panels of Figure 1 show the transformed data. The solid lines are best fits of a linear function. Linear fits, as Plainis and Murray described, provide excellent descriptions of RT data (r2 > 0.97 in all cases). However, the RT-derived sensitivity for the Rapid-Off ramp (0.059 for observer AJZ and 0.029 for DC) is higher than that for the Rapid-On ramp (0.035 for AJZ and 0.023 for DC). This ratio of supra-threshold sensitivities between Rapid-On and Rapid-Off therefore equals 1.66 for AJZ and 1.28 for DC, equivalent to a difference in ratios of 25% for AJZ and 42% for DC, when compared to the contrast detection threshold ratio (~2.2). Thus neither the Whittle nor the Plainis and Murray transforms can equate rod Rapid-On and Rapid-Off RTs.
The lower panels of Figure 1 show the same reaction time data plotted in threshold units derived from each individual's contrast detection thresholds. With this metric, the relative sensitivities to the two stimuli are reversed, reaction times to Rapid-On ramps are shorter than to Rapid-Off ramps.
4. Discussion
Intuitively, the results expressed in contrast units make sense: Reaction time to a contrast only modestly above threshold (Rapid-On) was longer than the reaction time to a contrast substantially above threshold (Rapid-Off). Specifying suprathreshold stimuli in threshold units reversed this relationship; Rapid-Off reaction times were longer compared to the Rapid-On reaction time measured at the same multiple of threshold contrast.
The idea that psychophysical threshold units may equate the neural responses of the mechanisms has been suggested previously (Barlow, 1958; McKeefry et al., 2003; Mollon & Krauskopf, 1973; Smithson & Mollon, 2004; Woodworth, 1938). As acknowledged by McKeefry et al., (2003), threshold units do not, however, account for the relative contributions of post-receptoral processing to threshold. This is evident in the rod incremental and decremental data in Figure 1. Both stimuli are detected by rod photoreceptors, however, the product of the receptoral and post-receptoral processes return different reaction times. This problem may be relevant to physiological experiments. For example, recordings from two cells may reveal different response times, which could result from a difference in either gain or conduction velocity. Stimulus energy or contrast is the only metric common to the response of both cells. Threshold units on the other hand, would reflect the multiplicity of factors that contribute to sensitivity and confound the reaction times with differences in sensitivity.
Is it meaningful to search for a metric that equates the sensitivity of two mechanisms with different threshold values? It is likely that threshold sensitivity and reaction time rely on different features of the internal response generated by a visual stimulus. Different tasks can use input information in different ways. For example, two measures commonly taken as measures of perceptual latency, reaction time and temporal order judgment yield a different dependence on field luminance. With reduction in luminance, reaction time shows a considerable change in latency whereas temporal order judgments exhibit far less dependency (Jaskowski, 1992; Roufs, 1974). This is not likely due to a change in the motor component of reaction time (Miller & Low, 2001). It is plausible to assume that reaction time is dependent on the initial portion of the internal stimulus representation whereas temporal order is dependent on the peak (Sternberg & Knoll, 1973) or temporal centroid (Williams & Lit, 1983) of the representation. Discrepancies between detection and reaction latency can also reflect differences in criterion for detection and reaction (Ejima & Ohtani, 1987). Aside from stimulus detection, stimulus strength affects the accumulation of sensory evidence until a criterion decision threshold is reached. At near-threshold stimulus contrasts, speeded responses are slower and accuracy is lower (e.g. Luce, 1986). Internal noise in the decision process, rather than residual sensory and motor latencies (e.g. Palmer, Huk & Shadlen, 2005; Taylor, Carpenter & Anderson, 2006), could further confound the comparison between suprathreshold and threshold measures of reaction time. What governs threshold sensitivity? One would expect the visual system would integrate over the internal stimulus representation, using all available information to decide if a stimulus was present or not.
To minimize any confound of the stimulus metric when comparing the reaction times of two different systems (e.g. rod ON and OFF, S-cone and L- or M-cone), asymptotic reaction time, sometimes called the irreducible minimum (Mansfield, 1973; Woodworth, 1938), can be measured. The irreducible minimum removes any confound of the metric as further increases in contrast (or multiples of threshold units) will not produce further improvements. The irreducible minimum is therefore independent of the stimulus metric. Contrast metrics are related by mathematical transformation of the physical properties of the stimulus and background. Although the definition of contrast can be an important consideration in evaluation of the effect of contrast polarity on visual performance (Alexander, Xie & Derlacki, 1993), we verified by calculation that adoption of Michelson rather than Weber contrast does not alter the relationships demonstrated in this study.
In the presence of differential threshold sensitivity between two mechanisms, expressing suprathreshold data in threshold units can produce outcomes artificially biased in favor of the mechanism with poorer sensitivity. Without prior knowledge that the system under study is governed by the same rules at threshold and suprathreshold levels, which requires an understanding of the contributions of the post-receptoral processing to detection and to the suprathreshold task, physical contrast offers a more appropriate metric for specifying suprathreshold stimuli. We propose that the only way to make meaningful comparisons of reaction times to stimuli varying along different dimensions is by comparison of asymptotic reaction times.
Acknowledgments
This study was supported by National Eye Institute grant EY00901 and by an unrestricted grant to the Department of Ophthalmology and Visual Science from Research to Prevent Blindness. Joel Pokorny is a Research to Prevent Blindness Senior Scientific Investigator. We benefited from discussions with Steven K. Shevell , Vivianne C. Smith and Hao Sun.
Footnotes
Publisher's Disclaimer: This is a PDF file of an unedited manuscript that has been accepted for publication. As a service to our customers we are providing this early version of the manuscript. The manuscript will undergo copyediting, typesetting, and review of the resulting proof before it is published in its final citable form. Please note that during the production process errors may be discovered which could affect the content, and all legal disclaimers that apply to the journal pertain.
References
- Alexander KR, Xie W, Derlacki DJ. The effect of contrast polarity on letter identification. Vision Research. 1993;33 (17):2491–2497. doi: 10.1016/0042-6989(93)90129-k. [DOI] [PubMed] [Google Scholar]
- Barlow HB. Temporal and spatial summation in human vision at different background intensities. Journal of Physiology (London) 1958;141:337–350. doi: 10.1113/jphysiol.1958.sp005978. [DOI] [PMC free article] [PubMed] [Google Scholar]
- Cao D, Zele AJ, Pokorny J. Dark-adapted rod suppression of cone flicker detection: Evaluation of receptoral and post-receptoral interactions. Visual Neuroscience. 2006;23(3–4):531–537. doi: 10.1017/S0952523806233376. [DOI] [PubMed] [Google Scholar]
- Cao D, Zele AJ, Pokorny J. Linking impulse response functions to reaction time: rod and cone reaction time data and a computational model. Vision Research. doi: 10.1016/j.visres.2006.11.027. In Press. [DOI] [PMC free article] [PubMed] [Google Scholar]
- Díaz JA, Barco LJd, Jiminéz JR, Hita E. Simple reaction time to chromatic changes along L&M-constant and S-constant cone axes. Color: Research and Application. 2001;26 (3):223–233. [Google Scholar]
- Ejima Y, Ohtani Y. Simple reaction time to sinusoidal grating and perceptual integration time: contributions of perceptual and response processes. Vision Research. 1987;27 (2):269–276. doi: 10.1016/0042-6989(87)90189-1. [DOI] [PubMed] [Google Scholar]
- Jaskowski P. Temporal-order judgment and reaction time for short and long stimuli. Psychological Research. 1992;54 (3):141–145. doi: 10.1007/BF00922093. [DOI] [PubMed] [Google Scholar]
- Luce RD. Response Times. New York: Oxford University Press; 1986. [Google Scholar]
- Luce RD, Edwards W. The derivation of subjective scales from just noticeable differences. Psychological Review. 1958;65 (4):222–237. doi: 10.1037/h0039821. [DOI] [PubMed] [Google Scholar]
- Mansfield RJ. Latency functions in human vision. Vision Research. 1973;13 (12):2219–2234. doi: 10.1016/0042-6989(73)90224-1. [DOI] [PubMed] [Google Scholar]
- McKeefry DJ, Parry NR, Murray IJ. Simple reaction times in color space: the influence of chromaticity, contrast, and cone opponency. Investigative Ophthalmology and Visual Science. 2003;44 (5):2267–2276. doi: 10.1167/iovs.02-0772. [DOI] [PubMed] [Google Scholar]
- Miller JO, Low K. Motor processes in simple, go/no-go, and choice reaction time tasks: a psychophysiological analysis. Journal of Experimental Psychology Human Perception and Performance. 2001;27 (2):266–289. [PubMed] [Google Scholar]
- Mollon JD, Krauskopf J. Reaction time as a measure of the temporal response properties of individual colour mechanisms. Vision Research. 1973;13 (1):27–40. doi: 10.1016/0042-6989(73)90162-4. [DOI] [PubMed] [Google Scholar]
- Palmer J, Huk AC, Shadlen MN. The effect of stimulus strength on the speed and accuracy of a perceptual decision. Journal of Vision. 2005;5 (5):376–404. doi: 10.1167/5.5.1. [DOI] [PubMed] [Google Scholar]
- Plainis S, Murray IJ. Neurophysiological interpretation of human visual reaction times: effect of contrast, spatial frequency and luminance. Neuropsychologia. 2000;38:1555–1564. doi: 10.1016/s0028-3932(00)00100-7. [DOI] [PubMed] [Google Scholar]
- Pokorny J, Smithson H, Quinlan J. Photostimulator allowing independent control of rods and the three cone types. Visual Neuroscience. 2004;21 (3):263–267. doi: 10.1017/s0952523804213207. [DOI] [PubMed] [Google Scholar]
- Roufs JA. Dynamic properties of vision. V. Perception lag and reaction time in relation to flicker and flash thresholds. Vision Research. 1974;14:853–869. doi: 10.1016/0042-6989(74)90149-7. [DOI] [PubMed] [Google Scholar]
- Shapiro AG, Pokorny J, Smith VC. Cone-Rod receptor spaces, with illustrations that use CRT phosphor and light-emitting-diode spectra. Journal of the Optical Society of America A. 1996;13:2319–2328. doi: 10.1364/josaa.13.002319. [DOI] [PubMed] [Google Scholar]
- Smithson HE, Mollon JD. Is the S-opponent chromatic sub-system sluggish? Vision Research. 2004;44 (25):2919–2929. doi: 10.1016/j.visres.2004.06.022. [DOI] [PubMed] [Google Scholar]
- Sternberg S, Knoll RL. The perception of temporal order: Fundamental issues and a general method. In: Kornblum S, editor. Attention and Performance IV. New York: Academic Press; 1973. pp. 629–685. [Google Scholar]
- Switkes E, Crognale MA. Comparison of color and luminance contrast: apples versus oranges? Vision Research. 1999;39:1823–1831. doi: 10.1016/s0042-6989(98)00219-3. [DOI] [PubMed] [Google Scholar]
- Taylor MJ, Carpenter RH, Anderson AJ. A noisy transform predicts saccadic and manual reaction times to changes in contrast. Journal of Physiology. 2006;573:741–751. doi: 10.1113/jphysiol.2006.105387. Pt 3. [DOI] [PMC free article] [PubMed] [Google Scholar]
- Watson AB. Temporal Sensitivity. In: Boff KR, Kaufman L, Thomas JP, editors. Handbook of Perception and Human Performance, I. New York: Wiley; 1986. [Google Scholar]
- Webster MA, Mollon JD. The influence of contrast adaptation on color appearance. Vision Research. 1994;34:1993–2020. doi: 10.1016/0042-6989(94)90028-0. [DOI] [PubMed] [Google Scholar]
- Whittle P. Increments and decrements: Luminance discrimination. Vision Research. 1986;26:1677–1691. doi: 10.1016/0042-6989(86)90055-6. [DOI] [PubMed] [Google Scholar]
- Williams JM, Lit A. Luminance-dependent visual latency for the Hess effect, the Pulfrich effect, and simple reaction time. Vision Research. 1983;23:171–179. doi: 10.1016/0042-6989(83)90140-2. [DOI] [PubMed] [Google Scholar]
- Woodworth RS. Experimental Psychology. New York: Holt and Company; 1938. pp. 1–889. [Google Scholar]
- Wyszecki G, Stiles WS. Color Science - Concepts and Methods, Quantitative Data and Formulae. 2. New York: John Wiley & Sons; 1982. pp. 1–950. [Google Scholar]