

Abstract
Melatonin modulates the expression of a number of genes related to inflammation and immunity. Declining levels of melatonin with age may thus relate to some of the changes in immune function that occur with age. mRNA expression levels in murine CNS were measured using oligonucleotide microarrays in order to determine whether a dietary melatonin supplement may modify age-related changes in the response to an inflammatory challenge. CB6F1 male mice were fed 40ppm melatonin for 9 weeks prior to sacrifice at 26.5 months of age, and compared with age-matched untreated controls and 4.5-month-old controls. A subset of both young and old animals was injected i.p. with lipopolysaccharide (LPS). After 3 hours, total RNA was extracted from whole brain (excluding brain stem and cerebellum), and individual samples were hybridized to Affymetrix Mouse 430-2.0 arrays. Data were analyzed in Dchip and GeneSpring. Melatonin treatment markedly altered the response in gene expression of older animals subjected to an LPS challenge. These changes in general, caused the response to more closely resemble that of young animals subjected to the same LPS challenge. Thus melatonin treatment effects a major shift in the response of the CNS to an inflammatory challenge, causing a transition to a more youthful mRNA expression profile.
Keywords: aging, brain, diet, melatonin, mouse, mRNA, LPS, immunity
Introduction
Melatonin (N-acetyl-5-methoxytryptamine) is a short-lived indole produced by the pineal gland during the dark phase of the photoperiod. This neurohormone possesses a number of important biological activities including its action as an endogenous synchronizer. Many studies have identified a regulatory role for melatonin in the immune system (Nelson et al., 1995). Melatonin may also attenuate some aspects of aging (Pierpaoli and Regelson, 1994). In aged mice, melatonin treatment can rejuvenate the involuted thymus and partially restore peripheral immune functions (Tian et al., 2003). A greater proportion of old mice than of young succumb to an i.p. injection of LPS (Saito et al., 2003). Melatonin also increases the survival rate of young mice injected with an otherwise lethal dose of LPS (Carrillo-Vico et al., 2005). The age-related decline in amplitude of circadian melatonin secretion is especially pronounced in aged demented subjects and the decline of its nocturnal peak is correlated with the severity of cognitive impairment (Magri et al., 2004).
The biological activity of melatonin is brought about in part by two high affinity G protein coupled receptors (GPCRs) Mtnr1a and Mtnr1b, by quinone 2 NAD(P)H dehydrogenase (NQO2), and by nuclear receptors RZR/ROR. Inflammatory cytokine expression is also modulated by melatonin; for example, Il-2 production by Jurkat cells from human leukemia, is enhanced by way of a nuclear receptor-mediated mechanism (Guerrero et al., 2000).
Melatonin also reduces IL-6 secretion in amyloid β peptide-treated brain slices, in a concentration dependent manner (Clapp-Lilly et al., 2001). Inflammatory processes in the CNS are increased with normal aging (Joseph et al., 2005), and elevated astroglial activation in aging in mouse brain is evidenced by increased transcription of GFAP (Goss et al., 1991). In addition rat microglia also increase basal gene expression of IL-1α, IL-1β and IL-6 cytokines with aging (Yu et al., 2002). We have previously reported the influence of low doses of melatonin in mouse brain on the effect of LPS upon genes relating to immune function (Sharman et al., 2002, Bondy et al., 2005). The current study examined the global changes of cortical gene expression after acute LPS treatment following extended administration of dietary melatonin. Conditional tree analysis demonstrated that melatonin had significant but minor effects on gene expression in the unchallenged old mice. However melatonin-treated old animals responded to an LPS challenge in a manner resembling the corresponding response in young rather than that of old mice receiving basal diet. Thus melatonin treatment effected a major shift in the response of the CNS to the inflammatory challenge of LPS in a direction which was closer to the corresponding response of younger animals.
Materials and Methods
Animal treatment
Male CB6F1 mice, a hybrid between C57BL/6JM and BALB/cJF from Harlan Labs (Indianapolis, IN), aged 4.5 months (young group) and 26.5 months (old group), were housed two to four per cage and were maintained on a 12 hour light/dark cycle in a temperature controlled (22±1 ºC) room. The CB6F1 hybrid was used in order to take advantage of both the genetic and phenotypic uniformity and the vigor (increased disease resistance, better survival under stress and greater natural longevity) typical of hybrids, while maintaining genetic similarity to the published C57BL/6 mouse genome sequence ref. Food and water were provided ad libitum. Young (YC, 2.4 months old) and old (OC, 24.3 months old) control animals were fed a pelleted minimal basal diet (AIN-93M, Dyets #100900, Dyets Inc., Bethlehem, PA) consisting of 10% sucrose and 14% casein (w/w) as well as a minimal salt and vitamin mix. The basal diet of a cohort of the 24-month old animals (OM) was supplemented with 40-ppm (w/w) melatonin (Sigma, St. Louis, MO) for 9.3 weeks. All experiments were approved by the Institutional Animal Care and Use Committee at the University of California, Irvine, and conformed to the National Institute of Health guide for the care and use of laboratory animals. Three hours prior to sacrifice, half of each group of mice was injected intraperitoneally with 100 μl of 300μg/ml of E. coli lipopolysaccharide (LPS, Sigma L4005), the other half with 100 μl of 0.9% saline.
RNA extraction and purification
Mice were killed by cervical dislocation and visually inspected for signs of disease or other pathology; brain tissues were excised quickly, immediately frozen on dry ice and stored at −70 ºC. Cerebellum and brain stem were removed; total RNA was extracted from the remaining tissue using the TRI Reagent kit (Molecular Research Center Inc., Cincinnati, OH), following the manufacturer's protocol. Aliquots of the total RNA were further purified on an RNeasy column (Qiagen Inc., Valencia, CA) to yield a 260 nm to 280 nm absorbance ratio of 1.9. RNA concentrations were determined by absorption at 260 nm.
cRNA preparation and micro-array hybridization
Total RNA from each of three animals per treatment group was individually prepared for analysis on a Mouse 430 2.0 GeneChip (Affymetrix, Santa Clara, CA). First strand cDNA was synthesized from 20μg of total RNA from each sample using Superscript Choice System (Invitrogen Life Technologies, Carlsbad, CA) and an HPLC purified primer encoding poly(dT) and T7 RNA polymerase promoter sequence (Integrated DNA Technologies, Coralville, IA). In vitro transcription reactions were carried out using Enzo High Yield RNA Transcript labeling kit (Affymetrix and Enzo Life Sciences, Farmingdale, NY). cRNA was extracted using phase lock gels (Eppendorf), ethanol precipitated, purified using RNAeasy spin columns (Qiagen, Valencia, CA) and fragmented. Biotin labeled cRNA was hybridized to high-density oligonucleotide micro-arrays, Mouse 430 2.0 GeneChips (Affymetrix) and each GeneChip was read on a Hewlett Packard GeneArray Scanner. The background, noise, housekeeper gene levels and 3′/5′ ratio values of all chips were within the quality control limits set by Affymetrix (Supplemental Table A).
Micro-array analysis
Image files were processed using robust multi-array average (RMA) (Irizarry et al., 2003) and expression data were imported into GeneSpring (Agilent Technologies). The data were converted from log2 to linear values; then a per-gene normalization was performed with a median cutoff value of 0.01 for normalization. The cross-gene error model was applied with replicates. To exclude poorly performing probe sets a signal intensity filter was then used to exclude the 5% of probe sets with the lowest expression levels in all conditions. A t-test filter was also used to exclude all probe sets with a differential expression t-test value of less than 0.2. An expression restriction was applied on control signal values with the lower cutoff value determined by the CGEM average value of base/proportional ratio for each experiment. Following these filters a collection of 26,951 probe sets remained and is referred to as the ‘working list’. This list was further filtered using a 1 way ANOVA with a p value cut off of 0.05 to include only those probe sets with a significant change in expression between any two conditions, ‘significantly changed list’ (16,661 probe sets). This list was further modified to include only those probe sets with both a statistically significant change and fold-change of greater than 1.5 following LPS treatment for the three animal groups, YC, OC and OM, the 'LPS major changes list'. This list is described as the LPS modulated list and includes 503 probe sets (Supplemental Table B). These lists were used to generate a variety of conditional trees in Genespring using a Standard Correlation. The LPS modulated list was also used to generate the gene tree.
Semi-quantitative RT-PCR
Semi-quantitative reverse-transcription polymerase chain reaction (RT-PCR) analysis was used to confirm array data by more precise quantitation of the expression levels of selected mRNA transcripts. Equal amounts of total RNA from each sample were amplified using the OneStep RT-PCR kit (Qiagen, Valencia, CA) and a Perkin Elmer GeneAmp 2400 PCR System (Perkin Elmer, Norwalk, CT). Separation and quantitation of the PCR products were performed by capillary electrophoresis with an Agilent 2100 Bioanalyzer. An aliquot of 0.3 μl mouse brain total RNA was subjected to reverse transcription at 50 ºC for 30 minutes; initial PCR activation at 95 ºC for 15 min was followed by a number of thermal cycles each consisting of a deactivation step at 94 ºC for 1 min, an annealing step at 52 ºC for 1 min, and an extension step at 72 ºC for 60 sec; thermal cycling was followed by a final extension at 72 ºC for 10 min. The number of thermal PCR cycles ranged from 25 to 35 and was adjusted as necessary to yield an amount of product appropriate for loading onto the capillary electrophoresis column. Expression levels for each sample were normalized to values of young untreated mice, calculated relative to expression of the Mthfd1 (methylenetetrahydrofolate dehydrogenase 1) gene used as a control.
Quantitative real-time RT-PCR
Quantitative (real-time) polymerase chain reaction (qRT-PCR) analysis was used to measure the expression levels of selected mRNA transcripts and for β-actin. Reactions were carried out on a LightCycler instrument (Roche Diagnostics, Indianapolis, IN) using the QuantiTect SYBR Green RT-PCR reagent kit (Qiagen, Valencia, CA) according to the manufacturers' directions. Product fluorescence was detected at the end of the elongation cycle at 72 °C. Melting curves all exhibited a single peak at a temperature characteristic of the primer pair used and none of the primer pairs produced amplicons in the absence of sample or reverse transcriptase. Expression levels for each sample were normalized to values of the corresponding untreated young control group, and were calculated as the average of two determinations, relative to β-actin expression. Using log2-transformed data where appropriate, differences between the six treatment groups were assessed by one-way Analysis of Variance; this was followed by Gabriel’s multiple comparisons procedure test as computed using the Clinstat program (Bland, 2000). In all cases, the acceptance level of significance was p<0.05 using a two-tailed distribution.
Results
Condition trees built using either the 'working list' of 26,951 probe sets or 'significantly changed list,' of 16,661 probe sets, displayed the same relationships between different treatment conditions (Fig. 1). Prior to LPS treatment, the OC and OM groups bore a closer similarity to each other than to the young control group, YC. However after LPS treatment the expression pattern of OM was altered so as to more closely resemble that of YC rather than that of OC. This trend was further enhanced when the condition tree was restricted to those probe sets that were significantly changed by LPS. Thus, although melatonin treatment of old animals unchallenged with LPS did not broadly alter basal gene expression levels, LPS treatment resulted in a response more closely resembling that of the young animal.
Figure 1. Gene expression relationships between groups of animals.
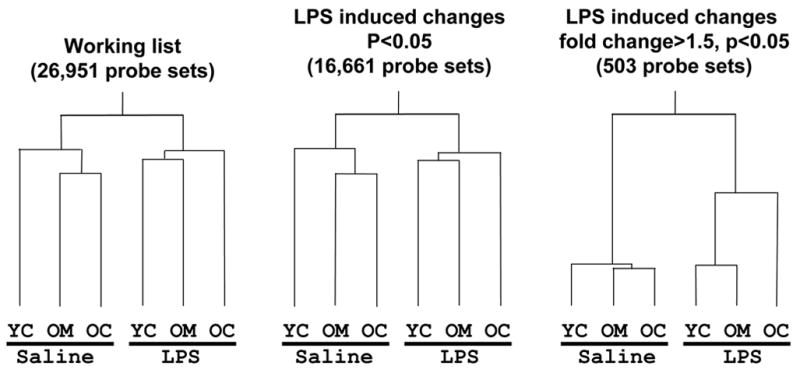
a condition tree built using a) the 'working list' of 26951 probe sets, b) 'significantly changed list,' of 16,661 probe sets, and c) 'LPS major changes list' of 503 probe sets, showing the degree of identity in relationships between different treatment groups. The Y-axis represents the estimated divergence in gene expression patterns, so that the longer each line is before bifurcation, the more remote the extent of relationship. YC = young control, OC = old control, OM = old melatonin.
The LPS-modulated list of those probe sets (n=503) which were significantly altered by <1.5 following LPS treatment, was grouped using the gene tree algorithm according to similar expression patterns. This is expressed in the form of a ‘heat map’ where increasing intensities of green reflect low expression levels and red reflects high expression levels (Fig. 2). Absence of color implies an ‘average level’ of expression. A number of gene clusters, whose response to LPS was altered by melatonin in the old animal, were identified from the gene tree constructed using the LPS-modulated list. One such cluster, A, comprised several cytokines, chemokines, and inflammation-related genes, all of which responded to LPS with major increases in expression (Fig. 3).
Figure 2. Comparative intensity of gene expression.
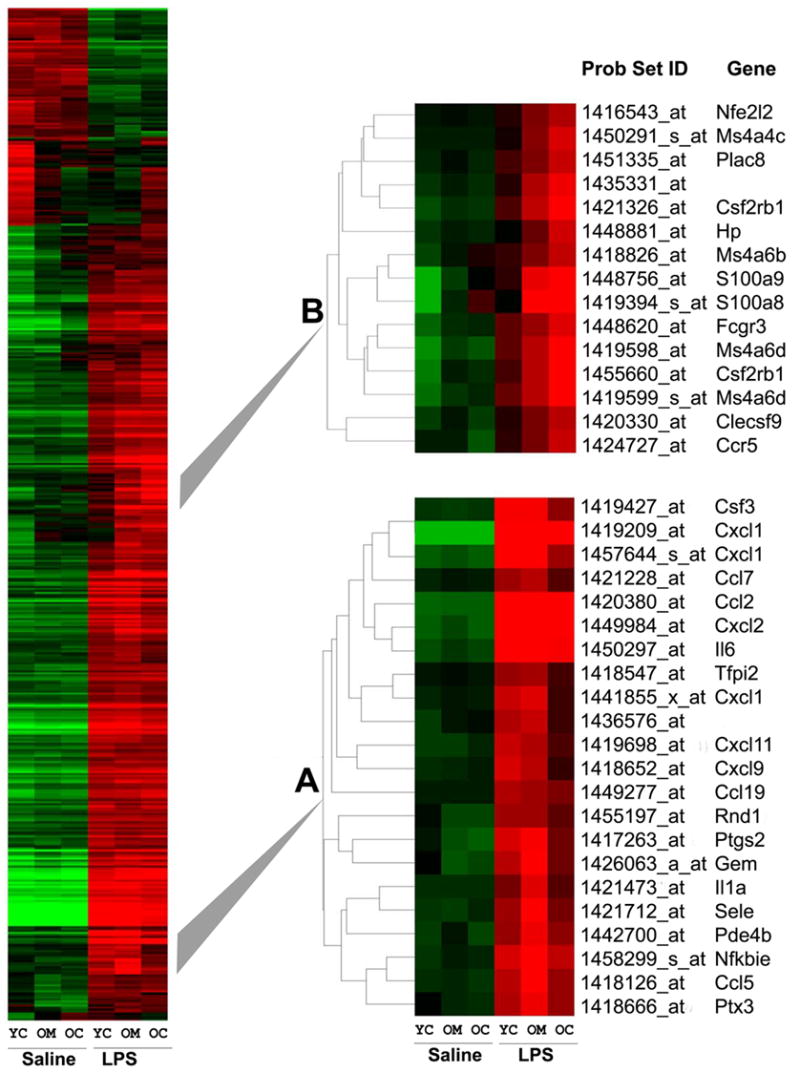
a heat map of the 'LPS major changes list' of 503 probe sets (>1.5 fold change, p<0.05) grouped using the gene tree algorithm according to similar expression patterns. Two gene clusters A and B whose response to LPS was altered by melatonin in the old animal are expanded and identified. Relative gene espression is represented graphically by coloring each cell corresponding to a particular gene (vertical axis) from an animal of a given age or treatment (horizontal axis). Genes with similar expression patterns are collected and displayed together in clusters. Cells with log ratios of 0.0 (genes unchanged) are colored black, increasingly positive log ratios (increased expression) with reds of increasing brightness, and increasingly negative log ratios (decreased expression) with greens of increasing brightness. YC = young control, OC = old control, OM = old melatonin.
Figure 3. Gene sets illustrating various response patterns to age and treatment.
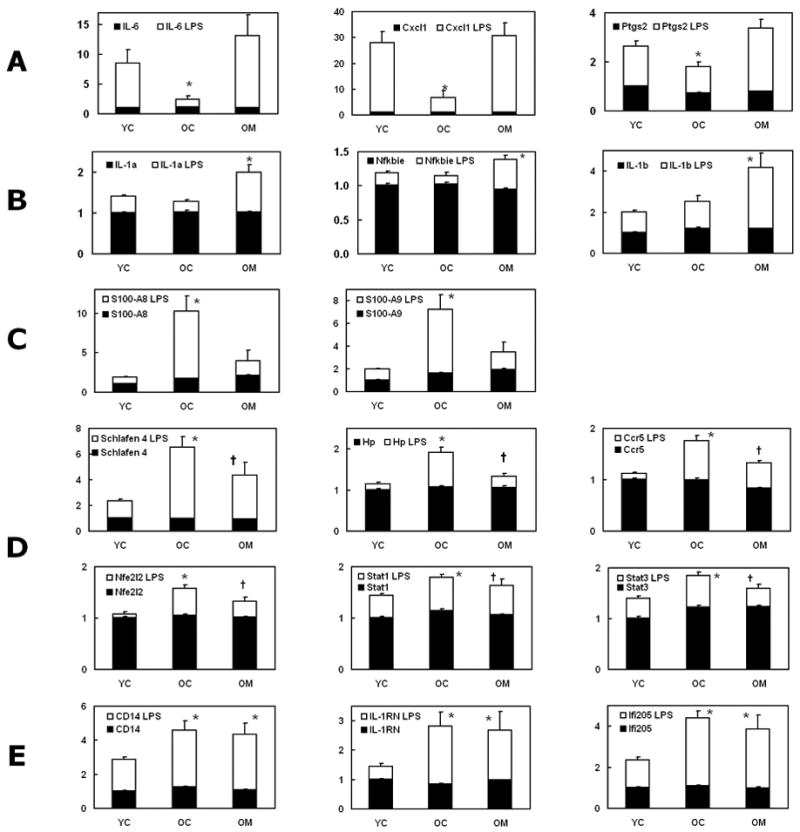
- LPS response depressed with age and restored to young level by melatonin.
- LPS response unchanged with age, and LPS response in aged increased by melatonin.
- LPS response increased with age and restored to young level by melatonin.
- LPS response increased with age and further increased with melatonin
- LPS response increased with age not altered by melatonin.
Statistically significant differences between mean levels for the six treatment groups (Gabriel’s multiple comparisons test, p<0.05): * = from YC LPS-treated; † = from both YC LPS- and OC LPS-treated.
Responsive genes were catalogued into four classes:
1. Genes whose expression increased greatly in young but not old mice after LPS treatment and where a robust response was re-established in old mice following melatonin treatment
This group, Fig. 3A (within cluster A) included interleukin (IL)-6, chemokine (CXC-motif) ligand 1 (Cxcl1), and prostaglandin-endoperoxide synthase 2 (Ptgs2 or COX2). Increases were lower in OC compared to YC, but were elevated in the OM group. The OM group response thus resembled that of the YC group more closely than did the challenged OC group.
2. Genes whose expression in old mice responded weakly to LPS and where this reaction was enhanced by melatonin
The effects of age and melatonin on the LPS-induced response of two cluster A genes, NFκB inhibitor ε (Nfkbie, IκBε) and IL-1α, and two additional cytokine genes IL-1β (Fig 3B) and TNFα (Fig 4) were similar: age had little effect, aside from modestly lowering the TNFα and IL-1β responses, but melatonin substantially amplified the LPS-induced expression of all four genes in old animals.
Figure 4. RT-PCR analysis of cortical levels of mRNA for TNF-α in 4.5 and 26.5 month-old mice.
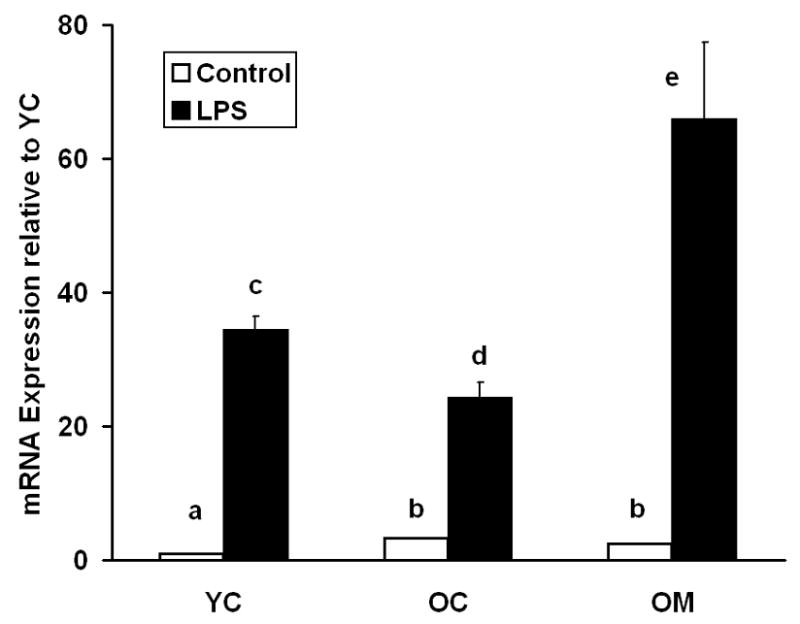
Relative expression levels of selected genes in the three groups of mice are compared, with or without LPS challenge. One subset of each group received 40 ppm dietary melatonin for the preceding 9.3 weeks. YC = young control, OC = old control, OM = old melatonin. Each value is mean ± SE of values from 3 individual mice. Differences between mean levels marked with different letters are statistically significant (p<0.05).
3. Genes whose response to LPS was low in young mice, higher in old mice, and where melatonin attenuated this elevated response of aged animals
The expression of a second cluster of genes (within cluster B, Fig. 2) was increased in OC more than YC following LPS treatment. In a number of cases, responses were decreased by melatonin treatment (Fig 3C–D). Dramatic increases in expression following LPS injection were found for the calgranulins S100A8 and S100A9, members of the calcium binding S-100 protein family (Fig. 3C). These were reduced by melatonin supplementation so that they were not statistically different from those in young. Schlafen 4, a gene involved in T cell development (Tannenbaum et al., 1993), also evinced increased LPS-induced expression in old mice (Fig. 3D). Less pronounced changes with the same pattern were measured for the chemokine receptor Ccr5, haptoglobin (Hp), and the transcription factor Nfe2l2 (nuclear respiratory factor 2, Nrf-2) (Fig 3D). Also in this group were the genes for Stat1 and Stat3, the Signal Transducer and Activator of Transcription factors through which IL-6 exerts its effects on acute phase response genes.
4. Genes whose LPS-induced expression was greater in old animals than in young but which were unaffected by melatonin
This group comprised CD14, IL-1 receptor antagonist (Il1rn), interferon-activated gene 205 (Ifi205/p205) and the IL-1 receptor antagonist (IL1-RN) (Fig 3E). CD14 is a cell-activating receptor for LPS (Wright, Ramos et al. 1990).
We measured the expression of a subset of genes with quantitative RT-PCR (Table 1). In all cases, the expression patterns generally agreed with the microarray data, and the changes in expression measured by qRT-PCR were often much larger than those measured on the microarrays. This difference in expression ratios has been noted previously (Jenson et al., 2003). The fact that the expression patterns derived from qRT-PCR were often much larger than those measured on the microarrays, suggests that results from microarrays are more prone to fail to detect differences (Type I errors), rather than to report false positives (Type II errors). In contrast to the microarray data (not shown), RT-PCR analysis of TNF-α showed a dramatic response to LPS (Fig. 4). Previously we observed a similar discrepancy with the TNF-α probe set on the Affymetrix MG-U74Av2 mouse genechip (unpublished data).
Table 1.
Confirmation of microarray mRNA expression patterns by quantitative real-time RT-PCR (qRT-PCR) or semi-quantitative RT-PCR. mRNA expression levels (mean ± standard error, n=3) relative to young control animals (YC) determined with microarray and by qRT-PCR or semi-quantitative RT-PCR (for Il1α and TNFα). Microarray values are given as ratios relative to normalization and RMA levels derived from Genespring. qRT-PCR values are ratios relative to β-actin (housekeeper gene) expression. For all genes measured, RT-PCR corroborated the rank order of magnitude of expression measured on the microarrays.
| YC | YC LPS | OC LPS | OM LPS | ||||||
|---|---|---|---|---|---|---|---|---|---|
| Gene Name | Gene ID | μ Array | qRT-PCR | μ Array | qRT-PCR | μ Array | qRT-PCR | μ Array | qRT-PCR |
| IL-1α | 16175 | 1.00±0.03 | 1.00±0.01 | 1.41±0.04 | 8.91±1.54 | 1.28±0.04 | 5.00±0.24 | 2.00±0.18 | 14.7±1.5 |
| IL-1β | 16176 | 1.00±0.05 | 1.00±0.17 | 2.01±0.08 | 4.58±0.48 | 2.54±0.28 | 5.47±1.36 | 4.19±0.71 | 13.7±5.3 |
| IL-6 | 16193 | 1.00±0.07 | 1.00±0.40 | 8.57±2.22 | 10.6±5.18 | 2.46±0.63 | 2.62±0.94 | 13.2±3.5 | 12.0±3.4 |
| IL1RN | 16181 | 1.00±0.04 | 1.00±0.43 | 1.44±0.10 | 3.91±0.32 | 2.83±0.47 | 7.62±1.68 | 2.69±0.64 | 7.24±2.89 |
| NFE2L2 | 18024 | 1.00±0.04 | 1.00±0.24 | 1.08±0.04 | 1.34±0.39 | 1.57±0.07 | 1.92±0.16 | 1.33±0.08 | 1.56±0.11 |
| S100A8 | 20201 | 1.00±0.06 | 1.00±0.30 | 1.92±0.08 | 13.5±1.0 | 10.2±2.0 | 142.±32. | 4.02±1.32 | 49.8±23.8 |
| S100A9 | 20202 | 1.00±0.06 | 1.00±0.36 | 1.98±0.06 | 13.2±2.6 | 7.24±1.29 | 100.±26. | 3.48±0.88 | 49.9±25.8 |
| STAT1 | 20846 | 1.00±0.04 | 1.00±0.05 | 1.44±0.04 | 1.92±0.15 | 1.80±0.06 | 2.09±0.08 | 1.64±0.12 | 1.95±0.30 |
| TNFα | 21926 | 1.00±0.01 | 34.3±2.1 | 24.3±2.3 | 65.9±11.5 | ||||
YC = young control group, OC = old control group, OM = old melatonin-supplemented group; YC LPS, OC LPS, OM LPS = YC, OC, or OM groups injected with lipopolysaccharide.
Discussion
Following administration of LPS, mice respond with a time-dependent pattern of gene expression changes that evolves over a period of up to 72 hours (Saban et al., 2001; Utsuyama and Hirokawa, 2002; Zheng et al., 2006). In this exploratory study, a relatively early time point of three hours after LPS injection was selected to allow enough time for the expression of early-responding genes such as IL-6 and TNFα to increase, but before more downstream genes could respond. These LPS-related changes at the 3-hour time point can be interpreted in either of two ways: (1) the time course of the response may remain unchanged, but the magnitude of the gene expression response may be amplified or reduced, or (2) the magnitude of the overall response may remain unchanged, but the time course of the response may be accelerated or slowed, resulting in a differing expression at the 3-hour time point. Many of the gene changes described here are consistent with the observations that injection of LPS is more lethal for old mice than for young (Saito et al., 2003), and that survival is increased by melatonin, at least in young animals (Carrillo-Vico et al, 2005). The issue as to how gene expression patterns may be consistent with, or in some cases contradictory to, the mortality data is now discussed.
S100A8 and S100A9
S100A8 (calgranulin A) is expressed by activated microglial cells (Engel et al., 2000) and as such is a marker of chronic inflammation. S100A9 (calgranulin B) is expressed in Alzhemer’s disease but not in normal human brains (Shepherd et al., 2005). In peripheral tissues, chemokine calprotectin (the heterodimer of S100A8 and S100A9) attracts neutrophils to sites of infection or inflammation and possesses antimicrobial activity as a consequence of its zinc-binding capacity (Stříž and Trebichavský, 2004). There is evidence that excessive S100A8/A9 protein levels are harmful. In humans, high synovial fluid levels S100A8/A9 are measured in rheumatoid arthritis; concentration increases with disease severity and resistance to treatment (Frosch et al., 2000). S100A8 mRNA expression is greatly induced by β-amyloid in microglia cultured from post-mortem human brain tissue (Walker et al., 2006), while S100A9 protein is found in reactive microglia in Alzheimer’s disease brains (Akiyama et al., 1994). Excessive levels of calprotectin can induce symptoms of zinc deficiency and reduced resistance to infection (Sampson et al., 2002), common conditions in the elderly. In our study, LPS modestly induced gene expression of both S100A8 and S100A9 in young animals. This induction was greatly augmented in old animals compared to young, whereas the augmentation was substantially reduced in the melatonin-fed animals. Given that moderate induction of S100A8/A9 is a normal response to infection and that high levels of S100A8/A9 are deleterious, these changes are consistent with the greater LPS-induced mortality in aged mice and the reduced mortality associated with melatonin supplementation reported by others.
Stat3
Stat3 is alternately-spliced to produce α and β forms; Stat3β plays a critical role in systemic inflammation, and LPS treatment leads to a transient increase in the Stat3β/Stat3α ratio (Yoo et al., 2002). Humoral factors have been proposed to be involved in Stat3 activation; candidate factors for mediating LPS-induced Stat3 activation in brain are IL-6, Leptin, and IL-10. IL-10 activates Stat3 and is induced in response to LPS (Barsig et al., 1995). Our finding that the elevated response of Stat1 and Stat3 to LPS in aged animals is reduced by melatonin again suggests that melatonin is able to partially reverse age-related changes in inflammatory responsivity.
Chemokines
Chemokines are small proteins with the ability to attract immune cells to sites of infection or injury. In the brain, chemokines can also modulate the action of opioides and cannabinoids and act widely in concert with neurotransmitters and neuropeptides to influence brain function (Adler et al., 2006). In aged animals, chemokines constituted the largest proportion of genes with a reduced reponse to LPS that was reversed in melatonin-fed mice (Fig 2, cluster A).
IL-1, IL1RN, and IL-6
Expression of IL-1β in the hippocampus has been shown to increase in response to LPS and this induction is further elevated with age (Terao et al., 2002). LPS induction of mRNA for IL-1α, IL-1β and IL-6 also increases in glial cultures with increasing age (Xie et al., 2003). These reports are in agreement with our results concerning age- and LPS-related increases in both IL-1α and IL-1β
The LPS-induced expression of IL-1 receptor antagonist (IL1RN) expression was greater in OM and OC groups than in YC (Fig. 3E). IL1RN is predominantly expressed in macrophages (Svensson et al., 2004) and blocks the functional receptor from activation by either IL-1α or IL-1β. IL1RN and IL-1β expression following LPS treatment in PBMC do not correlate, suggesting that they are differentially regulated in response to LPS (Fenton et al., 1988). This is supported by our finding that IL-1α and IL-1β but not IL1RN expression is modulated by melatonin treatment. Thus, melatonin treatment selectively affects induction pathways responding to LPS treatment in CNS. Increased LPS-induced expression of IL-1 by melatonin in old animals may be secondary to pre-existing increased IL1RN levels in old animals. The chemokine Cxcl1 mRNA response to LPS was substantially attenuated in old animals. This decline may be factor in accounting for the lessened inflammatory response to acute illness observed in elderly humans (Bruunsgaard, 2001). The gene expression of this inflammatory protein was increased to young-animal levels in the melatonin-fed mice, suggesting it as a possible treatment candidate for restoring the immune response to more appropriate levels in the elderly.
Selective nature of immune modulation by melatonin
Many other genes involved in the immune response that differ in expression between young and old animals, were unaffected by melatonin and this may provide clues as to mechanism of action. Endothelial mRNA expression of CD14 in the brain, undetectable prior to LPS, dramatically increases following LPS treatment reaching maximal expression at 5 hours (Singh and Jiang, 2004). LPS forms a complex with CD14 and LPS binding protein; it is then transferred to the endothelial cell LPS receptor complex consisting of toll-like-receptor 4 and MD2 (Dauphinee and Karsan, 2006). This binding of LPS to CD14 on endothelial cells in the brain and consequent initiation of transcription of proinflammatory cytokines was recently proposed as the mechanism underlying the central effects of peripherally administered LPS (Singh and Jiang, 2004). Since LPS-induced CD14 expression was elevated in old animals and unaltered by melatonin, the initial events following LPS induction may be unaltered by melatonin in old animals. It may be that melatonin acts by modulating cerebral signal transduction downstream to receptor activation by LPS.
Immune response in the aging brain
The current study reveals that many age-related changes in response to LPS in the brain are reversed by melatonin treatment. These changes include the major regulatory cytokines of the acute phase response: IL-6, TNF-α and IL-1. The robust response of IL-6 to LPS in young animals was essentially abolished in the old and was completely restored by melatonin. This is in agreement with our previous study using a different mouse strain and shorter feeding time (Sharman et al., 2002). Since IL-6 is one of the major controllers of the acute phase response, this implies that melatonin mediates a return to a more effective IL-6 triggering of immune defense genes, downstream to and regulated by this cytokine.
For the genes discussed here, we observed substantially less expression associated with age or melatonin in the absence of an LPS challenge. This suggests that the efficiency of the transcription process under resting conditions is maintained in the aged animal. In contrast, the reduced expression of some genes — and the excessive expression of others — in response to LPS in old animals suggest that the regulation of gene expression in response to a stressful challenge can be greatly modified by age on occasion. This could partially explain the lowered ability of aged animals to withstand such stresses. Moreover, the restoration of some immune-related genes by melatonin, to young-animal expression levels, may play a role in the improved immune function associated with melatonin supplementation.
Age-related increases of both the message and the proteins of inflammatory cytokines within the CNS, together with an enhanced response to LPS have been reported (Terao et al., 2002; Xie et al., 2003), and the current study reveals the breadth of these changes.
Astrocytes and microglia are the immune-regulatory and inflammatory cells of the central nervous system (Aloisi, 2001; Dong and Benveniste, 2001). They are activated in response to injury or infection resulting in the production of a host of pro-inflammatory mediators including cytokines such as tumor necrosis factor, TNF-α, and interleukins IL-1 and IL-6. Gene expression of these mediators in the brain is induced by LPS (Ban et al., 1992; Gatti and Bartfai, 1993; Sharman et al., 2002). Increases in activation of astrocytes (increased GFAP expression) and microglia occur in the aged brains in numerous species. Microglia may be the main cell type expressing increased IL-6 levels (Ye and Johnson, 1999) and IL-1α and IL-1β mRNA levels also increase in microglia with aging (Yu et al., 2002). Immune response genes are expressed at high levels in hippocampus, and IL-1, IL-6 and TNF-α effect the induction of hippocampal long term potentiation (Edagawa et al., 2005; Balschun et al., 2004; Butler et al., 2004). This suggests a distinctive role for these factors in the CNS.
As a result of the association of brain aging with excess inflammation, a range of anti-inflammatory agents has been proposed to be of utility especially in the treatment of Alzheimer's disease. We propose melatonin as a candidate agent, especially as it is both very non-toxic and inexpensive. Standard oral doses of melatonin (0.1–10 mg) result in 400–500 times increased serum concentrations after about 2 hours with no serious side effects (Dollins et al., 1994).
We have used microarray analysis of whole brain mRNA to identify robust changes in response to LPS. We compared the response of mice at two different ages to LPS at a single three-hour time point. Consequently, significant gene expression changes within discrete brain regions and at different time points following LPS administration may occur and these would not be detected in this analysis of the cerebral cortex. The goal of this report is to provide a framework for more detailed research on this subject. In order to elucidate the functional significance of the gene expression changes reported here, future experiments are planned that will utilize immunohistochemical analysis of corresponding proteins from more discrete brain regions at varying time points. These will permit precise anatomical localization of changes observed and more definition of their temporal evolution.
Supplementary Material
Acknowledgments
This work was supported in part by grants from the National Institutes of Health (ES 7992, AG 16794, AG 14882 and AG18884).
Footnotes
Publisher's Disclaimer: This is a PDF file of an unedited manuscript that has been accepted for publication. As a service to our customers we are providing this early version of the manuscript. The manuscript will undergo copyediting, typesetting, and review of the resulting proof before it is published in its final citable form. Please note that during the production process errors may be discovered which could affect the content, and all legal disclaimers that apply to the journal pertain.
Bibliography
- Adler MW, Geller EB, Chen X, Rogers TJ. Viewing chemokines as a third major system of communication in the brain. AAPS J. 2006;7:E865–E870. doi: 10.1208/aapsj070484. [DOI] [PMC free article] [PubMed] [Google Scholar]
- Akiyama H, Ikeda K, Katoh M, McGeer EG, McGeer PL. Expression of MRP14, 27E10, interferon-alpha and leukocyte common antigen by reactive microglia in postmortem human brain tissue. J Neuroimmunol. 1994;50:195–201. doi: 10.1016/0165-5728(94)90046-9. [DOI] [PubMed] [Google Scholar]
- Aloisi F. Immune function of microglia. Glia. 2001;36:165–179. doi: 10.1002/glia.1106. [DOI] [PubMed] [Google Scholar]
- Asefa B, Klarmann KD, Copeland NG, Gilbert DJ, Jenkins NA, Keller JR. The interferon-inducible p200 family of proteins: a perspective on their roles in cell cycle regulation and differentiation. Blood Cells Mol Dis. 2004;32:155–167. doi: 10.1016/j.bcmd.2003.10.002. [DOI] [PubMed] [Google Scholar]
- Atre D, Blumenthal EJ. Melatonin: immune modulation of spleen cells in young, middle-aged and senescent mice. Mech Ageing Dev. 1998;103:255–268. doi: 10.1016/s0047-6374(98)00046-3. [DOI] [PubMed] [Google Scholar]
- Balschun D, Wetzel W, Del Rey A, Pitossi F, Schneider H, Zuschratter W, Besedovsky HO. Interleukin-6: a cytokine to forget. FASEB J. 2004;18:1788–1790. doi: 10.1096/fj.04-1625fje. [DOI] [PubMed] [Google Scholar]
- Ban E, Haour F, Lenstra R. Brain interleukin 1 gene expression induced by peripheral lipopolysaccharide administration. Cytokine. 1992;4:48–54. doi: 10.1016/1043-4666(92)90036-q. [DOI] [PubMed] [Google Scholar]
- Barsig J, Kusters S, Vogt K, Volk HD, Tiegs G, Wendel A. Lipopolysaccharide-induced interleukin-10 in mice: role of endogenous tumor necrosis factor-alpha. Eur J Immunol. 1995;25:2888–2893. doi: 10.1002/eji.1830251027. [DOI] [PubMed] [Google Scholar]
- Bland M. An Introduction to Medical Statistics. Oxford University Press, Oxford, pp. 2000;3:177. [Google Scholar]
- Bondy SC, Campbell A, Sharman KG, Becaria A, Lahiri D, Chen DM, Sharman EH. Dietary melatonin modulates oxidative rather than inflammatory parameters in the brain. International Journal of Neuroprotection and Neuroregeneration. 2005;1:159–164. [Google Scholar]
- Butler MP, O'Connor JJ, Moynagh PN. Dissection of tumor-necrosis factor-alpha inhibition of long-term potentiation (LTP) reveals a p38 mitogen-activated protein kinase-dependent mechanism which maps to early-but not late-phase LTP. Neuroscience. 2004;124:319–326. doi: 10.1016/j.neuroscience.2003.11.040. [DOI] [PubMed] [Google Scholar]
- Caroleo MC, Doria G, Nistico G. Melatonin restores immunodepression in aged and cyclophosphamide-treated mice. Ann N Y Acad Sci. 1994;719:343–352. doi: 10.1111/j.1749-6632.1994.tb56841.x. [DOI] [PubMed] [Google Scholar]
- Carrillo-Vico A, Lardone PJ, Naji L, Fernandez-Santos JM, Martin-Lacave I, Guerrero JM, Calvo JR. Beneficial pleiotropic actions of melatonin in an experimental model of septic shock in mice: regulation of pro-/anti-inflammatory cytokine network, protection against oxidative damage and anti-apoptotic effects. J Pineal Res. 2005;39:400–408. doi: 10.1111/j.1600-079X.2005.00265.x. [DOI] [PubMed] [Google Scholar]
- Clapp-Lilly KL, Smith MA, Perry G, Duffy LK. Melatonin reduces interleukin secretion in amyloid-beta stressed mouse brain slices. Chem Biol Interact. 2001;134:101–107. doi: 10.1016/s0009-2797(00)00319-7. [DOI] [PubMed] [Google Scholar]
- Dauphinee SM, Karsan A. Lipopolysaccharide signaling in endothelial cells. Lab Invest. 2006;86:9–22. doi: 10.1038/labinvest.3700366. [DOI] [PubMed] [Google Scholar]
- del Rio B, Garcia Pedrero JM, Martinez-Campa C, Zuazua P, Lazo PS, Ramos S. Melatonin, an endogenous-specific inhibitor of estrogen receptor alpha via calmodulin. J Biol Chem. 2004;279:38294–38302. doi: 10.1074/jbc.M403140200. [DOI] [PubMed] [Google Scholar]
- Dermott JM, Gooya JM, Asefa B, Weiler SR, Smith M, Keller JR. Inhibition of growth by p205: a nuclear protein and putative tumor suppressor expressed during myeloid cell differentiation. Stem Cells. 2004;22:832–848. doi: 10.1634/stemcells.22-5-832. [DOI] [PubMed] [Google Scholar]
- Dollins AB, Zhdanova IV, Wurtman RJ, Lynch HJ, Deng MH. Effect of inducing nocturnal serum melatonin concentrations in daytime on sleep, mood, body temperature, and performance. Proc Natl Acad Sci U S A. 1994;91:1824–1828. doi: 10.1073/pnas.91.5.1824. [DOI] [PMC free article] [PubMed] [Google Scholar]
- Dong Y, Benveniste EN. Immune function of astrocytes. Glia. 2001;36:180–190. doi: 10.1002/glia.1107. [DOI] [PubMed] [Google Scholar]
- Edagawa Y, Sato F, Saito H, Takeda T, Shimizu N, Narui T, Shibata S, Ito Y. Dual effects of the lichen glucan PB-2, extracted from Flavoparmelia baltimorensis, on the induction of long-term potentiation in the dentate gyrus of the anesthetized rat: possible mediation via adrenaline beta- and interleukin-1 receptors. Brain Res. 2005;1032:183–192. doi: 10.1016/j.brainres.2004.11.012. [DOI] [PubMed] [Google Scholar]
- Engel S, Schluesener H, Mittelbronn M, Seid K, Adjodah D, Wehner HD, Meyermann R. Dynamics of microglial activation after human traumatic brain injury are revealed by delayed expression of macrophage-related proteins MRP8 and MRP14. Acta Neuropathol (Berl) 2000;100:313–322. doi: 10.1007/s004019900172. [DOI] [PubMed] [Google Scholar]
- Fenton MJ, Vermeulen MW, Clark BD, Webb AC, Auron PE. Human pro-IL-1 beta gene expression in monocytic cells is regulated by two distinct pathways. J Immunol. 1988;140:2267–2273. [PubMed] [Google Scholar]
- Garcia-Maurino S, Gonzalez-Haba MG, Calvo JR, Rafii-El-Idrissi M, Sanchez-Margalet V, Goberna R, Guerrero JM. Melatonin enhances IL-2, IL-6, and IFN-gamma production by human circulating CD4+ cells: a possible nuclear receptor-mediated mechanism involving T helper type 1 lymphocytes and monocytes. J Immunol. 1997;159:574–581. [PubMed] [Google Scholar]
- Gatti S, Bartfai T. Induction of tumor necrosis factor-alpha mRNA in the brain after peripheral endotoxin treatment: comparison with interleukin-1 family and interleukin-6. Brain Res. 1993;624:291–294. doi: 10.1016/0006-8993(93)90090-a. [DOI] [PubMed] [Google Scholar]
- Gomez I, Marx F, Gould EA, Grubeck-Loebenstein B. T cells from elderly persons respond to neoantigenic stimulation with an unimpaired IL-2 production and an enhanced differentiation into effector cells. Exp Gerontol. 2004;39:597–605. doi: 10.1016/j.exger.2003.11.018. [DOI] [PubMed] [Google Scholar]
- Goss JR, Finch CE, Morgan DG. Age-related changes in glial fibrillary acidic protein mRNA in the mouse brain. Neurobiol Aging. 1991;12:165–170. doi: 10.1016/0197-4580(91)90056-p. [DOI] [PubMed] [Google Scholar]
- Guerrero JM, Pozo D, Garcia-Maurino S, Osuna C, Molinero P, Calvo JR. Involvement of nuclear receptors in the enhanced IL-2 production by melatonin in Jurkat cells. Ann N Y Acad Sci. 2000;917:397–403. doi: 10.1111/j.1749-6632.2000.tb05404.x. [DOI] [PubMed] [Google Scholar]
- Hurwitz AA, Lyman WD, Berman JW. Tumor necrosis factor alpha and transforming growth factor beta upregulate astrocyte expression of monocyte chemoattractant protein-1. J Neuroimmunol. 1995;57:193–198. doi: 10.1016/0165-5728(95)00011-p. [DOI] [PubMed] [Google Scholar]
- Irizarry RA, Hobbs B, Collin F, Beazer-Barclay YD, Antonellis KJ, Scherf U, Speed TP. Exploration, normalization, and summaries of high density oligonucleotide array probe level data. Biostatistics. 2003;4:249–264. doi: 10.1093/biostatistics/4.2.249. [DOI] [PubMed] [Google Scholar]
- Jenson SD, Robetorye RS, Bohling SD, Schumacher JA, Morgan JW, Lim MS, Elenitoba-Johnson KS. Validation of cDNA microarray gene expression data obtained from linearly amplified RNA. Mol Pathol. 2003;56:307–312. doi: 10.1136/mp.56.6.307. [DOI] [PMC free article] [PubMed] [Google Scholar]
- Joseph JA, Shukitt-Hale B, Casadesus G, Fisher D. Oxidative stress and inflammation in brain aging: nutritional considerations. Neurochem Res. 2005;30:927–935. doi: 10.1007/s11064-005-6967-4. [DOI] [PubMed] [Google Scholar]
- Laye S, Parnet P, Goujon E, Dantzer R. Peripheral administration of lipopolysaccharide induces the expression of cytokine transcripts in the brain and pituitary of mice. Brain Res Mol Brain Res. 1994;27:157–162. doi: 10.1016/0169-328x(94)90197-x. [DOI] [PubMed] [Google Scholar]
- Magri F, Sarra S, Cinchetti W, Guazzoni V, Fioravanti M, Cravello L, Ferrari E. Qualitative and quantitative changes of melatonin levels in physiological and pathological aging and in centenarians. J Pineal Res. 2004;36:256–261. doi: 10.1111/j.1600-079X.2004.00125.x. [DOI] [PubMed] [Google Scholar]
- Nelson RJ, Demas GE, Klein SL, Kriegsfeld LJ. The influence of season, photoperiod, and pineal melatonin on immune function. J Pineal Res. 1995;19:149–165. doi: 10.1111/j.1600-079X.1995.tb00184.x. [DOI] [PMC free article] [PubMed] [Google Scholar]
- Oguro T, Takahashi Y, Ashino T, Takaki A, Shioda S, Horai R, Asano M, Sekikawa K, Iwakura Y, Yoshida T. Involvement of tumor necrosis factor alpha, rather than interleukin-1a/b or nitric oxides in the heme oxygenase-1 gene expression by lipopolysaccharide in the mouse liver. FEBS Lett. 2002;516:63–66. doi: 10.1016/s0014-5793(02)02502-4. [DOI] [PubMed] [Google Scholar]
- Pei Z, Cheung RT. Pretreatment with melatonin exerts anti-inflammatory effects against ischemia/reperfusion injury in a rat middle cerebral artery occlusion stroke model. J Pineal Res. 2004;37:85–91. doi: 10.1111/j.1600-079X.2004.00138.x. [DOI] [PubMed] [Google Scholar]
- Pierpaoli W, Regelson W. Pineal control of aging: effect of melatonin and pineal grafting on aging mice. Proc Natl Acad Sci U S A. 1994;91:787–791. doi: 10.1073/pnas.91.2.787. [DOI] [PMC free article] [PubMed] [Google Scholar]
- Provinciali M, Di Stefano G, Bulian D, Stronati S, Fabris N. Long-term melatonin supplementation does not recover the impairment of natural killer cell activity and lymphocyte proliferation in aging mice. Life Sci. 1997;61:857–864. doi: 10.1016/s0024-3205(97)00587-0. [DOI] [PubMed] [Google Scholar]
- Ruminy P, Gangneux C, Claeyssens S, Scotte M, Daveau M, Salier JP. Gene transcription in hepatocytes during the acute phase of a systemic inflammation: from transcription factors to target genes. Inflamm Res. 2001;50:383–390. doi: 10.1007/PL00000260. [DOI] [PubMed] [Google Scholar]
- Saban MR, Hellmich H, Nguyen NB, Winston J, Hammond TG, Saban R. Time course of LPS-induced gene expression in a mouse model of genitourinary inflammation. Physiol Genomics. 2001;5:147–160. doi: 10.1152/physiolgenomics.2001.5.3.147. [DOI] [PubMed] [Google Scholar]
- Saito H, Sherwood ER, Varma TK, Evers BM. Effects of aging on mortality, hypothermia, and cytokine induction in mice with endotoxemia or sepsis. Mech Ageing Dev. 2003;124:1047–1058. doi: 10.1016/j.mad.2003.08.002. [DOI] [PubMed] [Google Scholar]
- Sampson B, Fagerhol MK, Sunderkotter C, Golden BE, Richmond P, Klein N, Kovar IZ, Beattie JH, Wolska-Kusnierz B, Saito Y, Roth J. Hyperzincaemia and hypercalprotectinaemia: a new disorder of zinc metabolism. Lancet. 2002;360:1742–1745. doi: 10.1016/S0140-6736(02)11683-7. [DOI] [PubMed] [Google Scholar]
- Sharman EH, Sharman KG, Lahiri DK, Ge YW, Bondy SC. Age-related changes in murine CNS mRNA gene expression are modulated by dietary melatonin. J Pineal Research. 2004;36:165–170. doi: 10.1046/j.1600-079x.2003.00112.x. [DOI] [PubMed] [Google Scholar]
- Sharman KG, Sharman EH, Yang E, Bondy SC. Dietary melatonin selectively reverses age-related changes in cortical cytokine mRNA levels, and their responses to an inflammatory stimulus. Neurobiology of Aging. 2002;23:633–638. doi: 10.1016/s0197-4580(01)00329-3. [DOI] [PubMed] [Google Scholar]
- Shepherd CE, Goyette J, Utter V, Rahimi F, Yang Z, Geczy CL, Halliday GM. Inflammatory S100A9 and S100A12 proteins in Alzheimer's disease. Neurobiol Aging. 2005 doi: 10.1016/j.neurobiolaging.2005.09.033. Epub ahead of print. [DOI] [PubMed] [Google Scholar]
- Singh AK, Jiang Y. How does peripheral lipopolysaccharide induce gene expression in the brain of rats? Toxicology. 2004;201:197–207. doi: 10.1016/j.tox.2004.04.015. [DOI] [PubMed] [Google Scholar]
- Stříž I, Trebichavský I. Calprotectin – a pleiotropic molecule in acute and chronic inflammation. Physiol Res. 2004;53:245–253. [PubMed] [Google Scholar]
- Svensson PA, Hagg DA, Jernas M, Englund MC, Hulten LM, Ohlsson BG, Hulthe J, Wiklund O, Carlsson B, Fagerberg B, Carlsson LM. Identification of genes predominantly expressed in human macrophages. Atherosclerosis. 2004;177:287–290. doi: 10.1016/j.atherosclerosis.2004.07.031. [DOI] [PubMed] [Google Scholar]
- Sze SF, Liu WK, Ng TB. Stimulation of murine splenocytes by melatonin and methoxytryptamine. J Neural Transm Gen Sect. 1993;94:115–126. doi: 10.1007/BF01245005. [DOI] [PubMed] [Google Scholar]
- Tannenbaum CS, Major J, Ohmori Y, Hamilton TA. A lipopolysaccharide-inducible macrophage gene (D3) is a new member of an interferon-inducible gene cluster and is selectively expressed in mononuclear phagocytes. J Leukoc Biol. 1993;53:563–568. doi: 10.1002/jlb.53.5.563. [DOI] [PubMed] [Google Scholar]
- Terao A, Apte-Deshpande A, Dousman L, Morairty S, Eynon BP, Kilduff TS, Freund YR. Immune response gene expression increases in the aging murine hippocampus. J Neuroimmunol. 2002;132:99–112. doi: 10.1016/s0165-5728(02)00317-x. [DOI] [PubMed] [Google Scholar]
- Tian YM, Zhang GY, Dai YR. Melatonin rejuvenates degenerated thymus and redresses peripheral immune functions in aged mice. Immunol Lett. 2003;88:101–104. doi: 10.1016/s0165-2478(03)00068-3. [DOI] [PubMed] [Google Scholar]
- Utsuyama M, Hirokawa K. Differential expression of various cytokine receptors in the brain after stimulation with LPS in young and old mice. Exp Gerontol. 2002;37:411–420. doi: 10.1016/s0531-5565(01)00208-x. [DOI] [PubMed] [Google Scholar]
- Walker DG, Link J, Lue LF, Dalsing-Hernandez JE, Boyes BE. Gene expression changes by amyloid {beta} peptide-stimulated human postmortem brain microglia identify activation of multiple inflammatory processes. J Leukoc Biol. 2006;79:596–610. doi: 10.1189/jlb.0705377. [DOI] [PubMed] [Google Scholar]
- Wright SD, Ramos RA, Tobias PS, Ulevitch RJ, Mathison JC. CD14, a receptor for complexes of lipopolysaccharide (LPS) and LPS binding protein. Science. 1990;249:1431–1433. doi: 10.1126/science.1698311. [DOI] [PubMed] [Google Scholar]
- Xie Z, Morgan TE, Rozovsky I, Finch CE. Aging and glial responses to lipopolysaccharide in vitro: greater induction of IL-1 and IL-6, but smaller induction of neurotoxicity. Exp Neurol. 2003;182:135–141. doi: 10.1016/s0014-4886(03)00057-8. [DOI] [PubMed] [Google Scholar]
- Ye SM, Johnson RW. Increased interleukin-6 expression by microglia from brain of aged mice. J Neuroimmunol. 1999;93:139–148. doi: 10.1016/s0165-5728(98)00217-3. [DOI] [PubMed] [Google Scholar]
- Yoo JY, Huso DL, Nathans D, Desiderio S. Specific ablation of Stat3beta distorts the pattern of Stat3-responsive gene expression and impairs recovery from endotoxic shock. Cell. 2002;108:331–344. doi: 10.1016/s0092-8674(02)00636-0. [DOI] [PubMed] [Google Scholar]
- Yu WH, Go L, Guinn BA, Fraser PE, Westaway D, McLaurin J. Phenotypic and functional changes in glial cells as a function of age. Neurobiol Aging. 2002;23:105–115. doi: 10.1016/s0197-4580(01)00258-5. [DOI] [PubMed] [Google Scholar]
- Zheng J, Watson AD, Kerr DE. Genome-wide expression analysis of lipopolysaccharide-induced mastitis in a mouse model. Infect Immun. 2006;74:1907–1915. doi: 10.1128/IAI.74.3.1907-1915.2006. [DOI] [PMC free article] [PubMed] [Google Scholar]
Associated Data
This section collects any data citations, data availability statements, or supplementary materials included in this article.