

Abstract
Binding degeneracy is thought to constitute a fundamental property of the T-cell antigen receptor (TCR), yet its structural basis is poorly understood. We determined the crystal structure of a complex involving the BM3.3 TCR and a peptide (pBM8) bound to the H-2Kbm8 major histocompatibility complex (MHC) molecule, and compared it with the structures of the BM3.3 TCR bound to H-2Kb molecules loaded with two peptides that had a minimal level of primary sequence identity with pBM8. Our findings provide a refined structural view of the basis of BM3.3 TCR cross-reactivity and a structural explanation for the long-standing paradox that a TCR antigen-binding site can be both specific and degenerate. We also measured the thermodynamic features and biological penalties that incurred during cross-recognition. Our data illustrate the difficulty for a given TCR in adapting to distinct peptide-MHC surfaces while still maintaining affinities that result in functional in vivo responses. Therefore, when induction of protective effector T cells is used as the ultimate criteria for adaptive immunity, TCRs are probably much less degenerate than initially assumed.
Keywords: antigen recognition, binding degeneracy, T cell, TCR
Introduction
The recognition by T-cell antigen receptors (TCR) of antigenic peptides (p) bound to major histocompatibility complex (MHC)-encoded molecules is the basis of adaptive immune responses. During intrathymic differentiation, the genes encoding the variable (V) domain of the TCRα- and β-chains are assembled by site-specific DNA recombination reactions that result in the random recombination of V, diversity (D), and joining (J) gene segments. It has been argued that each clonally distributed TCR needs to cross-react with structurally distinct pMHC ligands (Mason, 1998). This property, called TCR degeneracy, is thought to permit the recognition by the whole TCR repertoire of a universe of potential antigenic peptides estimated to be much larger than the number of T-cell clones contained in an individual at a given moment. To differentiate in the thymus and, once mature, to achieve maximal sensitivity upon recognition of peptides of foreign origin, T cells also need to recognize, with low affinity, MHC molecules bearing peptides derived from self-proteins (Krogsgaard et al, 2005). Therefore, binding degeneracy constitutes an important TCR property.
The BM3.3 TCR recognizes its physiological ligand, a naturally processed octapeptide (pBM1) bound to the H-2Kb MHC class I molecule, with a KD of 2.2 μM (Reiser et al, 2000). This value corresponds to the higher end of the range reported for TCR–pMHC interactions (Krogsgaard et al, 2005), suggesting that BM3.3 had found an optimal fit on the composite surface made of the pBM1 agonist peptide and of the top of the H-2Kb α-helices. In addition, chance observation showed that BM3.3 cross-recognizes, with a lower affinity (KD=114 μM), a peptide derived from the vesicular stomatitis virus (VSV8) and bound to H-2Kb (Reiser et al, 2003). Comparison of the crystal structure of the BM3.3-pBM1-H-2Kb and BM3.3-VSV8-H-2Kb complexes provided a first hint on the structural basis of TCR degeneracy (Reiser et al, 2003). Peptide position 6 (P6) of pBM1 was the only position contacted by BM3.3 that showed a homologous replacement in the cross-recognized VSV8 peptide. All the other positions contacted by BM3.3 in VSV8 corresponded to non-conservative replacements and affected TCR binding in a positive (replacement at P4) or a negative (replacement at P7) way. The structurally different replacement observed at P4 of VSV8 was exploited through flexibility of the complementarity-determining region (CDR) 3 loop found in the Vα domain, which enabled residues at the apex of the CDR3α loop to be used fully and to compensate in part for the loosened interactions between the CDR3β loop and the residue found at P7 of VSV8.
The BM3.3 TCR is capable of recognizing a third pMHC complex expressed on the surface of cells expressing H-2Kbm8 (Auphan-Anezin et al, 2006). H-2Kbm8 is a spontaneous variant of H-2Kb that arose by a gene conversion event (van Bleek and Nathenson, 1991). Of the four amino acids that are polymorphic between H-2Kb and H-2Kbm8, two point away from the peptide-binding groove and are thus irrelevant to antigen presentation, whereas the other two point into the groove and serve to create the B pocket, which sequesters the anchor residue found at P2 of the bound peptide. Consistent with the view that these two polymorphic MHC residues affect peptide-binding preference (Webb et al, 2004), identification of the endogenous peptide (pBM8: SQYYYNSL) recognized by the BM3.3 TCR in the context of H-2Kbm8 showed that its anchor residues differed from the ones found in pBM1 and VSV8 sequences (Auphan-Anezin et al, 2006). Moreover, further comparison of the pBM8 sequence with that of pBM1 (INFDFNTI) and VSV8 (RGYVYQGL) revealed a single homologous TCR-exposed residue at P6. In contrast, the two other TCR-exposed residues found in the three peptides recognized by BM3.3 showed non-conservative substitutions.
The recognition by BM3.3 of three peptides that are structurally different constitutes a more stringent challenge than the recognition of peptide variants containing single amino-acid substitution, and allows analysis of extreme TCR degeneracy. Therefore, we determined the crystal structure of the BM3.3 TCR bound to the pBM8-H-2Kbm8 complex at a 2.9 Å resolution, and compared it with the BM3.3-pBM1-H-2Kb (Reiser et al, 2000) and BM3.3-VSV8-H-2Kb (Reiser et al, 2003) structures. Our findings showed how the BM3.3 TCR cross-recognizes less-fit pMHC ligands, which markedly differ from the best-fit pMHC ligand responsible for its in vivo selection. During cross-recognition, the TCR maintains, as much as possible, contacts with an optimal constellation of residues on the top of MHC α-helices, while simultaneously adapting to the novel chemistry encountered in the peptide ligand. In the case of the cross-recognized VSV8-H-2Kb and pBM8-H-2Kbm8 ligands, these conflicting forces resulted in suboptimal structural fit and in lower affinity interactions that elicited a partial activation programme with delayed T-cell proliferation, poor cytotoxic activity, and defective interleukin 2 (IL-2) production.
Results
BM3.3-pBM8-H-2Kbm8 structure
The overall structure of the BM3.3-pBM8-H-2Kbm8 complex does not deviate appreciably from that of the BM3.3-pBM1-H-2Kb and BM3.3-VSV8-H-2Kb complexes (Reiser et al, 2000, 2003). The positioning of the BM3.3 TCR onto the surface of the pBM8-H-2Kbm8 complex is globally conserved and its orientation relative to the axis of the pBM8 peptide follows a diagonal docking mode (Figure 1C). As attested by averaged B-factor (Table I), the Vα domain exhibits partial disorder and the electron density map in some of its portions is of poor quality. This resulted in discontinuous electron density in some Vα loops, including the tip of the CDR3α loop for which residues D96, G98, and G99 are almost totally absent from the unbiased, initial electron density map. After a few cycles of refinement, a continuous electron density could be calculated for CDR3α, with the exception of residues G98, G99, and D96. For these three residues that are located at the tip of the CDR3α loop, the model remained of poor quality (Figure 1A). In marked contrast, the floor of the H-2Kbm8 peptide-binding groove, the bound pBM8 peptide, and the V domain of the TCRβ chain, including the whole CDR3 loop, constituted a stable core with a very clear experimental electron density (Figure 1B).
Figure 1.
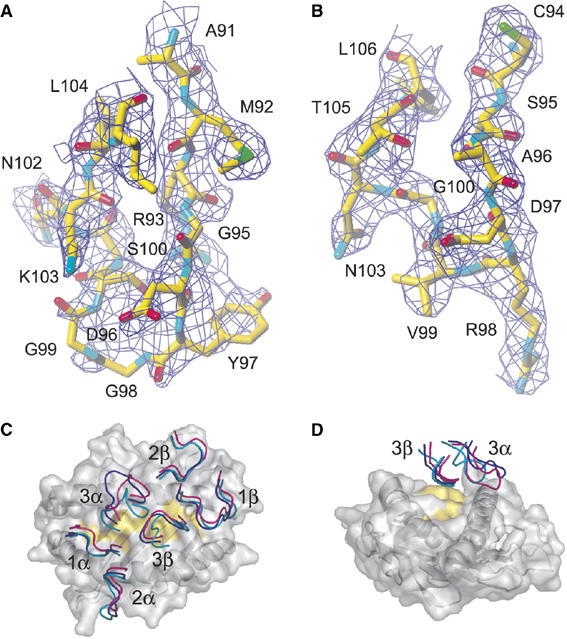
Relative orientation of the CDR loops of the BM3.3 TCR docked on the pBM8-H-2Kbm8, pBM1-H-2Kb, or VSV8-H-2Kb pMHC ligands. (A, B) Final 2Fo–Fc electron density maps around the CDR3α (A) and CDR3β (B) loops of the BM3.3 TCR in complex with the pBM8-H-2Kbm8 ligand. The electron density is well defined all along the CDR3β loop (encompassing residues C94-L106), and the refined model perfectly fits this density. In contrast, the tip of the CDR3α loop is less defined in the electron density map. Residues G98, G99, and the side chain of D96 are almost totally absent from the density map. Depth cueing has been used to improve the 3D effect by displaying objects at the front more brightly than those at the back. (C) The view is looking onto the surface of the pMHC peptide-binding groove. The MHC α-helices and the floor of the groove are visible through the semitransparent molecular surface. The molecular surface of the peptide is coloured in yellow. The N terminus of the peptide is on the left. The BM3.3 CDR loops are represented as thin coils and colour-coded as follows: blue: BM3.3-pBM1-H-2Kb, magenta BM3.3-VSV8-H-2Kb, and cyan: BM3.3-pBM8-H-2Kbm8. The three TCR–pMHC complexes have been aligned using the MHC α1 and α2 domains to emphasize potential deviations in the relative orientation of the CDR loops. (D) In this representation, the TCR is on the top and the peptide C terminus is oriented toward the viewer, and the BM3.3 CDR3 α and β loops are represented using the same colour code as in (C).
Table 1.
Data collection and refinement statistics
| Data collection | BM3.3-pBM8-H-2Kbm8 |
| Space group | P43212 |
| Unit cell (abc: Å, αβγ: deg) | a=102.523; b=102.523; c=198.381; α=β=γ=90 |
| Wavelength (Å) | 0.933 |
| ESRF beamline | ID14-2 |
| Oscillation range (deg) | 0.5 |
| Complex per asymmetric unit | 1 |
| Resolution, outer shell (Å) | 2.9 (3.06–2.9) |
| Observations/unique | 90 756 (24 208) |
| Completeness (%) | 98.6 (99.6) |
| Average redundancy | 3.8 (3.9) |
| Rmerge (%) | 11.6 (49.2) |
| Mn(I)/s.d. (σ) | 11.1 (1.9) |
| Refinement statistics | |
| Resolution range (Å) | 25–2.9 (2.974–2.9) |
| Reflections used (working set, test set) | 22 444, 1214 |
| Rcrystal (%) | 22.4 (36.4) |
| Rfree (%) | 28.3 (44.3) |
| R.m.s. deviations | |
| Bonds (Å), angles (deg) | 0.01, 1.35 |
| Average B-factor (Å2) | 45.2 |
| TCR Vα | 51.8 |
| TCR Vβ | 27.1 |
| PBM8 peptide | 14.2 |
| MHC α1 and α2 | 35.6 |
| MHC α3 | 61.1 |
| β2m | 64.8 |
| Ramachandran plot (%) | |
| Favoured, additional, generous, disallowed | 83.9, 14.4, 1.7, 0.0 |
| Rcrystal=∑(∣Fobs∣–k∣Fcalc∣)/∑∣Fobs∣. | |
| Rfree is calculated using 5% of the reflections. | |
| Values in parentheses reflect the highest resolution shell. | |
The BM3.3-VSV8-H-2Kb and BM3.3-pBM8-H-2Kbm8 complexes crystallized in the same space group and unit cell, and showed inter-crystal interactions that mainly involve the CDR2 loops. In contrast, in the BM3.3-pBM1-H-2Kb complex, inter-crystal contacts primarily involved the CDR3α and CDR1 loops. Despite such differential involvement of the CDR loops in crystal contacts, superposition of the three TCR–pMHC complexes showed only small root mean square differences between the conformation of the CDR1 and CDR2 loops (Figure 1C). The major TCR conformational differences observed between the three TCR–pMHC complexes were limited to the CDR3α loop (residues A91 to I105), and, to a lesser extent, to residue T93 of the CDR3β loop (Figure 1C and D).
The apex of the CDR3α loop is composed of residues D96, Y97, G98, G99, and constitutes its most flexible part. Comparison of the BM3.3-pBM1-H-2Kb and BM3.3-VSV8-H-2Kb complexes showed that the largest CDR3α positional shift occurred for residue Y97 (showing a 5.3 Å shift for the Cα atom). In BM3.3-VSV8-H-2Kb, residue Y97 of CDR3α primarily interacts with the Val residue found at P4 of VSV8, whereas in BM3.3-pBM1-H-2Kb, the CDR3α loop is out of reach of the peptide, the phenol group of Y97 being stabilized by inter-complex interaction with the backbone of residues 135–137 from a neighbouring MHC molecule. The CDR3α conformation observed in BM3.3-pBM1-H-2Kb excludes it from the TCR–pMHC-binding interface, leaving a large, water-filled cavity, between the pMHC and the TCR (Reiser et al, 2000). In BM3.3-pBM8-H-2Kbm8, the refined CDR3α backbone adopts a conformation closer to the one observed in the BM3.3-VSV8-H-2Kb complex. However, the high-temperature factors observed for the CDR3α apex prevent any reliable prediction of potential contacts between its tip and the pMHC surface.
Structural changes upon TCR binding
Available crystal structures of liganded and unliganded TCRs suggest that the flexibility of the TCR antigen-binding site facilitates TCR adaptation to rather conformationally constrained pMHC surfaces (Garcia et al, 1998; Reiser et al, 2002; Kjer_Nielsen et al, 2003). On the basis of the good quality of the final 2Fo–Fc electron density map of the BM3.3-pBM8-H-2-kbm8 complex (Figure 2A), we observed, however, that BM3.3 binding induced some structural reorganization in the peptide backbone conformation and within the B pocket. In its TCR-free state, the B pocket of H-2Kbm8 is characterized by intra-MHC interactions and by interactions between MHC residues and the side chain of Gln found at P2 of pBM8. As illustrated on Figure 2A, binding of BM3.3 induced a cascade of changes that likely started with the cation-π interaction occurring between the phenol group of Tyr found at P4 and the Arg guanidinium group found at position 98 of the CDR3β loop. This interaction induced a rotation of Asn70 of H-2Kbm8, which resulted in the reorganization of the network of interactions centred on the P2 side chain of pBM8. The only residue that appeared to be destabilized by this reorganization is Tyr45 for which the side chain is disordered in both the final 2Fo–Fc (Figure 2A), and the simulated annealing Fo–Fc (Supplementary Figure 1) electron density maps. Because the hydrogen-bond balance sheet corresponding to the B pocket is equivalent between the TCR-free and -bound states, the reorganization that occurred upon BM3.3 binding probably had a minimal impact on the overall stability of the pBM8-H-2Kbm8 complex.
Figure 2.
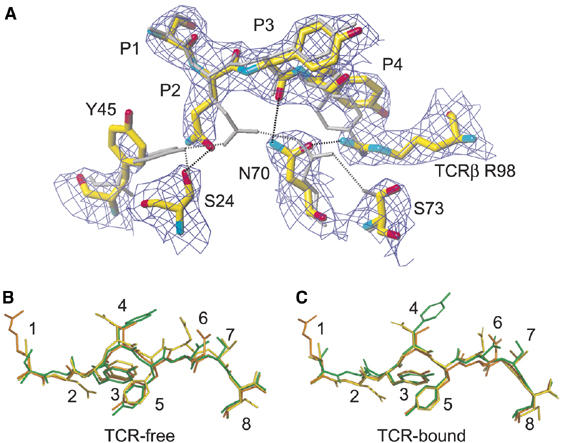
Comparison of the pBM1, pBM8, and VSV8 peptide conformations in their TCR-free and TCR-bound states. (A) Conformational changes occurring in the B pocket of the pBM8-H-2Kbm8 complex upon TCR binding. The final 2Fo–Fc electron density map contoured at 1σ is represented for the TCR-bound pBM8-H-2Kbm8 complex. Carbon atoms are in yellow, oxygen atoms in red, and nitrogen atoms in blue. Residue R98 from the TCR CDR3β loop is also shown. In the case of the TCR-free pBM8-H-2Kbm8 complex atoms are shown in light grey. Hydrogen bonds are represented as black or grey dashed lines. (B) Comparison of the pBM1 (yellow), pBM8 (green), and VSV8 (orange) peptide positions in their TCR-free state. (C) Comparison of the pBM1 (yellow), pBM8 (green), and VSV8 (orange) peptide positions in their TCR-bound state.
The cation-π interaction between residue Arg98 of the CDR3β loop and the phenol group of the Tyr residue found at P4 also affected the conformation of the backbone of the pBM8 peptide. In both the BM3.3-pBM1-H-2Kb and BM3.3-VSV8-H-2Kb complexes, BM3.3 docking induced an overall peptide displacement towards the bottom of the peptide-binding groove, whereas in the BM3.3-pBM8-H-2Kbm8 complex the peptide backbone stands slightly higher with a displacement that is maximal at the P4 position, where the Cα atom is shifted upward by 0.8 Å (Figure 2A). Our results show that upon TCR binding, both the bound peptide and the MHC peptide-binding groove can be the object of concerted structural reorganization. Consistent with this view, some limited structural reorganization has been reported within the Tax-HLA-A2 complex upon TCR binding (Ding et al, 1998).
Peptide recognition by BM3.3
The upward-pointing side chains found at positions 4, 6, and 7 of H-2Kb- or H-2Kbm8-bound peptides can potentially be sensed by the BM3.3 CDR loops. With the exception of position P6, which is either conserved in pBM1 and pBM8, or showed homologous replacement in VSV8, there exists a poor structural similarity in the other residues that are contacted by BM3.3 on the physiological peptide (pBM1) and on the two cross-recognized peptides (VSV8 and pBM8) (Table II). Comparison of the BM3.3-pBM1-H-2Kb and BM3.3-VSV8-H-2Kb crystal structures showed that the type and number of interactions observed between BM3.3 and either of the two peptides are very different, varying from six hydrogen bonds and 14 hydrophobic contacts for BM3.3-pBM1-H-2Kb, to 18 hydrophobic contacts and only one hydrogen bond for BM3.3-VSV8-H-2Kb (Reiser et al, 2003). With a total of six hydrogen bonds and 20 hydrophobic contacts, the recognition of pBM8 by BM3.3 resembles that observed for pBM1, three of the hydrogen bonds being in addition conserved between the two complexes (Figure 3 and Table II). In the BM3.3-pBM8-H-2Kbm8 complex, TCR-peptide contacts involved the CDR3β loop only and were evenly distributed over the three upward pointing residues (P4, P6, and P7) of pBM8. In contrast, in the BM3.3-pBM1-H-2Kb and BM3.3-VSV8-H-2Kb complexes, TCR-peptide contacts focused on P6 and P7 for pBM1, and on P6 and P4 for VSV8. Therefore, our results show that BM3.3 can adopt unique structural solutions to adapt to each peptide, and demonstrate that BM3.3 TCR cross-reactivity does not require a high degree of structural antigenic mimicry.
Table 2.
Comparison of TCR-pMHC interactions in the BM3.3-pBM1-H-2Kb, BM3.3-VSV8-H-2Kb, and BM3.3-pBM8-H-2Kbm8 complexes
| BM3.3-pBM1-H-2Kb | BM3.3-pBM8-H-2Kbm8 | BM3.3-VSV8-H-2Kb | ||||||
|---|---|---|---|---|---|---|---|---|
| BM3.3 | pBM1 | BM3.3 | pBM8 | BM3.3 | VSV8 | |||
| Hydrogen bonds (6) | Hydrogen bonds (6) | Hydrogen bonds (1) | ||||||
| D97β OD1 | T7 N | D97β OD2 | N6 ND2 | |||||
| D97β OD1 | T7 OG1 | |||||||
| R98β N | S7 OG | |||||||
| R98β NH2 | F5 O | R98β NE | Y5 O | |||||
| R98β N | N6 OD1 | R98β N | N6 OD1 | |||||
| R98β NH2 | Wat | D4 OD1 | R98β NH1 | Y4 OH | ||||
| V99β N | N6 OD1 | V99β N | N6 OD1 | |||||
| V99β O | N6 ND2 | V99β O | Q6 NE2 | |||||
| W31β NE1 | Wat | T7 OG | ||||||
| Y97α OH | Wat | Y5 O | ||||||
| Wat | Y5 N | |||||||
| van der Waals contacts (14) | van der Waals contacts (20) | van der Waals contacts (18) | ||||||
| W31β | 1 | T7 | Y97α | 14 | V4 | |||
| D97β | 6,2 | N6,T7 | D97β | 2,1 | N6,S7 | D97β | 2,1 | Q6,G7 |
| R98β | 11 | Y4 | ||||||
| V99β | 2,3 | D4,N6 | V99β | 2,4 | Y4,N6 | V99β | 1 | V4 |
| BM3.3 | H-2Kb | BM3.3 | H-2Kbm8 | BM3.3 | H-2Kb | |||
| Hydrogen bonds (14) | Hydrogen bonds (7) | Hydrogen bonds (7) | ||||||
| Q27α NE2 | E58 OE2 | Q27α NE2 | E58 OE2 | |||||
| Q27α OE1 | R62 NH2 | Q27α OE1 | R62 NH2 | |||||
| Q27α OE1 | R62 NE | |||||||
| S29α OG | T163 OG1 | S29α OG | T163 OG1 | |||||
| Y52α OH | R155 N | |||||||
| K53α NZ | E154 OE1 | K53α NZ | E154 OE1 | K53α NZ | E154 OE1 | |||
| Y97α O | Q65 NE2 | |||||||
| G98α N | Q65 OE1 | |||||||
| S51β OG | R79 NH2 | S51β OG | R79 NH2 | |||||
| S51β OG | R79 NH1 | S51β OG | R79 NE | |||||
| D97β OD2 | K146 NZ | D97β OD2 | K146 NZ | |||||
| R98β NH2 | G69 O | R98β NH1 | G69 O | R98β NH2 | G69 O | |||
| R98β NE | G69 O | R98β NH2 | G69 O | |||||
| R98β NE | S73 OG | |||||||
| R98β NH2 | S73 OG | |||||||
| R98β NH2 | N70 OD1 | R98β NH2 | N70 OD1 | |||||
| van der Waals contacts (37) | van der Waals contacts (26) | van der Waals contacts (60) | ||||||
| Q27α | 2 | R62 | Q27α | 3 | R62 | |||
| F31α | 2 | R155 | F31α | 3 | R155 | F31α | 1 | R155 |
| Y52α | 6,6, | E154, R155, | Y52α | 2,5 | E154, R155, | Y52α | 5,9, | E154,R155, |
| 4 | A158 | 6 | A158 | 2 | A158 | |||
| K53α | 3 | E154 | K53α | 1 | E154 | K53α | 1 | E154 |
| Y97α | 1,5, | Q65,K68, | ||||||
| 5,1 | G69,N70 | |||||||
| G98α | 3,1 | Q65,G69 | ||||||
| G99α | 1,1 | K68,G69 | ||||||
| W31β | 2 | V76 | W31β | 1 | V76 | W31β | 5 | V76 |
| R50β | 3 | V76 | R50β | 3 | V76 | R50β | 6 | V76 |
| S51β | 1 | R79 | S51β | 1 | R79 | |||
| P52β | 1 | R79 | ||||||
| D97β | 2 | K146 | D97β | 1 | K146 | |||
| R98β | 2 | G69 | R98β | 1,2 | G69,S73 | R98β | 2,2, | G69,S73 |
| 1 | R72 | |||||||
| V99β | 3 | R155 | V99β | 1 | R155 | V99β | 3 | R155 |
| N103β | 1 | A150 | ||||||
| Interactions conserved in the three complexes are depicted in red. Shared interactions between BM3.3-pBM8-H-2Kbm8 and BM3.3-pBM1-H-2Kb, and between BM3.3-pBM1-H-2Kb and BM3.3-VSV8-H-2Kb are shown in green and blue, respectively. | ||||||||
Figure 3.
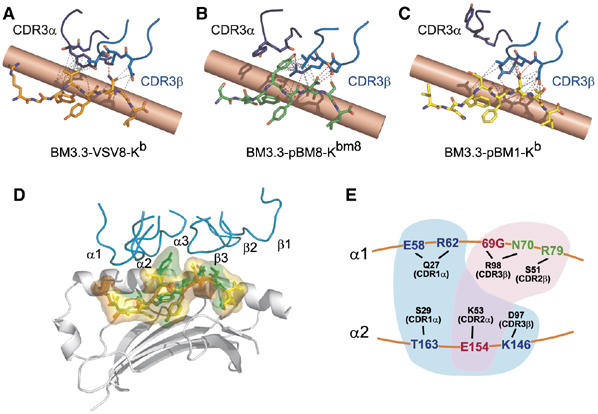
Views of pBM1, pBM8, and VSV8 peptide read-out by the BM3.3 CDR3 loops. The CDR3α and CDR3β loops are depicted in dark and light blue, respectively. VSV8 (A), pBM8 (B), and pBM1 (C) peptides are in orange, green, and yellow, respectively. Hydrogen bonds are shown in red, and van der Waals contacts in grey. The MHC α1-helix is depicted in background as a salmon cylinder. (D) Superposition of the pBM1 (yellow), pBM8 (green), and VSV8 (orange) peptides in the corresponding TCR–pMHC complexes. Peptides are depicted both in stick and semi-transparent molecular surface representations and the MHC molecule is shown as grey ribbons. For clarity, the MHC α2 helix has been removed and the TCR CDRs loops (colour-coded as in Figure 1C) are only represented in the conformation they adopt in the BM3.3-pBM8-H-2Kbm8 complex. Comparison of the molecular interfaces highlights the protrusion made by tyrosine P4 of pBM8 in the BM3.3-pBM8-H-2Kbm8 complex. (E) Schematic representation of the constellation of TCR-MHC hydrogen bonds found at the BM3.3-pBM1-H-2Kb interface. A centrally positioned subset of this constellation (shown in red) is also used during recognition of both H-2Kb-VSV8 and H-2Kbm8-pBM8. A distinct subset (shown in blue) is reused during recognition of H-2Kb-VSV8, whereas a third, non-overlapping subset (shown in green) is reused during recognition of H-2Kbm8-pBM8. MHC α-helices are symbolized by orange lines, and the CDRs contributing the specified BM3.3 contacts indicated in parentheses.
The binding alternatives adopted by BM3.3 on each pMHC ligand are probably facilitated by the presence of ‘versatile' residues in the interface. In the BM3.3 system, this can be readily illustrated by the diversity of interactions afforded by Arg98 that is located at the tip of the CDR3β loop. In the BM3.3-pBM8-H-2Kbm8 and BM3.3-pBM1-H-2Kb complexes, the side chain of Arg98 established hydrogen bonds with both the peptide and the MHC α1 helix, whereas in BM3.3-VSV8-H-2Kb it contacted the MHC α1 helix only. In the BM3.3-pBM8-H-2Kbm8 complex, an additional interaction involving Arg98 is permitted by the presence of a Tyr residue at P4 of pBM8, which favours formation of the cation-π pair described above. The promiscuous behaviour illustrated by the CDR3β loop seems to be commonly exploited in protein–protein interfaces where cation-π interactions involving tyrosine–arginine and tryptophan–arginine pairs are abundantly represented (Crowley and Golovin, 2005).
Peptide-dependent repositioning of the BM3.3 TCR
H-2Kb and H-2Kbm8 have identical TCR-contacting residues on the top of their MHC α-helices. Therefore, superimposition of the three BM3.3-pMHC complexes on the basis of their MHC α1 and α2 domains should pinpoint the level of repositioning induced by the need to recognize distinct antigenic peptides in a constant MHC frame (Figure 4). When compared to the position adopted on the surface of the physiological pBM1-H-2Kb ligand, BM3.3 undergoes a 1.5 Å translation toward the peptide C terminus during VSV8-H-2Kb recognition, and a 1.5 Å translation in the opposite direction during pBM8-H-2-Kbm8 recognition. With respect to its position on pBM1-H-2Kb, BM3.3 also shows rotations of 4.7 and 3.2° when bound to VSV8-H-2Kb and pBM8-H2-Kbm8, respectively. Despite this slight repositioning, the overall orientation of BM3.3 on the surface of the three pMHC ligands remains, however, very similar (Figures 1C and 4C–E).
Figure 4.
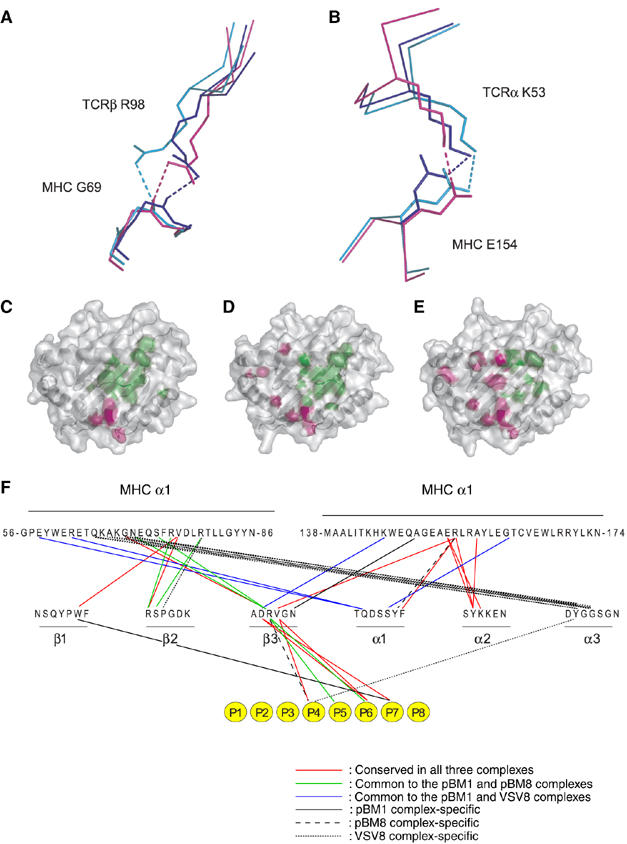
Comparison of BM3.3 docking onto the surface of the H-2Kb-pBM1, H-2Kb-VSV8, and H-2Kbm8-pBM8 complexes. (A, B) Close-up views of the two TCR-MHC hydrogen bonds conserved in the BM3.3-pBM1-H-2Kb (blue), BM3.3-VSV8-H-2Kb (magenta), and BM3.3-pBM8-H-2Kbm8 (cyan) complexes. (C–E) Views are looking directly onto the pMHC surface. Footprint of BM3.3 TCR on the VSV8-H-2Kb (C), pBM8-H-2Kbm8 (D), and pBM1-H-2Kb (E) surfaces. Peptide and MHC residues contacted by the TCRα chain or by the TCRβ chain are depicted in pink and green, respectively. The secondary structure of the MHC is apparent through the semitransparent surface. (F) Shared hydrogen bonding and van der Waals contacts between the BM3.3 CDRs and the three pMHC complexes. Interactions conserved in the three complexes are depicted in red. Shared interactions between BM3.3-pBM8-H-2Kbm8 and BM3.3-pBM1-H-2Kb, and between BM3.3-pBM1-H-2Kb and BM3.3-VSV8-H-2Kb are shown in green and blue, respectively. Interactions that are unique to either of the BM3.3-pBM1-H-2Kb, BM3.3-pBM8-H-2Kbm8 and BM3.3-VSV8-H-2Kb are depicted as continuous, dashed, or dotted lines, respectively. Also shown, using the same colour code, are the interactions between the BM3.3 CDRs and each residue of the bound octapeptide (depicted as yellow circles).
As schematized in Figure 3E and summarized in the two-dimensional contact maps shown in Figure 4F, the pattern of TCR-MHC interactions corresponding to each ternary complex is organized around a core that is strictly conserved in the three complexes and composed of two hydrogen bonds and of 13 van der Waals contacts. The TCR residues involved in the two conserved hydrogen bonds have each a long side chain, the rotation of which permits the repositioning of the TCR on the top of the MHC α-helices (Figure 4A and B). The rather limited numbers of TCR-MHC contacts conserved between the three studied complexes (Table II), corresponds to the fact that BM3.3 docks on the two cross-recognized ligands using positions that are shifted in opposite direction relative to the one adopted during recognition of pBM1-H-2Kb. Cross-recognition of the MHC surfaces in the pBM8-H-2Kbm8 and VSV8-H-2Kb complexes was also facilitated by changing the combination of contact atoms used by conserved pairs of interacting residues, or by taking advantage of increase in surface complementarity to establish a few novel contacts (Figure 4).
Tyrosine P4 disturbs the TCR–pMHC interface
The pBM8-H-2Kbm8 ligand displays a tyrosine at P4 of pBM8 that contrasts with the relatively small side chains found at P4 of pBM1 and VSV8. As illustrated in Figure 3D, this Tyr residue forms a large protrusion at the TCR–pMHC interface, representing 19% of the buried pMHC surface, whereas P4 contributes only 3.5 and 6% of the buried surface in pBM1-H-2Kb and VSV8-H-2Kb, respectively. Some TCRs can accommodate bulky peptide residues presented by class I MHC molecules using enlarged cavities that reside between their CDR3α and CDR3β loops (Ding et al, 1999; Chen et al, 2005). Likewise, the side chain of tyrosine P4 of pBM8 is enveloped between the two CDR3 loops of BM3.3, and makes extensive contacts (consisting of one hydrogen bond and 13 hydrophobic contacts) with the CDR3β loop, the main one being a cation-π interaction involving R98β (Figures 2A, 3B and D). Although Tyr P4 of pBM8 appears to constitute a strong anchor point for BM3.3 (Table II), its presence coincidently increases the median distance between the pMHC and the Vα surface from 0.53 Å for BM3.3-pBM1-H-2Kb to 0.92 Å for BM3.3-pBM8-H-2Kbm8. This increase in the distance separating the two surfaces is accompanied by a strong reduction in shape complementarity (Sc) (CCPN, 1994) between the Vα domain and the pMHC complex, the Sc value decreasing from 0.73 for pBM1 to 0.46 for pBM8 (Supplementary Table I). Coincident with this increase in the median distance between the pMHC and Vα surface, some important contacts, present in the two other BM3.3-based complexes, were lost or weakened in the BM3.3-pBM8-H-2Kbm8 interface. For instance, whereas in both BM3.3-pBM1-H-2Kb and BM3.3-VSV8-H-2Kb, interactions occurred between the CDR1α loop and the MHC α1 helix (involving the side chains of Q27 from the Vα domain and MHC residues E58 and R62, and the side chain of S29 of the Vα domain and MHC residue T163), these interactions were lost in the BM3.3-pBM8-H-2Kbm8 complex (Table II and Figure 3E). The loosened Vα-pMHC interaction observed in BM3.3-pBM8-H-2Kbm8 was, however, compensated in part by a reinforcement of the Vβ-pMHC interaction that shows both increased Sc and reduced median distance when compared to the BM3.3-pBM1-H-2Kb complex (Supplementary Table I). Therefore, in the BM3.3-pBM8-H-2Kbm8 complex, the presence of a bulky residue at P4 appears to introduce strong constraints on TCR docking, leading to the loss of some of the interactions that were used by BM3.3 during recognition of its physiological pBM1-H-2Kb ligand.
Full agonist properties of a pBM8Y4D peptide variant
Using surface plasmon resonance (SPR), we determined that the BM3.3 TCR binds pBM8-H-2Kbm8 with a KD of 112 μM, a value that is approximately 30 times higher than for the pBM1-H-2Kb ligand, and falls within the range reported for weak TCR agonists (Table III). This decrease in affinity is a result of both an increase in the apparent off-rate constant (koff), and a decrease in the apparent on-rate constant (kon) (Table III). Although the binding conformed to the simple 1 to 1 binding model (data not shown), the low resolution (10 Hz) of SPR precluded detection of more complex binding mechanisms involving conformational changes, which are much too fast to be solved by SPR (Gakamsky et al, 2005). The approximately nine-fold increase in koff is probably the result of a combination of the following mechanisms: a decrease in the number of contacts, particularly between the TCR and the MHC (Table II), a weakening of conserved contacts (because of subtle changes in bond length and/or geometry), and a reduction in the Sc, particularly between the TCR Vα domain and the pMHC surface. The approximately three-fold decrease in kon (2.8 × 10⁵ and 9.2 × 10⁴ M−1 s−1 for the BM3.3-pBM1-H-2Kb and BM3.3-pBM8-H-2Kbm8 interactions, respectively) may be the result of the large protrusion formed by the Tyr residue found at P4 of pBM8 (Figure 3D), impeding docking of BM3.3 onto pBM8-H-2Kbm8. Consistent with this view, substitution of Tyr P4 by a residue identical to the one present in pBM1 (see below) restores the kon back to BM3.3-pBM1-H-2Kb levels.
Table 3.
Kinetic and thermodynamic parameters of the interaction of BM3.3 with the specified pMHC ligands
| Parameter | pBM1-H-2Kb | pBM8-H-2Kbm8 | pBM8Y4D-H2Kbm8 |
|---|---|---|---|
| kon (M−1 s−1) | 2.8 × 10⁵ | 9.2 × 10⁴ | 3.3 × 10⁵ |
| koff (s−1) | 1.1 | 10.3 | 6.7 |
| KD (μM) | 3.6 | 112 | 20 |
| ΔG (kcal mol−1) | −7.5±0.1 | −5.5±0.03 | −6.5±0.1 |
| ΔH (kcal mol−1) | −13.4±0.4 | −3.1±0.4 | −5.4±0.1 |
| −TΔS (kcal mol−1) | +5.9±0.3 | −2.4±0.3 | −1.2±0.3 |
| ΔCp (cal mol−1 K−1) | −535±76 | −141±7 | −108±3.3 |
| Values are reported at 25°C. kon is calculated from the equation kon=koff/KD for the pBM8-H-2Kbm8 and pBM8Y4D-H-2Kbm8 interactions. Except for the pBM8Y4D-H-2Kbm8 ligand, values are reported as the mean of 3 independent experiments±the s.e.m. For the pBM8Y4D-H-2Kbm8 ligand, values are reported as the mean of two independent experiments±the s.e.m. | |||
To test whether Tyr P4 of pBM8 obliged BM3.3 to adopt a docking solution that is less energetically favourable than that observed in the BM3.3-pBM1-H-2Kb complex, we substituted Tyr P4 with an aspartic acid (to give pBM8Y4D), as found at P4 of pBM1. As shown in Table III, the BM3.3 TCR binds pBM8Y4D-H-2Kbm8 with a significantly higher affinity (KD=20 μM). This increase in affinity was mainly a result of a restoration of the kon to a value similar to that of the BM3.3-pBM1-H-2Kb interaction (3.3 × 10⁵ M−1 s−1). In contrast, the koff only decreased slightly (koff=6.7 s−1). This modest effect on the koff suggests that the Y4D substitution is unable to restore fully the loss of contacts and Sc in the pBM8Y4D-H-2Kbm8 complex to levels seen in the BM3.3-pBM1-H-2Kb complex. Therefore, SPR studies confirmed that Tyr P4 constitutes an interface-disrupting residue (Huseby et al, 2006). As predicted on the basis of the inspection of the BM3.3-pBM8-H-2Kbm8 interface, its substitution into an Asp restored BM3.3 TCR affinity to a value closer to that measured for the pBM1-H-2Kb agonist. Conversely, substitution into a Tyr of the Asp found at P4 of pBM1 markedly decreased its bioactivity and rendered the BM3.3 TCR dependent on the presence of the CD8 coreceptor (Table IV).
Table 4.
Peptide concentration required for half-maximum cytolysis by BM3.3 T-cell effectors in the presence or absence of an anti-CD8 antibody
| MHC | Peptide | Anti-CD8 mAba | Concentration of peptide that elicits 50% of the maximum response (M) |
|---|---|---|---|
| Kbm8 | pBM8 | − | 2 × 10⁻⁸ |
| Kbm8 | pBM8 | + | Total inhibition |
| Kbm8 | pBM8Y4D | − | 10−15 |
| Kbm8 | pBM8Y4D | + | Partial inhibition |
| Kbm8 | pBM8Y4V | − | 3 × 10⁻¹⁰ |
| Kbm8 | pBM8Y4V | + | Total inhibition |
| Kb | pBM1 | − | <10−15 |
| Kb | pBM1 | + | No inhibition |
| Kb | pBM1D4Y | − | 10−11 |
| Kb | pBM1D4Y | + | Total inhibition |
| Kb | pBM1D4V | − | <10−15 |
| Kb | pBM1D4V | + | Partial inhibition |
| An anti-CD8 monoclonal antibody was added during the cytotoxic assay at a concentration of 10 μg/ml. | |||
We next analysed the functional consequences of the recognition of the pBM8-H-2Kbm8 and pBM8Y4D-H-2Kbm8 ligands. Empty H-2Kbm8 molecules expressed on cells deprived of the transporter associated with antigen processing (TAP) were loaded with either pBM8 or pBM8Y4D, and those cells tested for their ability to be killed by cytotoxic T lymphocytes (CTL) derived from mice transgenic for the BM3.3 TCR. Consistent with its KD of 112 μM, the BM3.3-pBM8-H-2Kbm8 interaction triggered only a low level of cytotoxic activity (Supplementary Figure 2A). In contrast, target cells expressing pBM8Y4D-H-2Kbm8 were more efficiently killed than those expressing the pBM8-H-2Kbm8 ligand. Importantly, even low doses of pBM8Y4D were sufficient to sensitize H-2Kbm8-positive targets, allowing BM3.3 CTL to reach a sensitivity similar to that observed for targets expressing the physiological pBM1-H-2Kb ligand (Supplementary Figure 2A). In contrast to the partial programme of effector functions triggered by the weak agonist pBM8-H-2Kbm8 ligand, stimulation of naïve CD8+ T cells derived from mice transgenic for the BM3.3 TCR with antigen-presenting cells expressing the pBM8Y4D-H-2Kbm8 ligand triggered all the manifestations of CD8+ T-cell activation (proliferation, IL-2 production, CD25 induction, and enhanced expression of Granzyme B; Supplementary Figure 2B), with a magnitude similar to that induced by the pBM1-H-2Kb ligand. Therefore, in contrast to the A6-Tax-HLA-A2 and B7-Tax-HLA-A2 systems, where substitution with alanine of the upward-pointing tyrosine found at P5 of Tax resulted in decreased bioactivity (Ding et al, 1998), substitution of the interface-disrupting Tyr residue found at P4 of pBM8 into an Asp resulted in an dramatic increase of pBM8 bioactivity.
Considering that a valine is found at P4 of the weak VSV8 agonist, we also synthesized a pBM8Y4 V analogue, and showed that it triggered cytotoxicity, cell proliferation and induction of CD25 at a level intermediate between pBM8Y4D and pBM8, but failed to induce IL-2 secretion and Granzyme B expression (Table IV and Supplementary Figure 2). Although the introduction of a medium size, hydrophobic residue at P4 of pBM8 appears beneficial, full agonist recovery is thus only achieved in the presence of a medium size, acidic residue. Provided Val P4 of pBM8Y4V behaves as Val P4 of VSV8 and attracts the CDR3α loop into the interface, it is likely that displacing this loop from the conformation it adopted during recognition of pBM1 leads to an unfavourable remodelling of the interaction network. This might explain why a charged residue of medium size seems to be better tolerated at P4.
Thermodynamic analysis of BM3.3-pMHC interactions
Thermodynamic parameters were determined by van't Hoff analysis that involves measuring the dependence of affinity on temperature (Table III). The interaction of BM3.3 with pBM1-H-2Kb is characterized by unfavourable entropic and highly favourable enthalpic changes (Table III). This is typical of many, although not all (Davis-Harrison et al, 2005; Ely et al, 2006), TCR–pMHC interactions and is postulated to arise from the reduction of conformational flexibility at the binding interface upon binding (Willcox et al, 1999). Interestingly, there is a striking difference in the thermodynamic properties of the interaction of BM3.3 with pBM8-H-2Kbm8, where binding is accompanied by moderately favourable entropic and enthalpic changes (Table III). One possible explanation for this change is that there is a more modest decrease in conformational flexibility when BM3.3 binds to pBM8-H-2Kbm8, but this would seem unlikely given the lower kon value (Table III). These changes in thermodynamic properties are more likely to arise from differences in the number and strength of TCR–pMHC contacts formed and/or the amount of solvent trapping upon binding, accompanied by entropy–enthalpy compensation. These mechanisms are compatible with structural data, which show substantial differences in the conformation, contacts, and complementarity of the BM3.3-pBM1-H-2Kb and BM3.3-pBM8-H-2Kbm8-binding interfaces. Heat capacity changes (ΔCp) associated with macromolecular interactions have been shown to correlate reasonably well with the burial of non-polar and polar surfaces upon binding (Spolar and Record, 1994). The significant difference in ΔCp accompanying BM3.3 binding to pBM1-H-2Kb versus pBM8-H-2Kbm8 (Table III) is thus also consistent with a substantial change in the structure of the binding interfaces.
Discussion
The pBM8-H-2Kbm8 and VSV8-H-2Kb ligands only differ from the physiological pBM1-H-2Kb ligand with respect to the peptide and to four MHC residues that are inaccessible to direct TCR recognition. Therefore, comparison of the structure of those three pMHC ligands in complex with the BM3.3 TCR allowed us to determine how a given TCR adapts to three distinct composite surfaces comprising a variable component (the peptide) and a fixed component (the top of the MHC α-helices). Considering that the endogenous peptides that contribute to the development and physiology of a given T cell most likely differ in sequence from agonist peptides, the conditions documented in the present study mimic the different situations encountered by α T cell during its life. The present data also apply to conditions where memory T cells specific for one virus become reactivated during infection with an unrelated virus, a phenomenon known as heterologous immunity and that may result in protective or pathologic responses (Selin and Welsh, 2004).
BM3.3 maintained a similar overall docking pattern on the MHC α-helices for all three pMHC ligands. However, important adjustments that depend on the nature of the bound peptide were observed, including changes in the conformation of the CDR3α loop, rotation of long amino-acid side chains, reorganization of the atomic features of conserved contacts, and formation of a few contact specific to each of the cross-recognized ligands. Although there is one example where the CDR1α and CDR2α loops change conformation upon ligation to the pMHC (Kjer_Nielsen et al, 2003), the CDR1 and CDR2 loops found in BM3.3 appear poorly malleable and thus constitute a kind of rigid ‘shell' that surrounds the CDR3β loop. The CDR1 and CDR2 loops are involved in an extensive network of interactions with the MHC helices that likely constrains the docking register of the CDR3β loop, which is also held in a fixed conformation in the three TCR–pMHC complexes. In each complex, BM3.3 appeared to reach a compromise between two sets of conflicting requirements. On the one hand, it is likely that the block constituted by the CDR1α, CDR2α, CDR1β, CDR2β, and CDR3β loops has a ‘maximized' docking geometry on the H-2Kb MHC α-helices that corresponds to the one observed during the recognition of the agonist pBM1-H-2Kb ligand. On the other hand, BM3.3 needs to cope with the very different chemistry of the contacted P4 and P6 residues. The ‘optimal' set of TCR-MHC contacts used by BM3.3 to recognize H-2Kb bound to pBM1 is depicted in Figure 3E. A subset of those contact residues, which occupy a central position in the TCR–pMHC interface (shown in red in Figure 3E), is also reused during the recognition of both pBM8 and VSV8. A distinct subset, shown in blue in Figure 3E and proximal to the end of the peptide-binding groove accommodating the peptide N terminus, is reused only during the recognition of H-2Kb bound to VSV8. A third non-overlapping subset, shown in green in Figure 3E and proximal to the end of the peptide-binding groove accommodating the peptide C terminus, is only reused during recognition of pBM8. If we exclude the hydrophobic TCR-MHC contacts that result from the repositioning of the CDR3α loop inward toward Asp found at P4 of VSV8, very few TCR-MHC contacts are unique to each of the three interfaces (highlighted in black in Table II). Therefore, the systematic reuse of subsets of the constellation of TCR-MHC contacts involved in the best-fit BM3.3-pBM1-H-2Kb interface suggests that there are rather few or even a unique solution(s) for a given VαVβ combination to adapt to a fixed pMHC surface. In the case of BM3.3, the differential usage of this constellation of ‘optimal' TCR-MHC contacts allows it to cope with the constraints imposed by peptide ligands displaying a suboptimal chemistry. For instance, Tyr P4 of pBM8 constitutes a wedge forcing BM3.3 to use a subset of the ‘optimal' TCR-MHC contact constellation located near the end of the peptide-binding groove accommodating the peptide C terminus, whereas in the case of VSV8, exploitation of the binding potential of the tip of the flexible CDR3α loop biased MHC recognition toward the end of the peptide-binding groove accommodating the peptide N terminus. The two TCR-MHC hydrogen bonds that are conserved in the three complexes involved TCR residues with long side chains. They constituted some kind of central pivots around which the BM3.3 TCR ‘rotated' to adopt the docking mode observed either on pBM8-H-2-Kbm8 or on VSV8-H-2Kb (Figures 3E, 4A and B). Interestingly, these two conserved pivot points occupy positions that are almost coincident with a triad of residues hypothesized to guide MHC restriction (Tynan et al, 2005).
The TCR antigen-binding site has been categorized as both specific and degenerate. The present data provided some insights into this paradox. BM3.3 systematically uses its CDR3β loop to contact residue P6 of the bound peptide, and it fails to recognize analogues of the pBM1, VSV8, and pBM8 peptides with non-conservative replacements at P6 (Reiser et al, 2000). Comparison of the structure of the BM3.3 CDR3β loop in the three TCR–pMHC complexes showed that its tip behaves as a ‘rigid body' (Figure 1), providing a plausible explanation for the strong specificity it imposes on peptide recognition. As a consequence, in each of the analysed peptides, residue P6 serves as a recurrent, focal point for the BM3.3 TCR. It tolerates very few if any substitution at P6 and thus constitutes a ‘primary TCR contact residue' according to the nomenclature introduced by Allen and co-workers (Kersh et al, 2001). As discussed below, the rigid CDR3β loop cannot adapt to even conservative substitution in the adjacent P5 residue that anchors the peptide ligand to the MHC and indirectly controls the position of the Cα atom found at P6. The existence of ‘primary TCR contact residues' explains why T cells are able to discriminate peptide structures that differ even by a single oxygen atom, and can thereby achieve specific recognition under conditions where there is generally a 103–104 excess of self-peptides that may differ from antigenic peptides by only a single amino acid. In contrast, BM3.3 can adapt to non-conservative changes at residue P4 and such local degeneracy is allowed by both the plasticity of the CDR3α loop and the presence of a ‘versatile' Arg side chain at the tip of the CDR3β loop. Therefore, residues P4 as well as P7 can be categorized as ‘secondary TCR contact residues', and BM3.3 is able to tolerate some concerted, non-conservative variations of these residues.
Each docking solution achieved by BM3.3 involves a highly specific bond network. Therefore, as already stressed for TCR (Maynard et al, 2005) and antibody (James and Tawfik, 2003), degeneracy corresponds to highly specific, alternative structural solutions rather than to nonspecific stickiness. Although some CDR3s can assume large-scale conformational changes to adapt to alternative peptides (reviewed in Housset and Malissen, 2003), it is likely that they do not constitute ‘easily accommodating limp noodles' that can systematically adapt to sequence variations through deformation (Garcia and Adams, 2005). Therefore, the contribution of the malleability of some CDR3 loops to TCR degeneracy should probably not be overestimated. Moreover, some TCR antigen-binding sites are likely to be even less ‘accommodating' than the one that is found in BM3.3 and combines stable (CDR3β) and flexible (CR3α) loops. For instance, the 1G4 TCR showed very little conformational change upon recognition of its pMHC ligand, demonstrating that an optimized antigen-binding site can also be achieved with little structural adjustment (Chen et al, 2005).
The very limited range of variation tolerated at residue P6 of the bound peptides also illustrates the complex domino-like effects that exist at the level of the pMHC ligand. It emphasizes the danger of assuming that each peptide residue behaves independently because the presence of an ‘allowable' side chain at P6 is a necessary but not sufficient condition for productive interaction. For instance, in the case of the VSV8 peptide, the presence of a Gln at p6 is only tolerated because compensatory adjustments occurred in the adjacent P5 residue involved in anchoring the peptide to the MHC (Reiser et al, 2003). Likewise, the cation-π pair between Arg 98 of the BM3.3 CDR3β loop and the phenol group of the Tyr residue found at P4 of pBM8 indirectly increased solvent exposure of the Asn found at P6, enhancing its accessibility to the TCR and probably accounting for the better bioactivity observed for pBM8 compared to the less-accessible VSV8 peptide (Auphan-Anezin et al, 2006). Such concerted effects illustrate the complexity underlying TCR epitopes and show that the definition of TCR contact residues must take into account the presence of permissive side chains at residues flanking the TCR contacts (Kersh et al, 2001; Maynard et al, 2005; Donermeyer et al, 2006).
The combinatorial complexity that underlies the pBM1-H-2Kb and pBM8Y4D-H-2Kbm8 epitopes likely limits the number of potential peptides that will behave as agonist for BM3.3 and will result in maximal T-cell activation. During the cross-recognition of the pBM8-H-2Kbm8 and VSV8-H-2Kb ligands, BM3.3 TCR affinity remained approximately 10–30 times lower than for the physiological pBM1-H-2Kb ligand. These low-affinity TCR–pMHC interactions limit the biological consequences of cross-reactivity to only a few of the tasks a TCR need to perform during its existence. Because they require looser structural fit, low-affinity TCR–pMHC interactions are likely to occur with a higher probability than high-affinity TCR–pMHC interactions. They are likely to be achieved with the available repertoire of self-peptides, contributing for instance to ‘TCR tickling', a less demanding signalling task, chronically needed to heighten the reactivity of mature T cells. Therefore, when full-blown protective immunity is used as the ultimate cutoff for adaptive immune responses, TCRs are probably much less degenerate than initially assumed on the basis of theoretical considerations and on experiments using T-cell hybridomas and unphysiologically high doses of peptides.
In conclusion, it should be stressed that the TCR is only part of a complex cellular sensor. Although TCR cross-reactivity originates from the TCR V domains, it is modulated by cellular factors that often limit its biological relevance. For instance, in contrast to the situation observed with activated (hyper-responsive) T cells, when the BM3.3 TCR is expressed on resting (hypo-responsive) T cells, its low affinity for the two cross-recognized peptide VSV8 and pBM8 ligands resulted in either no activation (VSV8), or in the induction of a partial activation programme (pBM8). Among the factors that are extrinsic to the TCR and influence the breadth of TCR cross-reactivity are the CD4 and CD8 coreceptors (Holler et al, 2003), and intracellular negative feedback loops that once operational inhibit signals emanating from weak agonists (George et al, 2005). Therefore, defining TCR specificity can only be appropriately achieved in the context of a whole T cell, and even under such conditions, it will constitute an assay-dependent property influenced by the developmental stage and activation status of the T cell under study.
Materials and methods
Protein expression and purification
The variable domain of the BM3.3 TCR was produced as a single-chain construct (scFv) in myeloma cells, purified and deglycosylated as described previously (Reiser et al, 2003). The H-2Kbm8 heavy chain and β2-microglobulin were expressed in Escherichia coli as inclusion bodies, refolded, and purified with the pBM8 peptide as described (Zhang et al, 1992; Reiser et al, 2003).
Surface plasmon resonance
SPR studies were carried out at 25°C using a BIAcore 2000 or BIAcore 3000 with HBS buffer (10 mM Hepes, pH 7.4, 150 mM EDTA, 0.005% Surfactant P20). pMHC biotinylation was performed as described (O'Callaghan C et al, 1999). Biotinylated pMHC complexes were immobilized to CM5 sensor chips via covalently coupled streptavidin, as described (Wyer et al, 1999). Soluble BM3-3 purified by gel filtration (Willcox et al, 1999), was injected at a flow rate of 50 μl/min for 12 s. The background response was measured by simultaneous injection over a control surface with either immobilized anti-CD69 or H-2Kb-OVA and subtracted to yield the binding response. Affinity, kinetic, and thermodynamic measurements were performed as described previously (Lee et al, 2004).
Crystallization and data collection
Once purified, the H-2Kbm8-pBM8 complex and the BM3.3 TCR were mixed in a 1:1 molar ratio and concentrated to 8 mg/ml for crystallization. The BM3.3-pBM8-H-2Kbm8 crystals were grown at 4°C in hanging drops containing equal volumes of the complex solution and of a reservoir solution consisting of 12% PEG 6000, 100 mM Hepes, pH 7.5, and 150 mM magnesium acetate. After they reached a maximum size of 0.15 × 0.15 × 0.15 mm3, crystals were progressively transferred into a cryoprotectant solution made of 16% PEG 6000, 100 mM Hepes, pH 7.5, 150 magnesium acetate, and 20% glycerol, and flash-frozen in liquid nitrogen. Data were collected up to 2.9 Å resolution at the European Synchrotron Radiation Facility (Grenoble, France) beamline ID14-eh2, using a 0.933 Å wavelength and an ADSC detector. Data were indexed and integrated with MOSFLM (Leslie, 1999) and scaled with SCALA (Table I).
Crystal structure determination and refinement
The crystals belong to the P43212 space group and are isomorphous to the BM3.3-VSV8-H-2Kb crystals (Reiser et al, 2003). Therefore, a BM3.3-VSV8-H-2Kb model, deprived of both CDR3 loops and VSV8 peptide, was used as a start model in rigid-body refinement for the resolution of the BM3.3-pBM8-H-2Kbm8 complex. The model was refined to good statistics after several iterative rounds of model building in TURBO-FRODO (Roussel and Cambillau, 1991) and refinement with CNS (Brunger et al, 1998). Water molecules were included in the model if they were within hydrogen bonding distance to chemically reasonable groups and appeared in Fo–Fc maps contoured at 3σ. Accordingly, this resulted in the addition of 77 water molecules. Similarly, one N-acetylglucosamine was added, covalently bound to residue N56 of the Vα domain. A final refinement using the TLS option (Winn et al, 2001) of the REFMAC5 programme (Murshudov et al, 1997) was performed. Table I shows the final data processing, refinement, and model statistics. The overall quality of the refined model varies according to the domains under consideration. For instance, the electron density corresponding to the peptide, the MHC α1 and α2 domains and the TCRβ chain, is of very good quality (Figure 1B), with average B-factor ranging from 44 to 56 Å2 for the peptide and the MHC peptide-binding groove, respectively (Table I). In contrast, the TCRα, the MHC α3 and the β2m components are more disordered and exhibit average temperature factors 20 Å2 higher than those of the previous domains (Table I). This is characterized by a discontinuous electron density in some loops, including the tip of the CDR3α loop for which residues D96, G98, and G99 are almost totally absent from the experimental electron density map (Figure 1A). Comparison of the three different TCR–pMHC complexes was carried out after superimposition of the corresponding MHC α1α2 domains. Figures were generated with Molscript (Kraulis, 1991), Raster3D (Merritt, 1994), and Pymol (http://pymol.sourceforge.net/). Sc and median distances between surfaces were calculated with Sc (CCPN, 1994) and buried surface areas were calculated with areaimol (CCPN, 1994). Coordinates of the BM3.3-pBM8-H-2Kbm8 complex have been deposited with the Protein Data Bank under accession number 2OL3.
Cell purification and culture
CD8+ T cells were purified from lymph nodes of TCR BM3.3 mice (Auphan-Anezin et al, 2006), by negative selection using mouse CD8-negative isolation kit (Dynal Biotech ASA, Oslo, Norway), according to the manufacturer's protocol. CD8+ T cells, representing 90–98% of the enriched population, were preincubated for 10 min at 37°C with 5 μM CFSE (Molecular Probes, OR), and then incubated with the antigen-presenting cells specified in the figure legend. When indicated, cultures were supplemented with pBM1, pBM1D4Y, pBM1D4V, pBM8, pBM8Y4D, or pBM8Y4 V peptides (Schafer-N, DK, and Eurogentec, F).
Flow cytometric analyses
Antibodies used for immunofluorescence staining were PerCP-Cy5.5-, APC-, and PE-conjugated antibodies against CD8α CD25, and IL-2 (BD Pharmingen, CA). Intracellular staining for Granzyme B (Caltag) was performed as described (Auphan-Anezin et al, 2006). For IL-2 intracellular staining, cells were harvested after 24 h of primary culture, and restimulated for 4 h with ionomycin and PMA in the presence of monensin.
Cytotoxic assays
BM3.3 CD8 T-cell effectors have been obtained after 3 days in vitro stimulation of naïve T cells derived from mice transgenic for the BM3.3 TCR using either H-2Kbm8-positive antigen-presenting cells in the presence of IL-2, or H-2Kb-positive antigen-presenting cells. Cytotoxic activity was tested on 51Cr-labelled (sodium chromate, NEN, MA) Tap-2-deficient H-2b RMA-S cells and on H-2Kb-negative, H-2Kbm8-expressing RMA-S targets (Auphan-Anezin et al, 2006), during a 4 h incubation.
Supplementary Material
Supplementary Data
Acknowledgments
We thank L Leserman and M Malissen for discussion and the Marseille-Nice Genopole Structural Biology Platform for making available its facilities. This work was supported by CNRS, INSERM, the European Communities (project EPI-PEP-VAC QLK2-CT-00620 to BM), ANR (to BM), ARC (to BM and AMSV), and FRM (to BM). CM was supported by the European Communities and FRM.
References
- Auphan-Anezin N, Mazza C, Guimezanes A, Barrett-Wilt GA, Montero-Julian F, Roussel A, Hunt DF, Malissen B, Schmitt-Verhulst AM (2006) Distinct orientation of the alloreactive monoclonal CD8 T cell activation program by three different peptide/MHC complexes. Eur J Immunol 36: 1856–1866 [DOI] [PubMed] [Google Scholar]
- Brunger AT, Adams PD, Clore GM, DeLano WL, Gros P, Grosse-Kunstleve RW, Jiang JS, Kuszewski J, Nilges M, Pannu NS, Read RJ, Rice LM, Simonson T, Warren GL (1998) Crystallography & NMR system: a new software suite for macromolecular structure determination. Acta Crystallogr D 54: 905–921 [DOI] [PubMed] [Google Scholar]
- CCPN (1994) The CCP4 suite: programs for protein crystallography. Acta Crystallogr D 50: 760–763 [DOI] [PubMed] [Google Scholar]
- Chen JL, Stewart-Jones G, Bossi G, Lissin NM, Wooldridge L, Choi EM, Held G, Dunbar PR, Esnouf RM, Sami M, Boulter JM, Rizkallah P, Renner C, Sewell A, van der Merwe PA, Jakobsen BK, Griffiths G, Jones EY, Cerundolo V (2005) Structural and kinetic basis for heightened immunogenicity of T cell vaccines. J Exp Med 201: 1243–1255 [DOI] [PMC free article] [PubMed] [Google Scholar]
- Crowley PB, Golovin A (2005) Cation-pi interactions in protein–protein interfaces. Proteins 59: 231–239 [DOI] [PubMed] [Google Scholar]
- Davis-Harrison RL, Armstrong KM, Baker BM (2005) Two different T cell receptors use different thermodynamic strategies to recognize the same peptide/MHC ligand. J Mol Biol 346: 533–550 [DOI] [PubMed] [Google Scholar]
- Ding YH, Baker BM, Garboczi DN, Biddison WE, Wiley DC (1999) Four A6-TCR/peptide/HLA-A2 structures that generate very different T cell signals are nearly identical. Immunity 11: 45–56 [DOI] [PubMed] [Google Scholar]
- Ding YH, Smith KJ, Garboczi DN, Utz U, Biddison WE, Wiley DC (1998) Two human T cell receptors bind in a similar diagonal mode to the HLA-A2/Tax peptide complex using different TCR amino acids. Immunity 8: 403–411 [DOI] [PubMed] [Google Scholar]
- Donermeyer DL, Weber KS, Kranz DM, Allen PM (2006) The study of high-affinity TCRs reveals duality in T cell recognition of antigen: specificity and degeneracy. J Immunol 177: 6911–6919 [DOI] [PubMed] [Google Scholar]
- Ely LK, Beddoe T, Clements CS, Matthews JM, Purcell AW, Kjer-Nielsen L, McCluskey J, Rossjohn J (2006) Disparate thermodynamics governing T cell receptor-MHC-I interactions implicate extrinsic factors in guiding MHC restriction. Proc Natl Acad Sci USA 103: 6641–6646 [DOI] [PMC free article] [PubMed] [Google Scholar]
- Gakamsky DM, Luescher IF, Pramanik A, Kopito RB, Lemonnier F, Vogel H, Rigler R, Pecht I (2005) CD8 kinetically promotes ligand binding to the T-cell antigen receptor. Biophys J 89: 2121–2133 [DOI] [PMC free article] [PubMed] [Google Scholar]
- Garcia KC, Adams EJ (2005) How the T cell receptor sees antigen—a structural view. Cell 122: 333–336 [DOI] [PubMed] [Google Scholar]
- Garcia KC, Degano M, Pease LR, Huang M, Peterson PA, Teyton L, Wilson IA (1998) Structural basis of plasticity in T cell receptor recognition of a self peptide-MHC antigen. Science 279: 1166–1172 [DOI] [PubMed] [Google Scholar]
- George AJ, Stark J, Chan C (2005) Understanding specificity and sensitivity of T-cell recognition. Trends Immunol 26: 653–659 [DOI] [PubMed] [Google Scholar]
- Holler PD, Chlewicki LK, Kranz DM (2003) TCRs with high affinity for foreign pMHC show self-reactivity. Nat Immunol 4: 55–62 [DOI] [PubMed] [Google Scholar]
- Housset D, Malissen B (2003) What do TCR-pMHC crystal structures teach us about MHC restriction and alloreactivity? Trends Immunol 24: 429–437 [DOI] [PubMed] [Google Scholar]
- Huseby ES, Crawford F, White J, Marrack P, Kappler JW (2006) Interface-disrupting amino acids establish specificity between T cell receptors and complexes of major histocompatibility complex and peptide. Nat Immunol 7: 1191–1199 [DOI] [PubMed] [Google Scholar]
- James LC, Tawfik DS (2003) The specificity of cross-reactivity: promiscuous antibody binding involves specific hydrogen bonds rather than nonspecific hydrophobic stickiness. Protein Sci 12: 2183–2193 [DOI] [PMC free article] [PubMed] [Google Scholar]
- Kersh GJ, Miley MJ, Nelson CA, Grakoui A, Horvath S, Donermeyer DL, Kappler J, Allen PM, Fremont DH (2001) Structural and functional consequences of altering a peptide MHC anchor residue. J Immunol 166: 3345–3354 [DOI] [PubMed] [Google Scholar]
- Kjer_Nielsen L, Clements CS, Purcell AW, Brooks AG, Whisstock JC, Burrows SR, McCluskey J, Rossjohn J (2003) A structural basis for the selection of dominant alphabeta T cell receptors in antiviral immunity. Immunity 18: 53–64 [DOI] [PubMed] [Google Scholar]
- Kraulis PJ (1991) MOLSCRIPT: a program to produce both detailed and schematic plots of protein structures'. J Appl Crystallogr 24: 946–950 [Google Scholar]
- Krogsgaard M, Li QJ, Sumen C, Huppa JB, Huse M, Davis MM (2005) Agonist/endogenous peptide-MHC heterodimers drive T cell activation and sensitivity. Nature 434: 238–243 [DOI] [PubMed] [Google Scholar]
- Lee JK, Stewart-Jones G, Dong T, Harlos K, Di Gleria K, Dorrell L, Douek DC, van der Merwe PA, Jones EY, McMichael AJ (2004) T cell cross-reactivity and conformational changes during TCR engagement. J Exp Med 200: 1455–1466 [DOI] [PMC free article] [PubMed] [Google Scholar]
- Leslie AG (1999) Integration of macromolecular diffraction data. Acta Crystallogr D 55: 1696–1702 [DOI] [PubMed] [Google Scholar]
- Mason D (1998) A very high level of crossreactivity is an essential feature of the T-cell receptor. Immunol Today 19: 395–404 [DOI] [PubMed] [Google Scholar]
- Maynard J, Petersson K, Wilson DH, Adams EJ, Blondelle SE, Boulanger MJ, Wilson DB, Garcia KC (2005) Structure of an autoimmune T cell receptor complexed with class II peptide-MHC: insights into MHC bias and antigen specificity. Immunity 22: 81–92 [DOI] [PubMed] [Google Scholar]
- Merritt EA, Murphy ME (1994) Raster3D Version 2.0—a program for photorealistic molecular graphics. Acta Crystallogr D 50: 869–873 [DOI] [PubMed] [Google Scholar]
- Murshudov GN, Vagin AA, Dodson EJ (1997) Refinement of macromolecular structures by the maximum-likelihood method. Acta Crystallogr D 53: 240–255 [DOI] [PubMed] [Google Scholar]
- O'Callaghan C A, Byford MF, Wyer JR, Willcox BE, Jakobsen BK, McMichael AJ, Bell JI (1999) BirA enzyme: production and application in the study of membrane receptor-ligand interactions by site-specific biotinylation. Anal Biochem 266: 9–15 [DOI] [PubMed] [Google Scholar]
- Reiser JB, Darnault C, Gregoire C, Mosser T, Mazza G, Kearney A, van der Merwe PA, Fontecilla-Camps JC, Housset D, Malissen B (2003) CDR3 loop flexibility contributes to the degeneracy of TCR recognition. Nat Immunol 4: 241–247 [DOI] [PubMed] [Google Scholar]
- Reiser JB, Darnault C, Guimezanes A, Gregoire C, Mosser T, Schmitt-Verhulst AM, Fontecilla-Camps JC, Malissen B, Housset D, Mazza G (2000) Crystal structure of a T cell receptor bound to an allogeneic MHC molecule. Nat Immunol 1: 291–297 [DOI] [PubMed] [Google Scholar]
- Reiser JB, Gregoire C, Darnault C, Mosser T, Guimezanes A, Schmitt-Verhulst AM, Fontecilla-Camps JC, Mazza G, Malissen B, Housset D (2002) A T cell receptor CDR3beta loop undergoes conformational changes of unprecedented magnitude upon binding to a peptide/MHC class I complex. Immunity 16: 345–354 [DOI] [PubMed] [Google Scholar]
- Roussel A, Cambillau C (1991) The TURBO-FRODO graphic package. In Silicon Graphics Geometry Partners Directory, Mountain View, CA, p 81 [Google Scholar]
- Selin LK, Welsh RM (2004) Plasticity of T cell memory responses to viruses. Immunity 20: 5–16 [DOI] [PMC free article] [PubMed] [Google Scholar]
- Spolar RS, Record MT Jr (1994) Coupling of local folding to site-specific binding of proteins to DNA. Science 263: 777–784 [DOI] [PubMed] [Google Scholar]
- Tynan FE, Burrows SR, Buckle AM, Clements CS, Borg NA, Miles JJ, Beddoe T, Whisstock JC, Wilce MC, Silins SL, Burrows JM, Kjer-Nielsen L, Kostenko L, Purcell AW, McCluskey J, Rossjohn J (2005) T cell receptor recognition of a ‘super-bulged' major histocompatibility complex class I-bound peptide. Nat Immunol 6: 1114–1122 [DOI] [PubMed] [Google Scholar]
- van Bleek GM, Nathenson SG (1991) The structure of the antigen-binding groove of major histocompatibility complex class I molecules determines specific selection of self-peptides. Proc Natl Acad Sci USA 88: 11032–11036 [DOI] [PMC free article] [PubMed] [Google Scholar]
- Webb AI, Borg NA, Dunstone MA, Kjer-Nielsen L, Beddoe T, McCluskey J, Carbone FR, Bottomley SP, Aguilar MI, Purcell AW, Rossjohn J (2004) The structure of H-2K(b) and K(bm8) complexed to a herpes simplex virus determinant: evidence for a conformational switch that governs T cell repertoire selection and viral resistance. J Immunol 173: 402–409 [DOI] [PubMed] [Google Scholar]
- Willcox BE, Gao GF, Wyer JR, Ladbury JE, Bell JI, Jakobsen BK, van der Merwe PA (1999) TCR binding to peptide-MHC stabilizes a flexible recognition interface. Immunity 10: 357–365 [DOI] [PubMed] [Google Scholar]
- Winn MD, Isupov MN, Murshudov GN (2001) Use of TLS parameters to model anisotropic displacements in macromolecular refinement. Acta Crystallogr D 57: 122–133 [DOI] [PubMed] [Google Scholar]
- Wyer JR, Willcox BE, Gao GF, Gerth UC, Davis SJ, Bell JI, van der Merwe PA, Jakobsen BK (1999) T cell receptor and coreceptor CD8 alphaalpha bind peptide-MHC independently and with distinct kinetics. Immunity 10: 219–225 [DOI] [PubMed] [Google Scholar]
- Zhang W, Young AC, Imarai M, Nathenson SG, Sacchettini JC (1992) Crystal structure of the major histocompatibility complex class I H-2Kb molecule containing a single viral peptide: implications for peptide binding and T-cell receptor recognition. Proc Natl Acad Sci USA 89: 8403–8407 [DOI] [PMC free article] [PubMed] [Google Scholar]
Associated Data
This section collects any data citations, data availability statements, or supplementary materials included in this article.
Supplementary Materials
Supplementary Data