

Abstract
α-sarcin ribotoxins comprise a unique family of ribonucleases that cripple the ribosome by catalyzing endoribonucleolytic cleavage of ribosomal RNA at a specific location in the sarcin/ricin loop (SRL). The SRL structure alone is cleaved site-specifically by the ribotoxin, but the ribosomal context enhances the reaction rate by several orders of magnitude. We show that, for the α-sarcin-like ribotoxin restrictocin, this catalytic advantage arises from favorable electrostatic interactions with the ribosome. Restrictocin binds at many sites on the ribosomal surface and under certain conditions cleaves the SRL with a second-order rate constant of 1.7 × 10¹⁰ M-1 s-1, a value that matches the predicted frequency of random restrictocin-ribosome encounters. The results suggest a mechanism of target location whereby restrictocin encounters ribosomes randomly and diffuses within the ribosomal electrostatic field to the SRL. These studies show a role for electrostatics in protein-ribosome recognition.
Certain fungi secrete cytotoxic ribonucleases that kill cells by inactivating ribosomes1-4. These ribonucleases cross cell membranes via a receptor-independent pathway, and once in the cytoplasm, they catalytically cleave a specific phosphodiester bond in the universally conserved SRL structure in 23S-28S rRNA3. The cleavage disrupts binding of elongation factors to the ribosome, halts protein synthesis and ultimately triggers apoptotic cell death4.
Ribotoxins have garnered attention among ribonucleases because of their rare ability to target a specific RNA structure. Since the discovery of α-sarcin, a number of additional ribotoxins have emerged5. All contain 149 or 150 amino acid residues and share greater than 80% sequence identity, suggesting that they adopt similar folded structures and have comparable physicochemical properties. Ribotoxins have the same core fold, active site and cleavage pathway as RNase T1 (refs. 6,7). Despite these similarities, RNase T1 and the ribotoxins possess very different substrate specificities. T1-like nucleases cleave RNA strands after every guanosine residue. In contrast, ribotoxins target a specific stem-loop, the SRL, cleaving only one of several thousand phosphodiester bonds in the ribosome3.
RNA oligonucleotides that contain the SRL sequence undergo sitespecific cleavage by ribotoxins, providing a convenient system for structural and functional analyses. Such studies have qualitatively established the importance of the bulged-G motif for cleavage within the GAGA tetraloop (Fig. 1a), leading to a ‘molecular ruler’ model for SRL recognition8. Ribotoxins cleave their natural substrates, ribosomes, several orders of magnitude faster than SRL mimics3,8, indicating that the ribosomal context of the SRL contributes substantially to specificity. We set out to address the mechanism underlying this rate enhancement by quantitatively characterizing the ribotoxininduced cleavage of the SRL and using the resulting mechanistic framework to investigate ribotoxin-induced cleavage of the ribosome. Restrictocin, from Aspergillus restrictus, was chosen for this study because it is the only ribotoxin whose complex with the SRL has been structurally characterized9.
Figure 1.

Coulomb force dominates the interaction between restrictocin and oligonucleotides. (a) Structure of the rat SRL oligonucleotide substrate (PDB entry 430D). (b) KCl concentration dependence of SRL and pGpA cleavage under kcat/Km and kcat conditions. For kcat/Km conditions, reactions contained 0.001-10 μM restrictocin and <1 nM SRL. For kcat conditions, reactions contained 100 nM restrictocin and 5 μM SRL. The SRL data were fit to equation (1) (Methods). (c) Dependence of restrictocin binding (K½) on oligonucleotide length (Supplementary Table 2). K½ values were obtained from reactions containing 0.001-10 μM restrictocin, <1 nM RNA substrates and 5 mM KCl.
In this work, the electrostatic character of the ribosomal surface emerges as an unpredicted determinant of ribotoxin specificity. We show that favorable electrostatic interactions with the ribosome allow the positively charged ribotoxin to bind with high affinity and speed, thereby enhancing the rate of SRL cleavage by several orders of magnitude. The ribotoxin restrictocin cleaves the ribosome with a second-order rate constant kcat/Km of 1.7 × 10¹⁰ M-1 s-1, matching the catalytic efficiency of the fastest known enzymes10-12.
RESULTS
The role of electrostatics
Under previously reported reaction conditions8 (50-70 mM monovalent salt), restrictocin cleaves the SRL with a second-order rate constant kcat/Km of (1±0.3) × 10 M-1 s-1 (Fig. 1b, closed circles) and a Km of 76 ± 10 μM (Supplementary Fig. 1 online), similar to the published values for α-sarcin13,14. The relatively slow reaction and weak binding of the SRL complicated characterization of the enzymatic reaction, prompting us to examine the effects of variations in pH, temperature and buffer composition (Supplementary Fig. 1 and Supplementary Table 1 online). The initial reaction pH (7.4) and temperature (37 °C) were already optimal for restrictocin. However, the reaction rate was much greater upon dilution of the monovalent salt concentration. The logarithm of kcat/Km decreased linearly with a slope (n) of -4.2 ± 0.3 as the logarithm of [KCl] increased (Fig. 1b,closed circles). Experiments with other salts gave analogous results (Supplementary Fig. 2 online). At low salt concentration ([KCl] < 5mM), the rate of restrictocin-induced cleavage reached an apparent maximum and became salt independent. Under kcat conditions ([SRL] » Km), KCl concentration had no effect on the observed rate (Fig. 1b, open circles), suggesting that the strong salt sensitivity of kcat/Km arises from changes in Km values. We confirmed this by direct measurement of Km at different salt concentrations (Supplementary Fig. 1). Under optimal conditions (10 mM Tris-HCl, 0-5 mM KCl, pH 7.0-7.4, 37 °C) restrictocin cleaves the SRL with a kcat/Km value of 108-109 M-1 s-1, which exceeds published kcat/Km values for any ribotoxin by 104-to 105-fold13,14.
To explore the origin of inhibition by KCl, we first tested whether KCl affects the active site of restrictocin. We used the cleavage rate of the dinucleotide GA as a measure of the ‘intrinsic activity’ of this endonuclease. The dinucleotide GA mimics the sequence surrounding the scissile bond of the SRL but lacks the flanking nucleotides. The concentration of KCl had no effect on the cleavage rate of the GA dinucleotide (Fig. 1b, squares), suggesting that the catalytic properties of the restrictocin active site remain uniform over the entire range of KCl concentrations. To test whether the inhibition arises from saltinduced rearrangement of the SRL to a weaker binding structure, we determined the salt-rate profile for restrictocin cleavage of an unstructured single-stranded RNA (ssRNA) (Supplementary Fig. 2). KCl inhibited this reaction with the same concentration dependence as for the SRL, precluding a salt-induced change in the SRL structure as the reason for the observed inhibition.
Alternatively, the steep salt dependence of the SRL reaction may reflect competition between the ribotoxin and the salt cations for electrostatic interactions with the RNA, as established for numerous other protein-nucleic acid binding reactions15-18. The surface of restrictocin is positively charged (pIcalc 9.13) and could interact electrostatically with the negatively charged RNA. These electrostatic interactions are expected to redistribute the ion atmosphere surrounding the SRL and restrictocin upon complex formation, rendering binding dependent on the salt concentration. The salt dependence, , reflects the number of ion pairs released (a negative slope) from the RNA and protein upon complex formation18,19. For restrictocin-catalyzed cleavage of the SRL, changes in kcat/Km reflect changes in Km (Fig. 1b) and Km is equal to the equilibrium dissociation constant Kd (Supplementary Fig. 3 online). Therefore, we substituted with to obtain a value of n = -4.2 ± 0.3.
To test further the model wherein restrictocin interacts with the SRL electrostatically, we measured the single-turnover kinetic parameters k2 (the maximum rate constant under single-turnover conditions with saturating restrictocin) and K½ (restrictocin concentration required to achieve half-maximal velocity under single-turnover conditions) for a series of RNA oligonucleotides of increasing length (Supplementary Table 2 online). These substrates contained at least one embedded GA site and were cleaved by restrictocin predominantly after purines. At 5 mM KCl, all non-SRL substrates reacted with similarly slow rates (k2 values of (6 ± 4) × 10-4 s-1), but showed improvement in K½ values as substrate length increased (Fig. 1c). Beginning with K½ = 0.5 ± 0.2 mM for the pGpA dinucleotide, each additional nucleotidyl group provided 2.3 ± 0.1-fold improvement to K½, or 0.51 ± 0.03 kcal mol-1 to the binding energy. Beyond ∼20 nucleotides, this effect attenuated until the binding affinity reached a maximum of ∼10 nM for oligonucleotides containing 25 residues or more. Such substrates bind restrictocin with the same affinity as the SRL, indicating that substrate length, not sequence or structure, dictates the stability of the binary complex and suggesting that binding occurs via nonspecific electrostatic interactions.
To determine whether the role of electrostatics reflects a conserved feature of ribotoxins, we examined the salt-rate dependence of the SRL cleavage by the restrictocin homolog α-sarcin. α-sarcin cleaved the SRL with a similarly steep salt dependence (n = -4.8 ± 0.4; Supplementary Fig. 2) and showed the same considerable improvement in kinetic parameters at low salt concentrations (kcat/Km =(1 ± 0.4) ×107 M-1 s-1 and Km = 8 ± 2 nM at 5 mM KCl), due to better binding as described above for restrictocin. All sequenced members of the α-sarcin family have calculated isoelectric points in the basic range, suggesting that our observations have functional implications for this entire family.
Ribosomes as targets
As described above for the SRL, the ribotoxin loses 104-to 105-fold in catalytic power as the salt concentration increases from 5 mM to physiological levels of 100-150 mM (Fig. 1b, closed circles). To test whether placing the SRL within the natural cellular target, the ribosome, restores this lost catalytic potential, we conducted experiments using ribosomes from rat liver as a substrate. These ribosomes sedimented as a mixture of 80S particles and polysomes over a range of MgCl2 (0.1-2 mM) and KCl (10 mM-150 mM) concentrations, according to analytical ultracentrifugation (AUC) analysis (data not shown; see Methods). At 50 mM KCl and 1 mM MgCl2, restrictocin cleaves the SRL within ribosomes with a kcat/Km of (3 ± 1)× 107 M-1 s-1, more than 1,000-fold faster than it cleaves the SRL oligonucleotide under the same conditions (Fig. 2a,b). The increase in rate arises from a corresponding improvement in ribotoxin binding: ribosomes react with kcat = 1.1 ± 0.5 s-1 (Fig. 2c, plateau) and Km = 30 ± 10 nM (data not shown), whereas the SRL reacts with kcat = 1.4 ± 0.4 s-1 (Fig. 1b) and Km ∼100 μM (data not shown). Disruption of the ribosomes by phenol extraction of ribosomal proteins decreased the rate by 104-fold (Supplementary Fig. 4 online and data not shown), supporting the argument that perturbing ribosomal proteins, ribosomal structure or both contributes to this loss. These results indicate that the ribosomal context strongly enhances binding of the ribotoxin.
Figure 2.

Ribosomes as substrates for restrictocin. (a) Salt-rate profiles for restrictocin cleavage of ribosomes and the SRL in the presence of 1 mM MgCl2. Solid lines were obtained by fitting the data to equation (1) (Methods). Reactions contained <1 nM 32P 5′ end-labeled SRL or 10 nM ribosomes. The configuration of the ribosomal components was revealed by AUC (see Methods). The salt-rate profile reproducibly shows a sharp transition near 130 mM KCl. (b) Restrictocin shows a KCl-dependent preference for cleavage of ribosomes (Rb) over the SRL oligonucleotide. At physiologically relevant monovalent salt concentrations, restrictocin cleaves ribosomes ∼103-fold faster than it cleaves the SRL oligonucleotide. (c) Salt-rate profiles at different ribosome concentrations. Kinetic data for reactions containing 0.01-1 μM ribosomes were used to generate the three-dimensional plot.
To assess whether electrostatic interactions impart the additional energy for binding between restrictocin and the ribosome, we determined the salt dependence for restrictocin-mediated ribosome cleavage under subsaturating conditions. Because the ribosome-cleavage buffer contained 1 mM MgCl2 to stabilize 80S particles, we also determined the KCl profile for the SRL reaction in the presence of 1 mM MgCl2 to allow direct comparison between the ribosome and the SRL oligonucleotide. In the presence of 1 mM MgCl2, KCl still strongly inhibited the SRL cleavage reaction (Fig. 2a, open circles), but as expected for mixed-salt buffers20,21, the maximum cleavage rate (kobs/E0 = (5 ± 2) × 105 M-1 s-1, where kobs is the observed rate constant and E0 is the total enzyme concentration) and slope (n = -3.0 ± 0.2) decreased relative to the profile obtained in the absence of magnesium (kobs/E0 = (1 ± 0.2) × 108 M-1 s-1; n =-4.2 ± 0.3).
The ribosome reacts with a steeper dependence on KCl concentration than does the SRL oligonucleotide (n = -6.0 ± 0.4; Fig. 2a, colored circles). A sharp transition occurs near 130 mM KCl, possibly reflecting dissociation of the 80S species to give 60S and 40S subunits, as suggested by AUC (data not shown). The slope of -6 for the KCl dependence suggests that more electrostatic contacts form upon restrictocin binding to the ribosome than upon binding to the SRL RNA. These results support the argument that additional electrostatic interactions stabilize the restrictocin-ribosome complex relative to the restrictocin-SRL complex. To illustrate the apparent catalytic advantage for ribosome cleavage versus SRL oligonucleotide cleavage, we plotted kobs/E0 values for cleavage of ribosomes relative to SRL over a range of KCl concentrations (Fig. 2b). Between 50 and 140 mM KCl, restrictocin cleaves ribosomes ∼103-fold faster than SRL oligonucleotides, and this effect is entirely due to tighter binding, as the ribosome and SRL react with the same kcat values (1 s-1).
The ribosome concentration in vivo (1-10 μM)22,23 exceeds the Km for restrictocin-catalyzed cleavage by 30-to 300-fold (Km ∼ 30 nM; data not shown). We therefore determined the salt-rate profiles at various ribosome concentrations, including those greatly exceeding the Km values. As the ribosome concentration increases, the salt-rate profiles shift further along the KCl axis (Fig. 2c). This shift occurs because reactions containing elevated ribosome concentrations require higher salt concentrations to induce subsaturating conditions. The high in vivo concentration of ribosomes is therefore expected to offset salt inhibition at 100-150 mM KCl, allowing restrictocin to operate near its catalytic optimum inside cells (Fig. 2c, yellow box).
Distal basic residues contribute to ribosome targeting
To test directly whether the stronger binding of restrictocin to the ribosome results from electrostatic interactions distinct from those at the SRL interface, we constructed charge reversal mutations (lysine and arginine to aspartate) of three basic residues (Arg21, Lys28 and Lys63) that lie outside the restrictocin-SRL interface in the crystallographically determined structure9 (Fig. 3a). Residue 63 lies near this interface, whereas residues 21 and 28 reside on the opposite face. We investigated three restrictocin variants for comparison to the wild-type protein: the single mutant R63D, the double mutant R21D K28D and the triple mutant R21D K28D R63D (designated as 3/D). The three mutants cleave the SRL oligonucleotide with nearly the same rate as does wild-type restrictocin (Fig. 3b), indicating that the mutated residues make little energetic contribution to SRL binding. The triple mutant 3/D gives the same salt-rate profile for SRL cleavage as the wild-type ribotoxin, within error (n = -3.9 ± 0.1; Supplementary Fig. 5 online). These findings suggest that the mutated residues do not contribute to electrostatic interactions between the SRL and restrictocin, in accord with the cocrystal structure, where none of the three mutated residues contact the SRL9.
Figure 3.

Mutation of cationic surface residues of restrictocin mitigates the ribosome advantage over SRL. (a) Residues targeted for mutation are highlighted on the model of restrictocin docked onto the ribosome (see Methods). (b) Effect of restrictocin mutations on kcat/Km for SRL cleavage. Reactions contained 50 mM KCl, 1 mM MgCl2, <1 nM 32P 5′ end-labeled SRL and 1 μM of the indicated ribotoxin variant. Inset shows SRL (PDB entry 430D). (c) Effects of mutations on kcat/Km of ribosome cleavage. Reactions were as in b but contained 10 nM ribosomes and either wild-type restrictocin (1 nM) or a mutant restrictocin (5 nM R21D K28D, 10 nM K63D or 200 nM triple mutant 3/D). Inset shows the large (dark gray) and small (beige) subunits of the ribosome (PDB entries 2AW7, 2AWB). Error bars in b and c show s.d.
In contrast to SRL cleavage, the mutant ribotoxins cleave ribosomes with markedly decreased rates compared to wild-type ribotoxin (Fig. 3c). The single charge reversal on the front surface of the ribotoxin (K63D) reduced kcat/Km by a factor of 100 ± 30; the double charge reversal on the back surface (R21D K28D) reduced kcat/Km by a factor of 30 ± 3. The simultaneous reversal of the three charges (triple mutant 3/D) reduced kcat/Km by 2,000 ± 400-fold, such that ribosome cleavage and SRL oligonucleotide cleavage occurred with similar rates (Fig. 3b,c). As expected, the 2,000-fold reduction in kcat/Km for the triple mutant 3/D results from weakened binding (Km for the 3/D mutant increased by greater than 700-fold; Supplementary Fig. 5). The triple mutation also attenuates the slope of the salt-rate profile for ribosome cleavage (n = -2.2 versus n = -6 for wild-type protein; Supplementary Fig. 5). These basic surface residues of restrictocin, which have little or no effect on cleavage of the SRL oligonucleotide, contribute to the ribotoxin’s ability to bind and cleave ribosomes, supporting a role for electrostatics in proteinribosome recognition.
Maximal rate of ribosome inactivation by restrictocin
At low salt concentration, the binding affinity of restrictocin for the ribosome approaches the concentration of ribosomes in the reaction (10 nM). Under these condition, the salt-independent parameter kcat (rather than kcat/Km) governs the reaction kinetics, masking the lowsalt behavior of kcat/Km. To explore kcat/Km under low-salt conditions, we used subsaturating ribosome concentrations ( « 10 nM) throughout. As the ethidium staining protocol cannot detect ribosomes at such low concentrations, we developed a more sensitive assay that detects formation of the α-fragment (the 3′ product of SRL cleavage in 28S rRNA) by hybridization of a radiolabeled [32P]DNA probe complementary to nucleotides 4371-4399 of rat 28S rRNA (Fig. 4a).
Figure 4.

Monitoring restrictocin activity at dilute ribosome concentrations. (a) Detection of α-fragment cleavage product by hybridization of rRNA with 32P-radiolabeled DNA probe (see Methods). (b) 4% PAGE analysis of ribosome cleavage products, visualized by hybridization of the DNA probe. Reactions contained 10 pM ribosomes, 10 mM KCl, 4 pM restrictocin and MgCl2 as indicated. The quickly migrating species in the input is present in all ribosome preparations. (c) Apparent limit of kcat/Km depends on ribosome and magnesium concentrations. Inset graph shows the effect of Mg2+ on ribosome cleavage at 10 mM KCl. (d) Maximum second-order rate constant (kcat/Km) for cleavage of ribosomes by restrictocin. Values of kobs were plotted against restrictocin concentration; error bars show s.d. Analysis of the data using a least-squares fitting procedure gave kcat/Km = (1.7 ± 0.2) × 1010 M-1 s-1.
Using this alternative assay (Fig. 4b), we obtained the salt-rate profile for restrictocin reactions containing 10 pM ribosomes (Fig. 4c). In the high salt regime (>40 mM KCl), the new profile overlaps with that obtained from reactions containing 10 nM ribosomes, confirming the validity of the assay. However, because reactions at 10 pM ribosomes remain under kcat/Km conditions throughout the titration, the profiles diverge as the salt concentration decreases, revealing a new apparent maximum for kcat/Km of (2 ± 1) × 109 M-1 s-1(at 20 mM KCl and 1 mM MgCl2). Further improvement in kcat/Km occurs upon dilution of MgCl2 (Fig. 4c, inset). Analogous improvement happens in reactions with the SRL oligonucleotide: the salt-rate plateau in the absence of magnesium (Fig. 1b, filled circles) increases by ∼100-fold compared to that in the presence of 1 mM MgCl2 (Fig. 2a, open circles). At 0.1 mM MgCl2 (10 mM KCl), restrictocin induces formation of the α-fragment with a second-order rate constant of (1.7 ± 0.2) × 1010 M-1 s-1, one of largest kcat/Km values ever reported for an enzymatic reaction12 (Fig. 4d; see Discussion). Independent AUC experiments confirmed that, under these ionic conditions, the ribosomes remain in the native 80S configuration (data not shown). No additional increase in kcat/Km occurs upon further dilution of MgCl2 or ribosomes, suggesting that the value of (1.7 ± 0.2)× 1010 M-1 s-1 probably represents the physical limit imposed on the reaction rate by diffusion.
Ribosomes bind many restrictocin molecules at once
Linear Poisson-Boltzmann calculations of the electrostatic surface potential, for both the ribosome and the ribosomal subunits from archaeal sources24,25, assign negative potential to much of the ribosomal surface, including the region containing the SRL, with relatively few positively charged areas. In the crystal structure of the 50S ribosomal subunit, 23S rRNA and five proteins (L3, L6, L13, L14 and L24e) comprise the surface near the SRL (Fig. 5). Like most ribosomal proteins26, these proteins have bipolar character, with the majority of basic residues buried inside the ribosome and acidic residues exposed to solvent. Many of these acidic residues are conserved among bacterial, archaeal and eukaryotic ribosomes (sequence alignments of ribosomal proteins across the species not shown; bacteria contain no counterpart to L24e), implying that the electrostatic properties of the ribosomal surface may be important for function.
Figure 5.
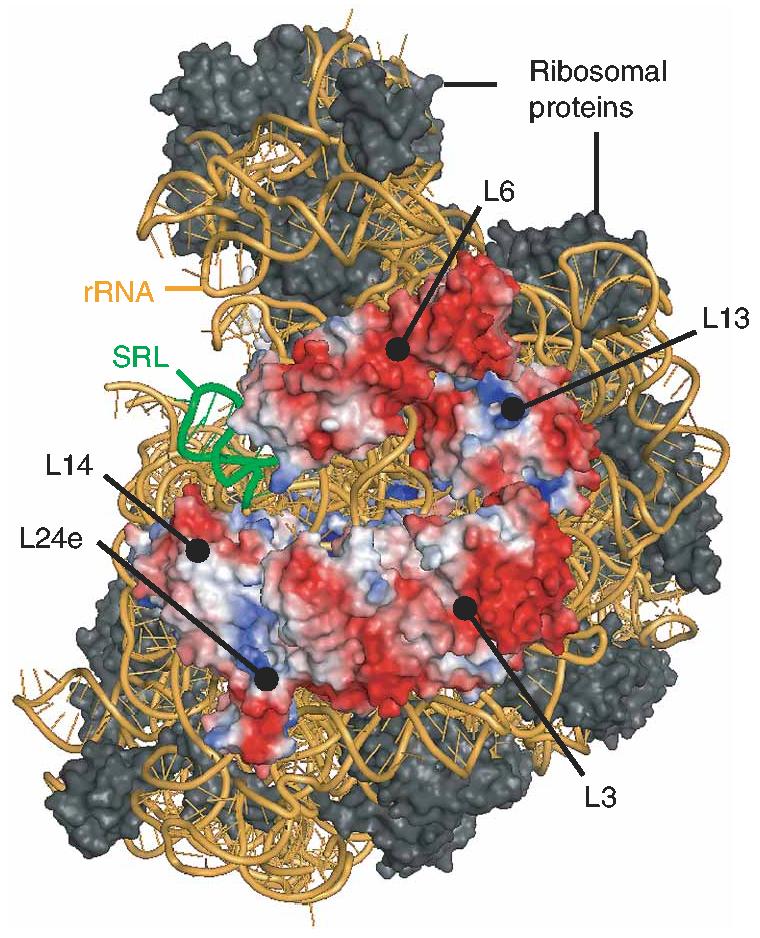
Side view of the 2.4Å crystal structure of the large ribosomal subunit41,42. Ribosomal proteins L3, L6, L13, L14 and L24e are colored by electrostatic potential (see Methods: red, negative; blue, positive).
To test this view of the ribosomal surface potential, we assessed whether restrictocin binds multiple sites on the ribosome. We determined the stoichiometry of binding by monitoring restrictocincatalyzed cleavage of the radiolabeled SRL oligonucleotide in the presence of ribosomes. Reaction of the SRL oligonucleotide under subsaturating (kcat/Km) conditions provides a sensitive measure of the free restrictocin concentration (Fig. 6a, open circles). Restrictocin binding by the ribosome decreases the concentration of free ribotoxin, thereby reducing the rate of SRL oligonucleotide cleavage. At low restrictocin concentrations ( <5 nM), 10 nM ribosomes inhibited the rate of SRL oligonucleotide cleavage by 100-to 200-fold, suggesting that the ribosomes bind greater than 99% of the restrictocin molecules. The reaction shows a modest dependence on restrictocin until the ribotoxin concentration approaches 400 nM, where the dependence acquires a strong linear sensitivity (Fig. 6a, filled circles). We obtained an analogous profile with 5 nM ribosomes, except that reactions acquired strong linear sensitivity at lower restrictocin concentrations (about 200 nM; Fig. 6a, diamonds). These observations suggest that ribosomes sequester free restrictocin until available binding sites become saturated.
Figure 6.
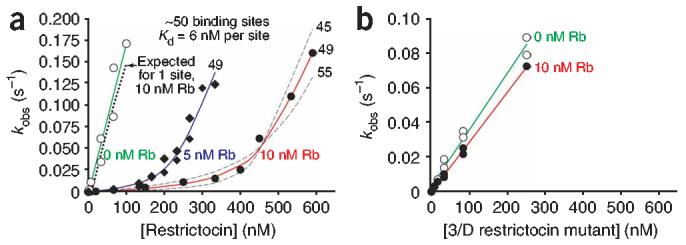
Titration of the restrictocin-binding sites on the ribosomal surface. (a) Restrictocin cleavage of the 32P-radiolabled SRL RNA in the absence and in the presence of ribosomes (Rb). Reactions contained 10 mM KCl, 0.3 mM MgCl2 and <1 nM [32P]SRL. Analysis of the experimental data using Gepasi38 (solid lines) suggests that a single ribosome binds 49 ± 3 molecules of restrictocin (see Methods). Dashed lines indicate a ∼10% deviation in the fitting. (b) Ribosomes have no effect on cleavage of the SRL oligonucleotide by the 3/D mutant of restrictocin. Conditions were as in a.
To verify that the titration profile reflects restrictocin binding to the ribosome, we performed the same experiment using the triple mutant of restrictocin, 3/D. As described above, this mutant cleaves the SRL oligonucleotide with nearly the same rate as wild-type restrictocin but binds ribosomes much more weakly. Ribosomes had essentially no effect on the rate of SRL oligonucleotide cleavage by the 3/D mutant (Fig. 6b), demonstrating that the inhibitory effect in the reaction with wild-type restrictocin reflects restrictocin binding to the ribosome.
Binding of one restrictocin to one ribosome cannot account for the data in Figure 6a (dotted line), as the concentration of restrictocin required to restore SRL cleavage greatly exceeds the concentration of ribosomes. We analyzed the data according to a model in which the ribosome contains k restrictocin-binding sites that competitively inhibit restrictocin-catalyzed cleavage of the SRL oligonucleotide. Fitting the titration profiles in Figure 6a to this model (see Methods) gives k = 49 ± 3. Data from analogous experiments containing different concentrations of ribosomes, KCl and magnesium (ribosome integrity under all conditions was checked by AUC) quantitatively supports this conclusion (see Methods). The large number of binding sites on the ribosome for restrictocin but not for the triple mutant 3/D suggests that restrictocin binds nonspecifically to much of the ribosomal surface via electrostatic interactions. These observations agree with the global view of the ribosomal surface potential derived from linear Poisson-Boltzmann calculations24,25 and have implications for ribotoxin function.
DISCUSSION
Characterization of the site-specific, endonucleolytic cleavage of the SRL RNA by restrictocin has revealed the hallmark signatures of electrostatic interactions. These interactions govern the nonspecific association between the positively charged ribotoxin and the negatively charged SRL RNA. Specific recognition of the SRL structure occurs only after binding, during conversion of the binary complex to products. Understanding how the SRL structure promotes transition state stabilization remains an important future challenge.
The binary restrictocin-ribosome complex reacts with the same first-order rate constant (kcat) as does the restrictocin-SRL oligonucleotide complex, but the electrostatic signatures are augmented. Restrictocin binds the ribosome with a significantly greater inverse salt dependence than that for SRL oligonucleotide binding (Fig. 2), indicating additional electrostatic interactions with the ribosome. Mutagenesis of basic restrictocin residues (Fig. 3) directly supports this view. These additional electrostatic interactions allow the ribotoxin to bind more strongly to the ribosome than to the SRL oligonucleotide or other RNA oligonucleotides, thereby enhancing the specificity of restrictocin for the ribosome. Additional specificity could emanate from binding to the ribosomal surface at multiple sites, as this would enhance the ribotoxin’s association constant.
The catalytic advantage created by the ribosomal surface has implications for ribotoxin function in vivo. Under approximately physiological conditions, restrictocin binds weakly to free RNA oligonucleotides. We estimate that RNA oligonucleotides bind with a Kd of ∼1 mM (at 100 mM KCl and 1 mM MgCl2), a value well above the concentration of free RNA in the cytoplasm. In contrast, restrictocin binds the ribosome with an affinity that is below the ribosomal cytoplasmic concentration of 1-10 μM, suggesting that, in vivo, the ribotoxin operates under saturating (kcat) conditions, cleaving 1-2 ribosomes per second (Fig. 2c, plateau).
Rapid target location by restrictocin
Under the low-salt regime (10 mM KCl and 0.1-0.3 mM MgCl2), restrictocin catalyzes cleavage of ribosomes with a maximum secondorder rate constant of 1.7 × 10¹⁰ M-1 s-1, an unusually large value for an enzymatic reaction. This rate coincides with the theoretical prediction from the Smoluchowski equation, which predicts that diffusion-controlled encounters between restrictocin and the ribosome occur with a frequency of 2.4 × 10¹⁰ M-1 s-1 at 37 °C (data not shown). Macromolecules often associate four to five orders of magnitude slower than the predicted encounter rate because energy barriers and stringent orientational constraints accompany binding10,27,28. Favorable electrostatic interactions provide the only known mechanism to allow macromolecules to bind at rates approaching their encounter frequency27,28. The similarity of the calculated encounter frequency and the observed kcat/Km value for restrictocin-catalyzed ribosome cleavage suggests that electrostatic interactions between restrictocin and the ribosome facilitate association, in agreement with the effects of salt and of charge-reducing mutations described above.
Mechanisms of rapid target location
Electrostatic interactions can engender unexpectedly fast macromolecular association rates by at least three distinct mechanisms, which may operate together: (i) a steering mechanism, in which electrostatic interactions would serve to orient the ribotoxin during its approach to the ribosome for productive association and catalysis28,29; (ii) a mechanism in which the particles interact electrostatically at a distance that exceeds the sum of their physical radii, thereby increasing the effective cross-section for bimolecular encounter30; and (iii) a two-dimensional diffusion mechanism, in which the ribotoxin encounters the ribosome at a random site and diffuses over the ribosomal surface via electrostatically assisted long-lived re-encounters30. These mechanisms could accelerate target location by orienting restrictocin and by reducing the volume through which the ribotoxin must search. The observation that as many as 50 restrictocin molecules (but not the triple restrictocin mutant 3/D) can bind simultaneously to the ribosome establishes two important prerequisites for the two-dimensional diffusion mechanism. First, negative electrostatic potential permeates much of the ribosomal surface, and second, the ribotoxin can bind nonspecifically via electrostatic interactions to multiple sites on the ribosome.
The role of electrostatics in protein-ribosome recognition emerges from this work. Previous studies of ribotoxins and basic peptides have suggested that the positive charge on the protein surface promotes cellular uptake31,32. Our data reveal another role for the positive charge on the ribotoxin surface: enhancement of ribosome targeting via electrostatic interactions. Our observations show how ribotoxins, and perhaps other proteins and cytoplasmic components, can exploit the electrostatic surface of the ribosome to achieve binding specificity and speed in locating their ribosomal targets.
METHODS
Estimation of errors.
All kinetic parameters were determined multiple times, with s.d. reported. Some parameters, including kcat/Km for SRL and its salt dependence, were measured more than five times.
Ribotoxins and substrates.
Restrictocin and α-sarcin were gifts from I.G. Wool (University of Chicago). Restrictocin mutants were prepared as described below. RNA substrates were synthesized by Dharmacon RNA Technologies or in our laboratory (Supplementary Table 2). The wild-type SRL substrate, 5′-CCUGCUCAGUACGAGAGGAACCGCAGG-3′, reproduces the nucleotides at positions 4311-4337 of 28S rRNA from Rattus norvegicus. To obtain substrates of varying lengths, a series of deletion constructs was synthesized with successive removal of 5′-and 3′-terminal nucleotides. To avoid sequence self-complementarity and secondary structure, the sequences of the ssRNA and ssDNA oligonucleotides were designed with the RNA structure 3.71 (ref. 33). All guanosines in the RNA sequence were equally accessible to cleavage by RNase T1, confirming a single-stranded conformation. A control experiment showed that RNase T1 did not cleave the base-paired RNA substrate under similar conditions. After nondenaturing PAGE purification, the SRL substrates reacted in ribotoxin assays with single-exponential kinetics, reaching >80% completion. Other RNA substrates were PAGE-purified and reacted to >95% completion.
Preparation of eukaryotic ribosomes from rat liver.
Ribosomes from rat liver were prepared as previously described34 and stored at -80 °C. Ribosome concentration was determined by measuring OD260 of phenol-extracted total rRNA and of ribosomes (ε260 = 4.3× 10⁷ M-1 cm-1)35. AUC of ribosome samples in velocity mode was performed using a Beckman XL-A ultracentrifuge. This method directly measures the distribution of ribosomal particles according to their sedimentation coefficient in the reaction buffer at 37 °C, circumventing complications from long processing times and unknown concentrations of ribosomes in gradient-centrifugation techniques. High quality sedimentograms with nanomolar ribosome concentrations were obtained (data not shown). The velocity data was analyzed with UltraScan 6.0 (ref. 36) and with Sedfit37.
Expression and purification of restrictocin mutants.
The K63D mutant and R21D K28D double mutant of restrictocin were made with a QuikChange kit (Stratagene) using wild-type pREST as the template; the R21D K28D K63D triple mutant was made using the double mutant as the template. The identity of each mutant plasmid was confirmed by DNA sequencing (University of Chicago DNA-sequencing Facility). Expressed proteins were purified on a C-25 SP ion-exchange column (Pharmacia) at pH 5.5 (4 °C). Protein concentrations were determined by measuring OD260 (ε260calc = 26,030 M-1 cm-1) in 6 M guanidinium hydrochloride, 0.02 M phosphate buffer (pH 6.5). Each purified mutant migrated as a single intense band on SDS-PAGE (shown by Coomassie blue staining).
General kinetic methods.
Radiolabeled oligonucleotides were prepared using standard protocols and reaction temperature was 37 °C throughout. Cleavage reactions with restrictocin and α-sarcin were carried out in FTX buffer (10 mM Tris-HCl and 0.05% (v/v) Triton-X-100 (pH 7.4)) containing 0-300 mM KCl. Before reaction, 3 μl of enzyme solution in buffer containing 50 mM Tris-HCl and 0.25% (v/v) Triton X-100 was added to 10.5 μl of sterile H2O and preincubated at 37 °C for 5 min. Reactions were initiated by rapid addition and mixing of 1.5 μl of 32P 5′ end-labeled RNA substrates. Aliquots of the reaction mixtures were withdrawn at different time intervals and placed in quench solution (10 M urea, 0.7% (w/v) SDS, 50 mM EDTA, 0.02% (w/v) xylene cyanol and 0.02% (w/v) bromophenol blue). Reaction products were separated by 20% (w/v) PAGE, the radioactivity was quantified on a PhosphorImager (Molecular Dynamics), and the resulting data were analyzed using SigmaPlot 6.0 (SPSS).
Cleavage of ribosomes was performed in FTX buffer containing 0.003-2 mM MgCl2 and 10-200 mM KCl. Reaction volumes were adjusted between 5 μl and 1,000 μl, depending on the ribosome concentration used, to allow visualization of the rRNA and α-fragment. Aliquots of the reaction mixture were placed into excess stop solution containing 0.3 M sodium acetate, 1% (w/v) SDS and 50 mg l-1 heparin. Total rRNA was obtained by subsequent phenol extraction and ethanol precipitation and analyzed on a 1.5% (w/v) agarose gel. The α-fragment (393 nt) formed upon cleavage of ribosomes by the ribotoxin (Supplementary Fig. 4) was quantified with ImageJ (http://rsb.info.nih.gov/ij/) using either 5.8S or 18S rRNA as internal standards.
We derived the following equation to fit the salt dependence of the cleavage rate (V), which is similar to an equation used in ref. 15 for studies of ribonuclease A:
| (1) |
where k2 is the single-turnover catalytic constant, K½ is the ribotoxin-RNA binding constant measured in the salt-independent region (below ∼5 mM KCl), KKCl is the apparent constant for binding of KCl to RNA and restrictocin, n is the slope of the salt dependence, S0 is the total concentration of substrate and E0 is the total concentration of enzyme. Equation (1) assumes that n moleequivalents of K+ and Cl- bind as competitive inhibitors to free S and E, respectively, and are released into solution upon formation of the E •S complex.
Titration of restrictocin-binding sites on the ribosome.
32P-radiolabeled SRL (1.5 μl) was added to 13.5 μl of FTX buffer containing 10 mM KCl, 0.3 mM MgCl2, 5 or 10 nM ribosomes and 0.001-7 μM restrictocin. Data were collected at time points during 1-to 5-min time courses, the data were fit to first-order kinetics models using SigmaPlot and the obtained rate constants were analyzed using Gepasi38 to obtain the concentration of the restrictocin-binding sites created by the ribosome in solution. Experiments were repeated at higher salt concentrations (either 20 mM KCl, 0.3 mM MgCl2 and 10 nM ribosomes or 30 mM KCl, 1 mM MgCl2 and 30 nM ribosomes). The ribotoxin binding affinity for the ribosome (Km) decreased by 3- or 30-fold, respectively, as expected, but the number of binding sites (∼49 ± 3) remained unchanged.
Structure analysis and electrostatic calculations.
Figures of molecules were generated with Ribbons39, SwissPDB40, POV-Ray (http://www.povray.org/) and PyMOL (http://pymol.sourceforge.net/). Electrostatic potentials were calculated in PyMOL using the vacuum electrostatics method. The surface area buried in the ribosome upon restrictocin binding was estimated by superimposing the SRL from the 50S subunit structure (PDB entry 1JJ2)41,42 onto the SRL from the restrictocin-SRL cocrystal structure (PDB entry 1JBS)9. The solvent-accessible surface area of the ribosome was estimated using either the hydrodynamic radius43 or the ribosome size from the cryo-EM structure44.
Supplementary Material
ACKNOWLEDGMENTS
We are grateful to Y.-L. Chan for valuable advice and discussion, J. Olvera for excellent technical assistance and M. Yousef for the help at the Biophysical Core Facility at the University of Chicago. We thank I.G. Wool, P.B. Moore and members of the Piccirilli laboratory for helpful comments on the manuscript. This work was supported by grants from the Burroughs Wellcome Fund to A.V.K., from the Howard Hughes Medical Institute to J.A.P. and from the US National Institutes of Health (GM59782) to C.C.C.
Footnotes
COMPETING INTERESTS STATEMENT
The authors declare that they have no competing financial interests.
References
- 1.Jennings JC, Olson BH, Roga V, Junek AJ, Schuurmans DM. Alpha sarcin, a new antitumor agent. II. Fermentation and antitumor spectrum. Appl. Microbiol. 1965;13:322–326. doi: 10.1128/am.13.3.322-326.1965. [DOI] [PMC free article] [PubMed] [Google Scholar]
- 2.Turnay J, Olmo N, Jimenez A, Lizarbe MA, Gavilanes JG. Kinetic study of the cytotoxic effect of alpha-sarcin, a ribosome inactivating protein from Aspergillus giganteus, on tumour cell lines: protein biosynthesis inhibition and cell binding. Mol. Cell. Biochem. 1993;122:39–47. doi: 10.1007/BF00925735. [DOI] [PubMed] [Google Scholar]
- 3.Wool IG. In: Structure and mechanism of action of the cytotoxic ribonuclease α-sarcin. in Ribonucleases: Structures and Functions. D’Alesio G, Riordan JF, editors. Academic Press; New York: 1997. pp. 131–162. [Google Scholar]
- 4.Olmo N, et al. Cytotoxic mechanism of the ribotoxin alpha-sarcin: induction of cell death via apoptosis. Eur. J. Biochem. 2001;268:2113–2123. doi: 10.1046/j.1432-1327.2001.02086.x. [DOI] [PubMed] [Google Scholar]
- 5.Martinez-Ruiz A, Kao R, Davies J, Martinez del Pozo A. Ribotoxins are a more widespread group of proteins within the filamentous fungi than previously believed. Toxicon. 1999;37:1549–1563. doi: 10.1016/s0041-0101(99)00103-8. [DOI] [PubMed] [Google Scholar]
- 6.Yang X, Moffat K. Insights into specificity of cleavage and mechanism of cell entry from the crystal structure of the highly specific Aspergillus ribotoxin, restrictocin. Structure. 1996;4:837–852. doi: 10.1016/s0969-2126(96)00090-1. [DOI] [PubMed] [Google Scholar]
- 7.Lacadena J, et al. Role of histidine-50, glutamic acid-96, and histidine-137 in the ribonucleolytic mechanism of the ribotoxin alpha-sarcin. Proteins. 1999;37:474–484. doi: 10.1002/(sici)1097-0134(19991115)37:3<474::aid-prot14>3.0.co;2-n. [DOI] [PubMed] [Google Scholar]
- 8.Gluck A, Wool IG. Determination of the 28 S ribosomal RNA identity element (G4319) for alpha-sarcin and the relationship of recognition to the selection of the catalytic site. J. Mol. Biol. 1996;256:838–848. doi: 10.1006/jmbi.1996.0130. [DOI] [PubMed] [Google Scholar]
- 9.Yang X, Gerczei T, Glover L, Correll CC. Crystal structures of restrictocin-inhibitor complexes with implications for RNA recognition and base flipping. Nat. Struct. Biol. 2001;8:968–973. doi: 10.1038/nsb1101-968. [DOI] [PubMed] [Google Scholar]
- 10.Northrup SH, Erickson HP. Kinetics of protein-protein association explained by Brownian dynamics computer simulation. Proc. Natl. Acad. Sci. USA. 1992;89:3338–3342. doi: 10.1073/pnas.89.8.3338. [DOI] [PMC free article] [PubMed] [Google Scholar]
- 11.Stroppolo ME, et al. Single mutation at the intersubunit interface confers extra efficiency to Cu, Zn superoxide dismutase. FEBS Lett. 2000;483:17–20. doi: 10.1016/s0014-5793(00)01967-0. [DOI] [PubMed] [Google Scholar]
- 12.Stroppolo ME, Falconi M, Caccuri AM, Desideri A. Superefficient enzymes. Cell. Mol. Life Sci. 2001;58:1451–1460. doi: 10.1007/PL00000788. [DOI] [PMC free article] [PubMed] [Google Scholar]
- 13.Gluck A, Endo Y, Wool IG. The ribosomal RNA identity elements for ricin and for alpha-sarcin: mutations in the putative CG pair that closes a GAGA tetraloop. Nucleic Acids Res. 1994;22:321–324. doi: 10.1093/nar/22.3.321. [DOI] [PMC free article] [PubMed] [Google Scholar]
- 14.Macbeth MR, Wool IG. Characterization of in vitro and in vivo mutations in non-conserved nucleotides in the ribosomal RNA recognition domain for the ribotoxins ricin and sarcin and the translation elongation factors. J. Mol. Biol. 1999;285:567–580. doi: 10.1006/jmbi.1998.2337. [DOI] [PubMed] [Google Scholar]
- 15.Park C, Raines RT. Quantitative analysis of the effect of salt concentration on enzymatic catalysis. J. Am. Chem. Soc. 2001;123:11472–11479. doi: 10.1021/ja0164834. [DOI] [PubMed] [Google Scholar]
- 16.Day-Storms JJ, Niranjanakumari S, Fierke CA. Ionic interactions between PRNA and P protein in Bacillus subtilis RNase P characterized using a magnetocapture-based assay. RNA. 2004;10:1595–1608. doi: 10.1261/rna.7550104. [DOI] [PMC free article] [PubMed] [Google Scholar]
- 17.Hall KB, Stump WT. Interaction of N-terminal domain of U1A protein with an RNA stem/loop. Nucleic Acids Res. 1992;20:4283–4290. doi: 10.1093/nar/20.16.4283. [DOI] [PMC free article] [PubMed] [Google Scholar]
- 18.Saecker RM, Record MT., Jr. Protein surface salt bridges and paths for DNA wrapping. Curr. Opin. Struct. Biol. 2002;12:311–319. doi: 10.1016/s0959-440x(02)00326-3. [DOI] [PubMed] [Google Scholar]
- 19.Record MT, Jr., Zhang W, Anderson CF. Analysis of effects of salts and uncharged solutes on protein and nucleic acid equilibria and processes: a practical guide to recognizing and interpreting polyelectrolyte effects, Hofmeister effects, and osmotic effects of salts. Adv. Protein Chem. 1998;51:281–353. doi: 10.1016/s0065-3233(08)60655-5. [DOI] [PubMed] [Google Scholar]
- 20.Record MT, Jr., deHaseth PL, Lohman TM. Interpretation of monovalent and divalent cation effects on the lac repressor-operator interaction. Biochemistry. 1977;16:4791–4796. doi: 10.1021/bi00641a005. [DOI] [PubMed] [Google Scholar]
- 21.Chen S.-w.W., Honig B. Monovalent and divalent salt effects on electrostatic free energies defined by the nonlinear poisson-Boltzmann equation: application to DNA binding reactions. J. Phys. Chem. B. 1997;101:9113–9118. [Google Scholar]
- 22.Dong H, Nilsson L, Kurland CG. Co-variation of tRNA abundance and codon usage in Escherichia coli at different growth rates. J. Mol. Biol. 1996;260:649–663. doi: 10.1006/jmbi.1996.0428. [DOI] [PubMed] [Google Scholar]
- 23.Porse BT, Leviev I, Mankin AS, Garrett RA. The antibiotic thiostrepton inhibits a functional transition within protein L11 at the ribosomal GTPase centre. J. Mol. Biol. 1998;276:391–404. doi: 10.1006/jmbi.1997.1541. [DOI] [PubMed] [Google Scholar]
- 24.Trylska J, Konecny R, Tama F, Brooks CL, III, McCammon JA. Ribosome motions modulate electrostatic properties. Biopolymers. 2004;74:423–431. doi: 10.1002/bip.20093. [DOI] [PubMed] [Google Scholar]
- 25.Baker NA, Sept D, Joseph S, Holst MJ, McCammon JA. Electrostatics of nanosystems: application to microtubules and the ribosome. Proc. Natl. Acad. Sci. USA. 2001;98:10037–10041. doi: 10.1073/pnas.181342398. [DOI] [PMC free article] [PubMed] [Google Scholar]
- 26.Moore PB, Steitz TA. The structural basis of large ribosomal subunit function. Annu. Rev. Biochem. 2003;72:813–850. doi: 10.1146/annurev.biochem.72.110601.135450. [DOI] [PubMed] [Google Scholar]
- 27.Selzer T, Schreiber G. Predicting the rate enhancement of protein complex formation from the electrostatic energy of interaction. J. Mol. Biol. 1999;287:409–419. doi: 10.1006/jmbi.1999.2615. [DOI] [PubMed] [Google Scholar]
- 28.Selzer T, Albeck S, Schreiber G. Rational design of faster associating and tighter binding protein complexes. Nat. Struct. Biol. 2000;7:537–541. doi: 10.1038/76744. [DOI] [PubMed] [Google Scholar]
- 29.Hemsath L, Dvorsky R, Fiegen D, Carlier MF, Ahmadian MR. An electrostatic steering mechanism of Cdc42 recognition by Wiskott-Aldrich syndrome proteins. Mol. Cell. 2005;20:313–324. doi: 10.1016/j.molcel.2005.08.036. [DOI] [PubMed] [Google Scholar]
- 30.von Hippel PH, Berg OG. Facilitated target location in biological systems. J. Biol. Chem. 1989;264:675–678. [PubMed] [Google Scholar]
- 31.Futami J, et al. Optimum modification for the highest cytotoxicity of cationized ribonuclease. J. Biochem. 2002;132:223–228. doi: 10.1093/oxfordjournals.jbchem.a003214. [DOI] [PubMed] [Google Scholar]
- 32.Vives E, Richard JP, Rispal C, Lebleu B. TAT peptide internalization: seeking the mechanism of entry. Curr. Protein Pept. Sci. 2003;4:125–132. doi: 10.2174/1389203033487306. [DOI] [PubMed] [Google Scholar]
- 33.Mathews DH, Sabina J, Zuker M, Turner DH. Expanded sequence dependence of thermodynamic parameters improves prediction of RNA secondary structure. J. Mol. Biol. 1999;288:911–940. doi: 10.1006/jmbi.1999.2700. [DOI] [PubMed] [Google Scholar]
- 34.Spedding G. Isolation and analysis of ribosomes from prokaryotes, eukaryotes, and organelles. In: Speddings G, editor. Ribosomes and Protein Synthesis—A Practical Approach. Oxford University Press; New York: 1990. pp. 1–29. [Google Scholar]
- 35.Endo Y, Huber PW, Wool IG. The ribonuclease activity of the cytotoxin alpha-sarcin. The characteristics of the enzymatic activity of alpha-sarcin with ribosomes and ribonucleic acids as substrates. J. Biol. Chem. 1983;258:2662–2667. [PubMed] [Google Scholar]
- 36.Demeler B. UltraScan: a comprehensive data analysis software package for analytical ultracentrifugation experiments. In: Scott D, Harding SE, Rowe AJ, editors. Modern Analytical Ultracentrifugation: Techniques and Methods. Royal Society of Chemistry; Cambridge: 2005. pp. 210–229. [Google Scholar]
- 37.Schuck P. Size-distribution analysis of macromolecules by sedimentation velocity ultracentrifugation and lamm equation modeling. Biophys. J. 2000;78:1606–1619. doi: 10.1016/S0006-3495(00)76713-0. [DOI] [PMC free article] [PubMed] [Google Scholar]
- 38.Mendes P, Kell D. Non-linear optimization of biochemical pathways: applications to metabolic engineering and parameter estimation. Bioinformatics. 1998;14:869–883. doi: 10.1093/bioinformatics/14.10.869. [DOI] [PubMed] [Google Scholar]
- 39.Carson M. Ribbons. Methods Enzymol. 1991;277:493–505. [PubMed] [Google Scholar]
- 40.Guex N, Peitsch MC. SWISS-MODEL and the Swiss-PdbViewer: an environment for comparative protein modeling. Electrophoresis. 1997;18:2714–2723. doi: 10.1002/elps.1150181505. [DOI] [PubMed] [Google Scholar]
- 41.Ban N, Nissen P, Hansen J, Moore PB, Steitz TA. The complete atomic structure of the large ribosomal subunit at 2.4Å resolution. Science. 2000;289:905–920. doi: 10.1126/science.289.5481.905. [DOI] [PubMed] [Google Scholar]
- 42.Klein DJ, Schmeing TM, Moore PB, Steitz TA. The kink-turn: a new RNA secondary structure motif. EMBO J. 2001;20:4214–4221. doi: 10.1093/emboj/20.15.4214. [DOI] [PMC free article] [PubMed] [Google Scholar]
- 43.Patel VB, Cunningham CC, Hantgan RR. Physiochemical properties of rat liver mitochondrial ribosomes. J. Biol. Chem. 2001;276:6739–6746. doi: 10.1074/jbc.M005781200. [DOI] [PubMed] [Google Scholar]
- 44.Dube P, et al. The 80S rat liver ribosome at 25Å resolution by electron cryomicroscopy and angular reconstitution. Structure. 1998;6:389–399. doi: 10.1016/s0969-2126(98)00040-9. [DOI] [PubMed] [Google Scholar]
Associated Data
This section collects any data citations, data availability statements, or supplementary materials included in this article.