Abstract
The integration of modern data acquisition and digital signal processing (DSP) technologies with Fourier transform electron paramagnetic resonance (FT-EPR) imaging at radiofrequencies (RF) is described. The FT-EPR system operates at a Larmor frequency (Lf) of 300 MHz to facilitate in vivo studies. This relatively low frequency Lf, in conjunction with our ~10 MHz signal bandwidth, enables the use of direct free induction decay time-locked subsampling (TLSS). This particular technique provides advantages by eliminating the traditional analog intermediate frequency downconversion stage along with the corresponding noise sources. TLSS also results in manageable sample rates that facilitate the design of DSP-based data acquisition and image processing platforms. More specifically, we utilize a high-speed field programmable gate array (FPGA) and a DSP processor to perform advanced real-time signal and image processing. The migration to a DSP-based configuration offers the benefits of improved EPR system performance, as well as increased adaptability to various EPR system configurations (i.e., software configurable systems instead of hardware reconfigurations). The required modifications to the FT-EPR system design are described, with focus on the addition of DSP technologies including the application-specific hardware, software, and firmware developed for the FPGA and DSP processor. The first results of using real-time DSP technologies in conjunction with direct detection bandpass sampling to implement EPR imaging at RF frequencies are presented.
Keywords: EPR, TLSS, Fourier transform, DSP, FPGA, Digital signal processing
1. Introduction
We are developing both continuous wave (CW) and pulsed EPR imaging spectrometers for functional imaging of small animals [1]. With the availability of narrow-line, non-toxic spin probes which are suitable for EPR imaging, we have developed novel, in vivo non-invasive oximetric methods based on the oxygen-dependent linewidth and relaxation time, , of the paramagnetic spin probes [2–7]. In the small-animal Fourier transform electron paramagnetic resonance (FT-EPR) imaging spectrometer, we use radiofrequency (RF) pulses of ~50 ns duration at a nominal peak transmit power of 80 W. These pulses are applied at a frequency of 50 kHz (every 20 μs), corresponding to a duty cycle of 1/400. We are in the process of exploring the advantages of integrating modern digital signal processing (DSP) methods, algorithms, and hardware into the design of our custom CW and pulsed EPR imaging systems. The data acquisition system utilizes a relatively low sampling rate, yet high analog input bandwidth (i.e., many times higher than the maximum sampling rate) analog-to-digital converter (ADC) developed for bandpass sampling applications. Equally important, the relatively low sampling rate of the ADC facilitates the integration of DSP technologies, namely field programmable gate array (FPGA) and DSP hardware, to develop advanced real-time imaging systems. Consequently, we have developed an FT-EPR system which directly utilizes bandpass sampling techniques, as opposed to sampling at rates (e.g., >1 GS/s) to sample the RF signal, while still meeting the Nyquist criteria for the free induction decay (FID) signal.
1.1. Subsampling
Bandpass sampling can be used in a variety of applications over a broad range of disciplines. Earlier implementations of quadrature bandpass sampling (e.g., time-locked subsampling (TLSS)) EPR were carried out by Hyde et al. [8–10]. TLSS is a technique that has roots in communications theory [11,12]. In this special case of bandpass sampling (i.e., TLSS), the frequency of the sampled signal is effectively shifted down to quadrature baseband (see Fig. 1) when the following requirements are met [13].
Fig. 1.
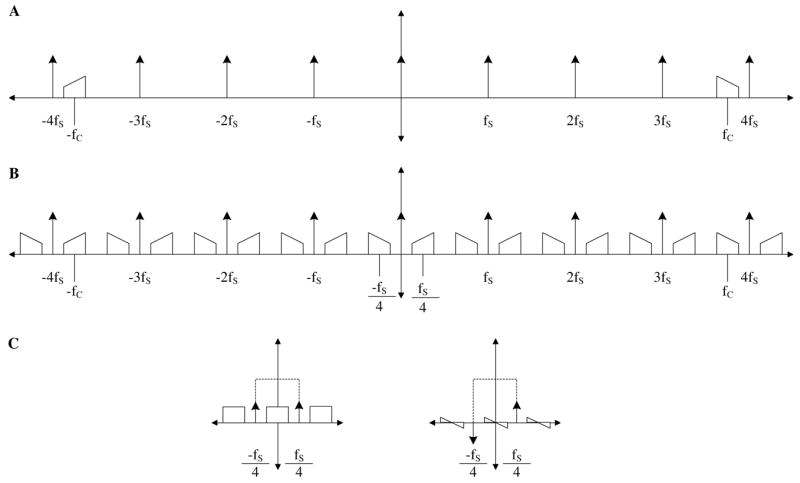
Bandpass sampling depicted with (A) the original band-limited signal and the sampling clock, fs, in the frequency domain, (B) the result of sampling the original signal with sampling clock, fs, and (C) the result of digital downconverting the sampled signal via a quadrature sinusoidal centered at fs/4 with the desired signals (I and Q) identified within the square window.
| (1) |
where fc is the center frequency, fBW is the bandwidth of signal, and fs is the sampling frequency.
Since our applications are focused on in vivo studies (i.e., low frequency EPR), we are able to use the current state of ADC technology to perform direct TLSS of the RF FID signal [14,15]. This eliminates the need for analog hardware that has been traditionally used to shift the FID signal down to an intermediate frequency (IF), or to quadrature baseband, before signal acquisition. In specific, our 300 MHz centered FID signal is directly (i.e., no IF stage) sampled at a rate of 80 MS/s.
For in vivo imaging of small animals (e.g., mice), the current FT-EPR system has an imaging bandwidth of ~20 MHz. Bandpass sampling the 300 MHz carrier with fs = 80 MHz provides a signal acquisition system bandwidth of 20 MHz (Eq. (1)). Therefore, the overall system bandwidth is more than adequate for our ~10 MHz 3-dB bandwidth FID signal. The actual FID signal bandwidth is a result of the physical size of the test sample and the gradient magnitude.
2. Materials and methods
Direct FID TLSS (i.e., quadrature bandpass sampling) was accomplished by replacing several EPR system hardware components, integrating new data acquisition and DSP hardware, developing custom FPGA and DSP processor code, and developing application-specific software for a laboratory computer (see Fig. 2). The acquisition and DSP system is compatible with various system RF excitation schemes (i.e., coherent averaging or stochastic excitation).
Fig. 2.
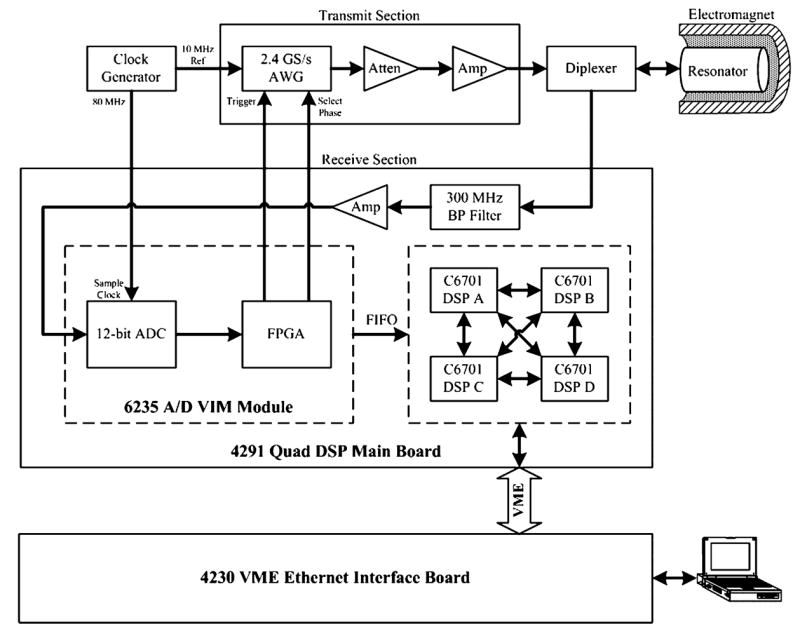
Block diagram of the 300 MHz RF FT-EPR system.
The new hardware eliminates or reduces many common noise sources, such as those found in the IF mixer stage in single channel systems and the quadrature baseband mixer stage in dual channel systems. More specifically, this hardware helps to avoid gain mismatches, phase errors, and non-linearities associated with the corresponding analog components, while minimizing susceptibility to ambient noise sources.
2.1. Transmit section hardware configuration
An existing 300 MHz FT-EPR spectrometer [7,15,16] was modified for these experiments. The current system configuration simplifies past transmit section designs by replacing most of the previous analog hardware with an AWG610 arbitrary waveform generator (AWG) (Tektronix, Richardson, TX). The AWG is programmed to digitally generate a pair of 300 MHz RF pulse waveforms that are 180° out-of-phases. These waveforms are synthesized at a rate of 2.4 GS/s, and the pulse width and shape can be easily adjusted to control the frequency content of the RF excitation as required for different applications. Use of the AWG is an improvement over our previous methods which utilized a signal source, phase shifter, and RF switches to generate the 180° out-of-phase RF pulses. Omitting these traditional analog RF components helps to minimize assorted amplitude and phase errors. A 10 MHz reference signal synchronizes all of the system hardware. The trigger and the phase selection of the output RF pulse are digital signals input to the AWG from the FPGA.
The RF pulse power amplifier ENI 5100L provides a gain of 50 dB with a maximum output power of 100 W. The amplifier frequency range is 1.5–400 MHz. A diplexer is used to switch the resonator between transmit and receive mode.
2.2. Receive section (data acquisition and DSP) hardware configuration
Our current receive section consists of a data acquisition and DSP development system (Pentek, Upper Saddle River, NJ) and a laboratory computer (see Fig. 2). The chassis houses an ADC board, a Quad DSP board, and a communications board. The ADC board (Pentek Model 6235) converter is an AD9432 (Analog Devices, Norwood, MA) that has a 500 MHz analog input bandwidth, 12-bit resolution, and a maximum sampling rate of 105 MHz. The ADC board proprietary digital logic needed to interface with the DSP motherboard is implemented in a Virtex XC2V1000 FPGA (Xilinx, San Jose, CA). Since the proprietary logic only uses a small percentage of the FPGA capacity, the remainder of the FPGA is available to the end-user for application-specific firmware development. The DSP board (Pentek Model 4291) consists of four C6701 floating-point DSP processors (Texas Instruments, Dallas, TX) and 64 MB of usable RAM. The communications board (Motorola Model MVME2100) allows the laboratory computer to communicate bi-directionally with the DSP development system via Ethernet.
An 8648D frequency synthesizer (Agilent, Palo Alto, CA), synchronized with the AWG via the 10 MHz reference signal, generates the 80 MHz sampling clock used for these experiments. Bandpass sampling at 80 MHz effectively downconverts the FID signal centered at 300 MHz down to a center frequency of 20 MHz. The 12-bit sample data are passed to the on-board FPGA for the first stage of digital signal processing.
Modern FPGAs, with their DSP-oriented architectures, consist of hundreds of logic and DSP multiplier blocks which can, when utilized together, offer an order of magnitude performance increase over standard DSP processors. Our system benefits from front-end high-speed FGPA processing combined with subsequent flexible complex DSP processors. The FPGA is a critical component of this system design because it reduces the amount (i.e., data rate) of FID signal data that are streamed to the DSP board. The DSP board resources are then free to complete more complex signal processing tasks. The FPGA firmware consists of signal averaging to increase the signal-to-noise ratio (SNR), and is currently configured to average 16,384 FID waveforms. Because the phase of the received FID signals alternates between 0° and 180°, averaging can also help to minimize systematic noise (e.g., ambient signals). This is accomplished by alternating between adding and subtracting (corresponding to the phase of the FID signal) when updating the running average. A complete average of 16,384 FID waveforms is generated every 210 ms. The typical data transfer rate to the DSP board is approximately 334 MB/s, but the data come in bursts (i.e., duty cycle is roughly 1/8500). The FPGA also generates a digital signal to trigger the AWG and a phase signal to select which FID average waveform is output from the FPGA (see Fig. 3).
Fig. 3.
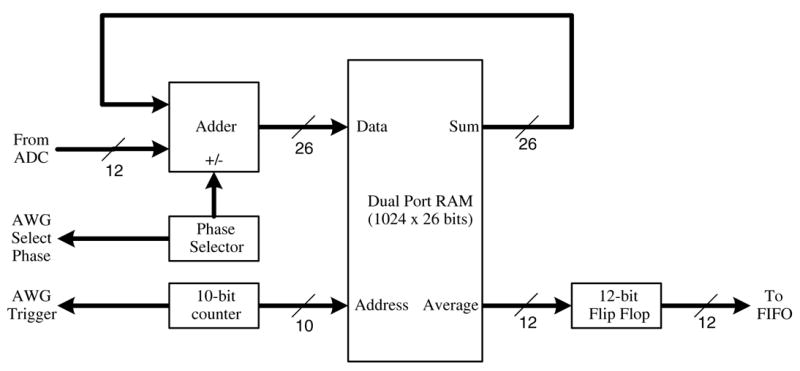
Block diagram of the FPGA accumulator algorithm and AWG control as implemented in firmware.
The second stage of digital signal processing takes place on the DSP board. Currently, the signal processing algorithm only requires the use of one of four available DSP processors. We expect to use the additional processors as the complexity of the algorithm increases, and as the real-time imaging features advance. The signal processing functions completed by the DSP processor include: additional averaging (i.e., beyond 16,384 FID waveforms), digital-downconversion (DDC), windowing, filtering, and a fast Fourier transform (FFT) (see Fig. 4).
Fig. 4.

Block diagram of the DSP signal processing algorithm as implemented in firmware.
2.3. Resonator
The resonator is of the parallel coil type [17] that has an inner diameter of 12.5 mm, and a length of 25 mm. The resonator is tuned to 300 MHz, and has a critical unloaded Q of ~500. The Q is brought down to approximately 21.4 by a combination of resistive damping and overcoupling through adjustments of a matching capacitor. Under these conditions, there is no reduction in Q when the sample is loaded. The dead time of the system is ~300 ns.
2.4. Spin probes
The spin probe used for these FT-EPR measurements is the paramagnetic solid lithium phthalocyanine (LiPc) as well as the charge transfer complex, N-methylpyridinium tetracyanoquinodimethane, NMP-TCNQ. The EPR spectrum of LiPc is oxygen dependent, and is in the range of 50–500 mG. For the current study, 100 mg of LiPc was held in two glass vials sealed with a rubber septum and incubated in argon atmosphere. The linewidth of the EPR spectrum was <50 mG and the estimated transverse relaxation time was approximately 2.7 μs. The free induction decay lasted longer than 5 μs.
2.5. Software
The FPGA firmware was developed in a hardware description language (i.e., VHDL) using the Xilinx ISE software development tool. Our custom application-specific firmware is then combined with the proprietary firmware (critical for basic ADC board functionality) provided by Pentek. Once the firmware is synthesized, it is easily downloaded to the FPGA and executed. The firmware consists of dual-port random access memory (RAM) used as a 26-bit accumulator where the new FID signal sample data (or the negated sample data) are added to the running summation in memory. Once 16,384 FID waveforms are accumulated, the upper 12 bits of the accumulator are transferred out of the FPGA to the first-in-first-out memory (FIFO) that interfaces the ADC board to the DSP board (see Fig. 3).
The DSP processor firmware is developed in C using the Texas Instruments Code Composer Studio software development tool. Pentek supplies the drivers for the DSP board, and our custom DSP code utilizes the driver functions to communicate with the FIFO interface on the ADC board, and to communicate with the laboratory computer via the communications board. The DSP processor firmware reads the averaged FID sample data from the FIFO, and can average the FID sample data further prior to performing the DDC. The additional DSP averaging is optional, yet typically selected when the SNR of the received FID signals are low. The total amount of optional averaging is a user programmable parameter, and is not fundamentally limited by the DSP processor. The next step in processing is the DDC, which is accomplished by multiplying the FID signal average by cos(nπ/2) and sin(nπ/2), resulting in the quadrature signals, I and Q. This digital mixer step downconverts the signal centered at 20 MHz to quadrature baseband, as well as upconverts a spectral image centered at 40 MHz. The signal is then windowed to removed ringdown noise and lowpass filtered to eliminate the spectral image at 40 MHz. The lowpass filter has the following time-domain response, and outputs only the baseband signal. The filter has a Gaussian shape centered at baseband and slopes down towards zero at the locations of the spectral images. This type of filter is easily implemented on a DSP.
| (2) |
The next step in the processing algorithm is to perform a FFT on the signal. In the case of a 2D image acquisition, the FFT represents a single slice of the filtered backprojection data set. These FFT data are then transferred from the DSP development system via the communications board to the laboratory computer (see Fig. 4). The computer performs the filtered backprojection algorithm generating the 2D image.
Custom application-specific LabVIEW (National Instruments, Austin, TX) software is used on the laboratory computer to control and automate the overall EPR system, perform signal processing, and provide a graphical user interface (GUI). The custom software initializes the various hardware components in the EPR system, and controls the sequence of events (e.g., calibration, B0 and B1 fields, etc.). Digital representations of the RF excitation pulse waveforms are generated by the LabVIEW software, and then downloaded to the AWG. Communication with the DSP development system enables the LabVIEW software to download the custom FPGA and DSP processor firmware (i.e., data acquisition system configuration and signal processing algorithm), synchronize data acquisition with other system components, and transfer the FID average waveform from the DSP processors. Lastly, the Lab-VIEW software performs the final steps of the signal processing algorithm. Currently, this final stage of processing includes the 2-D image reconstructed via filtered back-projection, as well as additional image processing and GUI display.
3. Results
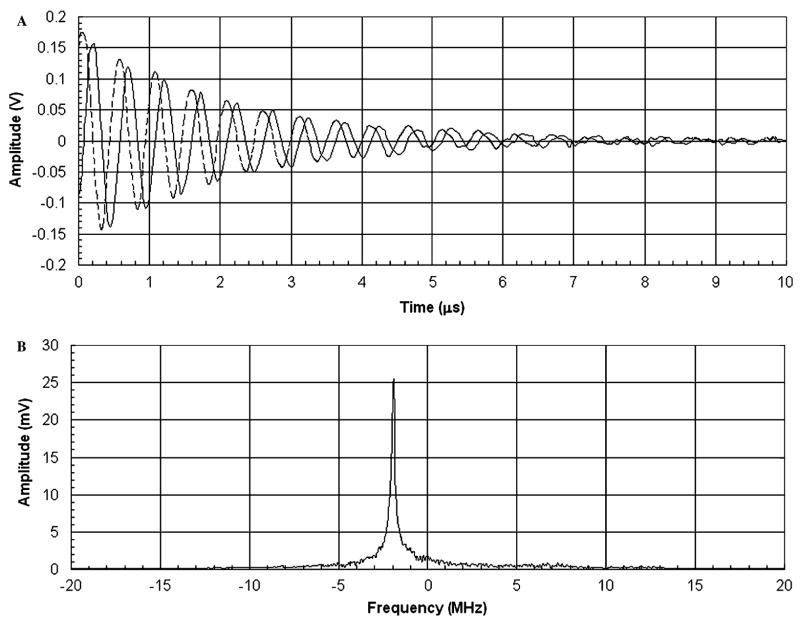
The first set of tests simply consisted of acquiring an averaged FID waveform to verify the functionality of the system. A test tube of LiPc (100 mg) was used as the sample. For these experiments the AWG was configured to generate a 300 MHz, 50 ns duration, square-shaped RF excitation pulse. The phase of the RF pulses alternated between 0° and 180°, and the peak power was 49 W. The FPGA firmware was designed to average 16,384 FID acquisitions. A calibration file was acquired with the B0 field set to zero. The B0 field was then activated and tuned to slightly offset the Larmor frequency (Lf) of the system from 300 MHz. A FID average wave-form was acquired (see Fig. 5) with a total acquisition time of 210 ms. The data were processed in real time by the DSP processor, and displayed by the laboratory computer. The output FID average waveform SNR was ~31 dB. This SNR represents a ~8 dB improvement compared to earlier work [15] using an IF stage in the FT-EPR system configuration with the sample subjected to similar conditions and processed to correct for phase and amplitude mismatches.
Fig. 5.
Received FID signal with a B0 = 10.59 nT and B1 = 0 in the (A) time domain with the solid and dashed lines representing the I and Q quadrature terms and (B) a magnitude plot in the frequency domain.
A second set of experiments were designed to provide several 2-D images of two test tubes containing LiPc samples. The AWG configuration was unchanged, generating a 300 MHz, 50 ns duration, square-shaped RF excitation pulse. The phase of the RF pulses alternated between 0° and 180° and the peak power was 49 W. The FPGA firm-ware was also identical, designed to average 16,384 FID acquisitions. A calibration file was acquired with the B0 field set to zero. The B0 field was then activated and tuned to an Lf of 300 MHz (i.e., 10.69 mT). The gradient field, B1, was set to create a linear gradient of 0.25 G/cm. Once the fields are initialized, the software initiates a 2-D acquisition. For a chosen half-plane, the gradient vector was rotated in equal angle intervals (i.e., 37 intervals), and at each angle 65,536 FID waveforms were averaged. More specifically, four of the FPGA generated 16,384-waveform FID averages were further averaged by the DSP processor. A FFT was computed on each final FID signal average to generate the projections needed to reconstruct the image. The 2-D image was then reconstructed via filtered backprojection and post-processed (see Fig. 6).
Fig. 6.
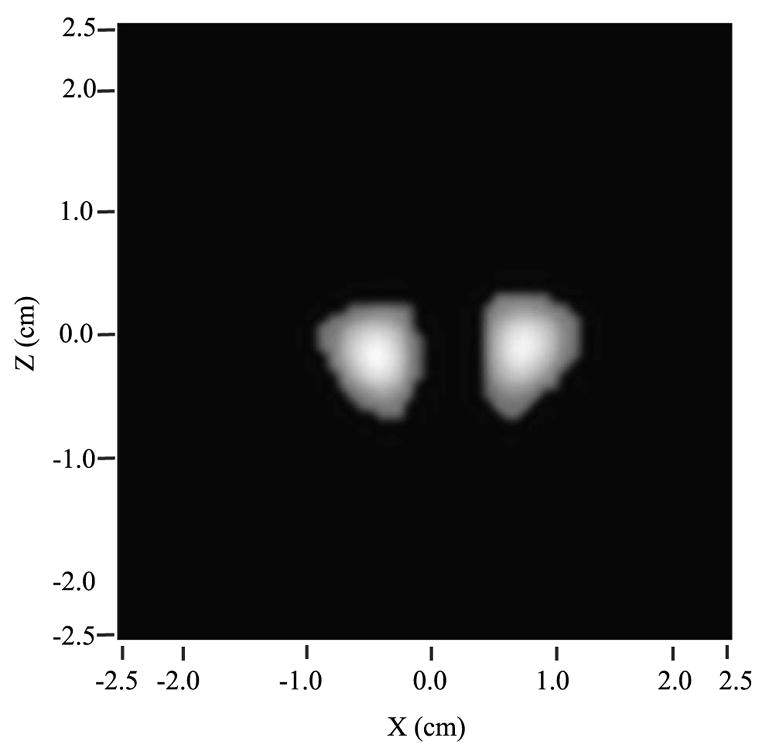
2-D image of two samples of LiPc. Thirty-seven slices were acquired for the backprojection reconstruction, with the gradient fields set to 0.25 G/cm.
4. Conclusion
We have demonstrated integration of modern DSP technologies to implement direct FID detection TLSS in FT-EPR imaging. Our implementation eliminated the IF downconversion stage used in previous (i.e., traditional) system configurations and provided an increase in the final SNR of ~8 dB. This improvement is a result of the absence of problematic phase errors, gain mismatches, non-linearities, transmission line issues, and imbalances, as well as a reduced susceptibility to ambient noise sources and EPR system noise. Earlier system configurations required large amounts of memory to store raw data (or advanced averaging systems), longer total acquisition times to address system-related mismatches, and a large amount of postprocessing to generate images (i.e., averaging several thousand acquired waveforms, digital downconversion, fast Fourier transform, time- and frequency-domain windowing, and filtered backprojection). The present data acquisition and DSP processing system performs much of the signal processing in real time using the FPGA (for signal averaging) and the DSP (all the remaining processing, except the filtered backprojection, which is currently being developed), thus reducing the post-processing time and total acquisition time significantly.
The FPGA and DSP hardware can be dynamically programmed, meaning that the firmware for each can be easily customized (i.e., user selectable via GUI or programmed automation), facilitating substantive reconfigurations of the overall EPR system operation, therefore supporting various imaging applications. With non-DSP-based systems, such major EPR system reconfigurations would typically require hardware changes daunting to typical end-users not intimately involved in EPR system design.
Future work will consist of implementing the complete filtered backprojection algorithm in the DSP processor hardware, improving the windowing and filtering that occur after the DDC, and moving all averaging to the FPGA hardware. We aim to complete all signal and imaging processing on the DSP platform, providing real-time feedback for process monitoring and control, while the laboratory computer is used solely for a system GUI and image display. Other sequences will be implemented utilizing stochastic excitation [15] and single-point imaging [18]. We are optimistic that our recent work in DSP-based FT-EPR system design will facilitate the development of completely new system configurations and imaging methodologies.
Acknowledgments
This research was supported by the Intramural Research Program of the National Institutes of Health, the National Cancer Institute, and the Center for Information Technology.
References
- 1.Halpern HJ, Yu C, Peric M, Barth E, Grdina DJ, Teicher BA. Oxymetry deep in tissues with low-frequency electron paramagnetic resonance. Proc Natl Acad Sci USA. 1994;91(26):13047–13051. doi: 10.1073/pnas.91.26.13047. [DOI] [PMC free article] [PubMed] [Google Scholar]
- 2.Murugesan R, Cook JA, Devasahayam N, Afeworki M, Subramanian S, Tschudin R, Larsen JA, Mitchell JB, Russo A, Krishna MC. In vivo imaging of a stable paramagnetic probe by pulsed-radiofrequency electron paramagnetic resonance spectroscopy. Magn Reson Med. 1997;38(3):409–414. doi: 10.1002/mrm.1910380309. [DOI] [PubMed] [Google Scholar]
- 3.Afeworki M, van Dam GM, Devasahayam N, Murugesan R, Cook J, Coffin D, Ardenkjaer-Larsen JHA, Mitchell JB, Subramanian S, Krishna MC. Three-dimensional whole body imaging of spin probes in mice by time-domain radiofrequency electron paramagnetic resonance. Magn Reson Med. 2000;43(3):375–382. doi: 10.1002/(sici)1522-2594(200003)43:3<375::aid-mrm9>3.0.co;2-g. [DOI] [PubMed] [Google Scholar]
- 4.Koscielniak J, Devasahayam N, Moni MS, Kuppusamy P, Yamada K, Mitchell JB, Krishna MC, Subramanian S. 300 MHz continuous wave electron paramagnetic resonance spectrometer for small animal in vivo imaging. Rev Sci Instrum. 2000;71(11):4273–4281. [Google Scholar]
- 5.Subramanian S, Yamada K, Irie A, Murugesan R, Cook JA, Devasahayam N, van Dam GM, Mitchell JB, Krishna MC. Non-invasive in vivo oximetric imaging by radiofrequency FT EPR. Magn Reson Med. 2002;47:1011–1018. doi: 10.1002/mrm.10133. [DOI] [PubMed] [Google Scholar]
- 6.Krishna MC, English S, Yamada K, Yoo J, Murugesan R, Devasahayam N, Cook JA, Golman K, Ardenkjaer-Larsen JH, Subramanian S, Mitchell JB. Overhauser enhanced magnetic resonance imaging for tumor oximetry: coregistration of tumor anatomy and tissue oxygen concentration. Proc Natl Acad Sci USA. 2002;99(4):2216–2221. doi: 10.1073/pnas.042671399. [DOI] [PMC free article] [PubMed] [Google Scholar]
- 7.Subramanian S, Murugesan R, Devasahayam N, Cook JA, Afeworki M, Pohida T, Tschudin RG, Mitchell JB, Krishna MC. High-speed data acquisition system and receiver configurations for time-domain radiofrequency electron paramagnetic. J Magn Reson. 1999;137:379–388. doi: 10.1006/jmre.1998.1697. [DOI] [PubMed] [Google Scholar]
- 8.Hyde JS, Mchaourab HS, Camenisch TG, Ratke JJ. Electron paramagnetic resonance detection by time-locked subsampling. Rev Sci Instrum. 1998;69(7):2622–2628. [Google Scholar]
- 9.Froncisz W, Camenisch TG, Ratke JJ, Hyde JS. Pulse saturation recovery, pulse ELDOR, and free induction decay electron paramagnetic resonance detection using time-locked subsampling. Rev Sci Instrum. 2001;72:1837–1842. [Google Scholar]
- 10.Hyde JS, Camenisch TG, Ratke JJ, Strangeway RA, Froncisz W. Digital detection by time-locked sampling in EPR. In: Eaton SS, Eaton GR, Berliner LJ, editors. Biological Magnetic Resonance, Biomedical EPR—Part B: Methodology and Instrumentation. Vol. 24. Kluwer Academic/Plenum Publishers; New York, NY: 2005. pp. 199–222. [Google Scholar]
- 11.Nyquist H. Certain topics in telegraph transmission theory. AIEE Trans. 1928;47:617–644. [Google Scholar]
- 12.Gabor D. Theory of communication. J Inst Elec Eng. 1946;93:429–459. [Google Scholar]
- 13.Coulson AJ, Vaughan RG, Poletti MA. Frequency-shifting using bandpass sampling. IEEE Trans Signal Process. 1994;42:1556–1559. [Google Scholar]
- 14.Forrer J, Schmutz H, Tschaggelar R, Schweiger A. Direct EPR detection of transient and continuous wave signals at 2.5 GHz. J Magn Reson. 2004;166:246–251. doi: 10.1016/j.jmr.2003.10.022. [DOI] [PubMed] [Google Scholar]
- 15.Pursley RH, Kakareka J, Salem G, Devasahayam N, Subramanian S, Tschudin RG, Krishna MC, Pohida TJ. Stochastic excitation and Hadamard correlation spectroscopy with bandwidth extension in RF FT-EPR. J Magn Reson. 2003;162:35–45. doi: 10.1016/s1090-7807(03)00050-8. [DOI] [PMC free article] [PubMed] [Google Scholar]
- 16.Pursley RH, Salem G, Devasahayam N, Subramanian S, Krishna MC, Pohida TJ. Direct detection and time-locked subsampling applied to pulsed electron paramagnetic resonance imaging. Rev Sci Instrum. 2005;76(5):53709–53715. doi: 10.1063/1.1903163. [DOI] [PMC free article] [PubMed] [Google Scholar]
- 17.Devasahayam N, Subramanian S, Murugesan R, Cook JA, Afeworki M, Tschudin RG, Mitchell JB, Krishna MC. Parallel coil resonators for time-domain radiofrequency electron paramagnetic resonance imaging of biological objects. J Magn Reson. 2000;142(1):168–176. doi: 10.1006/jmre.1999.1926. [DOI] [PubMed] [Google Scholar]
- 18.Subramanian S, Devasahayam N, Murugesan R, Yamada K, Cook J, Taube A, Mitchell JB, Lohman JA, Krishna MC. Magn Reson Med. 2002;48(2):370–379. doi: 10.1002/mrm.10199. [DOI] [PubMed] [Google Scholar]


