

Abstract
Frataxin protein deficiency causes the neurodegenerative disease Friedreich ataxia. We used inducible siRNA to order the consequences of frataxin deficiency that we and others have previously observed. The earliest consequence of frataxin deficiency was a defect in cytoplasmic iron–sulfur proteins. In the second phase, protein oxidative damage increased, and CuZnSOD was induced, as was the unfolded protein response (UPR), long before any decline in mitochondrial aconitase activity. In the third phase, mitochondrial aconitase activity declined. And in the fourth phase, coincident with the decrease in heme-containing cytochrome c protein, a transcriptional induction of the heme-dependent transcripts ALAS1 and MAOA occurred. These observations suggest that the earliest consequences of frataxin deficiency occur in ISC proteins of the cytoplasm, resulting in oxidative damage and stress and activation of the unfolded protein response which has been associated with neurological disease, and that later consequences involve mitochondrial iron–sulfur cluster deficiency, heme deficiency, and then increased heme biosynthesis.
Keywords: Frataxin, RNAi, Iron-sulfur cluster, Redox alterations, Heme pathway, Unfolded protein response
Friedreich ataxia (FRDA)1 is the most common recessively inherited ataxia, and is characterized by progressive neurodegeneration, hypertrophic cardiomyopathy and increased incidence of diabetes [1–3]. FRDA is caused by a deficiency in frataxin protein due to a GAA repeat expansion in the first intron [4,5]. The residual frataxin level ranges from 5% to 35% of the normal level in patients [5,6]. Frataxin deficiency causes multiple biochemical alterations including: decreased activity of iron–sulfur cluster (ISC) proteins, accumulation of mitochondrial iron, sensitivity to pro-oxidants, altered heme pathway transcripts, and activation of stress pathways [7–12]. However, it is less clear which of these alterations are the primary events and which are secondary in the pathogenesis of Friedreich ataxia.
Some animal and cellular models are relevant to the phases of frataxin-deficient cellular pathology. For example, conditional neuronal and cardiac frataxin knockout mice demonstrated that iron accumulation occurred after the onset of cardiac hypertrophy and after ISC protein deficiency, suggesting that an accumulation of mitochondrial iron is not a primary consequence of frataxin deficiency [13]. Frataxin depletion in human HeLa cells by RNAi showed that the activity of ISC enzymes decreased quickly, whereas no alterations in total cellular, mitochondrial, or heme iron were observed [14]. Both of these former studies demonstrate that ISC enzyme defects are the primary consequence of frataxin deficiency and iron accumulations are late consequences. Microarray studies of the earliest consequences of frataxin deficiency in mice suggest alterations of stress and redox pathways [15].
Recent data demonstrate that the mature form of frataxin also exists in the cytosol, and that it physically interacts with ISU1 (the cytosolic isoform of ISC scaffold), suggesting that frataxin is involved in the ISC biosynthesis in the cytosol [16,17]. These data suggest that frataxin may serve important functions in the cytosol as well as the mitochondria.
In order to control the onset of frataxin deficiency, and thus study the earliest biochemical consequences at the cellular level, we generated an inducible frataxin knockdown cell model. We observed that cytoplasmic frataxin turns over three times faster than mitochondrial frataxin. The earliest consequences of frataxin deficiency were observed to occur in cytoplasmic ISC proteins and to result in oxidative damage and stress, and trigger the unfolded protein response. In addition, cytochrome c depletion and ALAS1 induction occur only after mitochondrial ISC deficiency. These observations suggest four phases of consequences of frataxin deficiency, an early phase in which only cytoplasmic ISC enzymes are affected, a secondary phase in which protein oxidative damage occurs and triggers the unfolded protein response, a third phase in which mitochondrial aconitase activity declines, and a fourth phase in which a heme abnormality develops, to which the cell attempts to respond by activation of the rate-limiting step of the heme pathway.
Experimental procedures
Cell lines and cell culture
T-Rex-293 (Invitrogen, Carlsbad, CA) is a human embryonic kidney cell line that contains the pcDNA6/TR plasmid, stably expressing the tetracycline repressor (TetR). T-Rex-293 Cells were maintained in DMEM supplemented with 10% tetracycline-free FBS (Hyclone, Logan, UT) and antibiotics. Lymphoblasts were maintained in RPMI 1640 supplemented with 500 mg/L glutamate, 1 mM sodium pyruvate, 50 μg/mL uridine, 100 μM non-essential amino acids (Invitrogen), 20% FBS and penicillin/streptomycin.
Vector construction (inducible hFxnRNAi construct)
The pSUPERIOR.PURO vector for inducible siRNA expression in mammalian cells was purchased from Oligoengine (Seattle, WA). pSUPERIOR. PURO is a tetracycline-regulated expression vector, in which tetracycline regulation is achieved by the binding of tetracycline to the TetR which derepresses the promoter controlling expression of the shRNA.
The shRNA sequence against human frataxin was designed using the software provided by Oligoengine. The template for shRNA expression was obtained by annealing oligonucleotides (GATCCC AGTTCGAAC CAACGTGGCC TTCAAGAGA GGCCACGTTGGTTCGAACT TTTT TC and TCGAGAAAAA AGTTCGAACCAACGTGGCC TCTC TTGAA GGCCACGTTGGTTCGAACT GG). The sense and antisense strands of the 19-nucleotide (nt) target sequence (position 166–184 of the coding sequence) are indicated in italics and are separated by a 9-nt loop sequence (TTCAAGAGA). The pSUPERIOR.PURO vector was digested with BglII and XhoI. The annealed oligonucleotides were ligated into the vector, designated inducible hFxnRNAi construct, and confirmed by sequencing.
Generation of stable tetracycline-inducible hFxnRNAi cell line
T-Rex-293 cells were transfected with the inducible hFxnRNAi construct using Lipofectamine 2000 (Invitrogen). The empty pSUPERIOR. PURO vector was transfected into the T-Rex-293 and was used as control for the inducible model system. At 24 h after transfection, the cells were split at a 1:10 ratio and grown in medium containing 1.5 μg/mL puromycin (Sigma, St. Louis, MO) and 5 μg/mL blasticidin hydrochloride (Invitrogen) for 2 weeks. Single clones were isolated and expanded for an additional 2 months.
To determine the efficiency of the inducible RNAi system, frataxin mRNA levels were assayed by real-time qPCR upon induction with tetracycline in hFxnRNAi and control clones. Each transfectant was incubated with and without tetracycline (1 μg/mL) at 37 °C for 48 h. Afterwards, total RNA was isolated and real-time qPCR was performed to examine frataxin mRNA levels. Four hFxnRNAi clones showed >50% reduction of frataxin, whereas frataxin level remained unchanged (data not shown) in control clones after 48 h of exposure to tetracycline (1 μg/mL).
Verification of inducible siRNA-mediated suppression of frataxin
A dose–response study and a time course study were performed to verify tetracycline-inducible frataxin suppression. The hFxnRNAi transfectant was incubated in medium containing different tetracycline concentrations (i.e., 0, 0.005, 0.05, 0.25, 0.5, 1, 2 and 3 μg/mL) for 48 h. Frataxin mRNA levels were assayed by real-time qPCR. The dose–response study showed that the frataxin suppression displayed a tetracycline dose-dependent manner in the hFxnRNAi clone (see Fig. 9). A concentration of 0.05 μg/mL gives a maximum knockdown, and no apparent greater frataxin suppression can be observed beyond this dose. An optimal dose of 0.5 μg/mL was used for the time-course study of frataxin suppression. The hFxnRNAi clones were split into multiple T-25 flasks and incubated with and without tetracycline for 1, 2, 3, 4 and 5 days. The control clones were also incubated in medium with or without tetracycline. Total RNA and protein were isolated at each time point. The time-course study showed that frataxin was suppressed upon the addition of tetracycline in a time-dependent manner in the hFxnRNAi clones, whereas frataxin expression remained similar at every time point in the control clones (see Fig. 10). By day 4 and day 5, the residual frataxin mRNA in the hFxnRNAi clones was approximately 20% of the normal level, and the residual frataxin protein was about 30% (see Fig. 10).
Fig. 9.
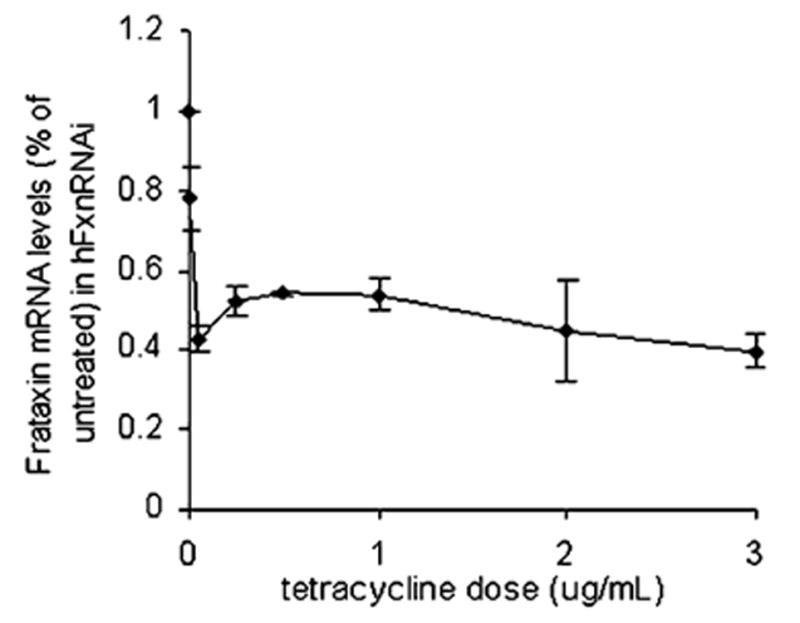
Dose–response study in a representative hFxnRNAi clone. The hFxnRNAi transfectant was subcultured in media containing different tetracycline concentrations, ranging from 0 to 3 μg/mL (i.e., 0, 0.005, 0.05, 0.25, 0.5, 1, 2 and 3 μg/mL tetracycline) for 48 h. Total RNA was isolated and frataxin mRNA levels were assayed by real-time qPCR (GAPDH was used as reference gene). Data are presented as percentages of basal values in cells treated without tetracycline (means ± SD).
Fig. 10.
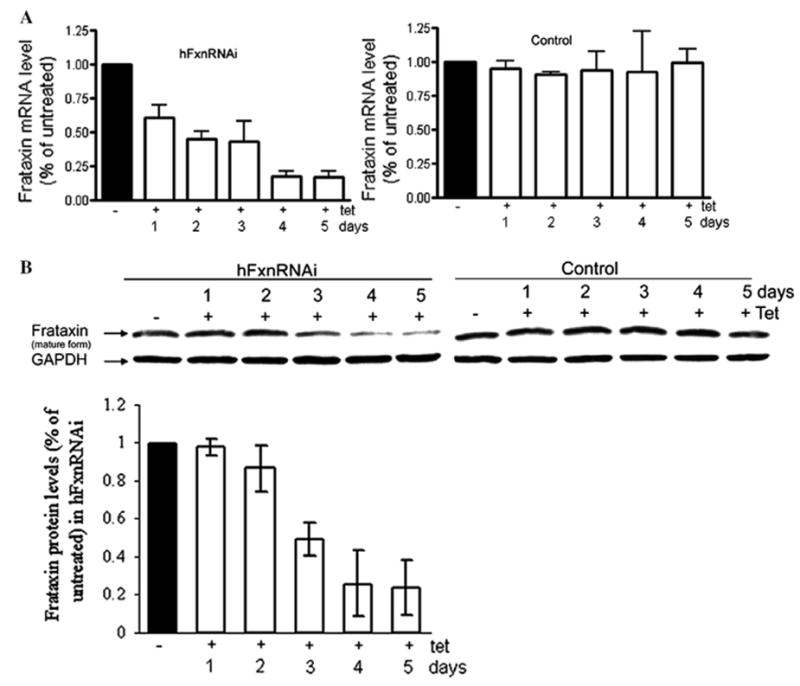
Frataxin mRNA and protein depletion by siRNA produced upon tetracycline induction at different time points in two selected hFxnRNAi clones. (A) Frataxin relative mRNA levels (frataxin/GAPDH) by real-time qPCR in hFxnRNAi and control clone. (B) Representative Western blot of frataxin protein in hFxnRNAi and control clone, GAPDH as loading control. The bar graph shows the protein levels by densitometry of Western blots in two selected hFxnRNAi clones. Data are presented as percentages of basal values in cells treated without tetracycline (means ± SD).
Quantitative RT-PCR analysis
Total RNA was extracted and the real-time qPCR was performed as described previously [18]. GAPDH was chosen as a reference gene, and all transcript levels were normalized with GAPDH transcript levels in the same sample. Serial dilutions of cDNA were used for standard curve for each primer pair. The primers of PCR are as follows:
Frataxin (290 bp) forward, 5′-ACT AGC AGA GGA AAC GCT GG- 3′, reverse, 5′-AGG CTT TAG TGA GCT CTG CG-3′; GAPDH (215 bp) forward, 5′-CCC CTG GCC AAG GTC ATC CAT G-3′, reverse, 5′-CAG TGA GCT TCC CGT TCA GCT C-3′; MAOA (440 bp) forward, 5′- GGA TTA CTG TGG CTG CAT GAT-3′, reverse, 5′-TCC CGA GAC CAT TTA AGA CCT-3′; ALAS1 (234 bp) forward, 5′-CGT CAA ACT CAT GAG ACA GAT GC-3′, reverse, 5′-TAG TTC ATC ATC TGG GGT GTG TG-3′; ATF4 (377 bp) forward, 5′-AAG CCT AGG TCT CTT AGA TGA TTA CC-3′, reverse, 5′-CAA CCT GGT CGG GTT TTG TTA AAC-3′; CHOP (199 bp) forward, 5′-CAG AAC CAG CAGAGG TCA CA-3′, reverse, 5′-AGC TGT GCC ACT TTC CTT TC- 3′; IRP1 (315 bp) forward, 5′-GCT GGA ATG CCT TAG CAA CC-3′, reverse, 5′-GTG GTG CCT GCT TGT TCA AA-3′; mitochondrial aconitase (379 bp) forward, 5′-CAC TTC CGT GTT CCC TTA CAA-3′, reverse, 5′-CCC ACC TGG AGT GAT GGT GAA CTG-3′; CuZnSOD (206 bp) forward, 5′-CAT GTT GGA GAC TTG GGC AAT-3′, reverse, 5′-ACA CCA CAA GCC AAA CGA CTT-3′.
Isolation of cytoplasmic and mitochondrial fractions
About 1.2 × 10⁸ cells were washed with ice-cold phosphate-buffered saline (PBS) and resuspended with 4 mL mitochondrial isolation buffer (250 mM sucrose, 50 mM Tris–HCl, 0.2 mM EDTA, 1× protease inhibitor cocktail and 1 mM PMSF, pH 7.4) per gram cell pellet. 0.1 mg/mL digitonin was added and the cell suspension was incubated for 10 min on ice. Homogenization was carried out in a Potter–Elvehjem homogenizer with 15 strokes using a Teflon pestle. The homogenate was then centrifuged (1000g for 10 min at 4 °C) to remove nuclei, unbroken cells and debris. The crude mitochondrial pellet was collected by centrifugation at 12,000g (15 min) in a microfuge and gently rinsed with cold isolation buffer three times. The mitochondrial pellet was resuspended in the mitochondrial isolation buffer and freeze-thawed three times to break the mitochondrial membrane. The supernatant containing cytoplasmic proteins was stored at −80 °C for further investigation. The protein concentration was determined by Bradford assay (Bio-Rad, Hercules, CA).
Whole cell extract preparation
The cells were harvested and lysed in ice-cold lysis buffer (50 mM Tris– HCl, pH 7.4, 150 mM NaCl, 1 mM EDTA, 1% NP-40, 0.25% Na-deoxycholate, 1 mM PMSF, 1 μg/mL each of aprotinin, leupeptin and pepstatin), and incubated on ice for 30 min. Two hundred microliters of lysis buffer was used per T-75 flask. The lysates were centrifuged at 14,000g for 20 min at 4 °C. The supernatants were saved as whole cell extracts and stored at −80 °C.
Western blot analysis
Equal amounts of proteins were resolved on SDS–polyacrylamide gel and then transferred to nitrocellulose membranes using a Mini Trans-Blot cell (Bio-Rad). After blocking with 4% non-fat milk, the membranes were incubated overnight with the following primary antibodies: rabbit antifrataxin; mouse anti-GAPDH; rabbit anti-MnSOD; rabbit anti-CuZn- SOD; rabbit anti-ISU (a kind gift from Drs. Tracey Rouault and Wing Hang Tong); rabbit anti-COXIV; rabbit anti-VDAC; rabbit anti-IRP1 and rabbit anti-mitochondrial aconitase (a kind gift from Dr. Luke Szweda); mouse anti-cytochrome c. Afterwards, the membranes were developed with AP-conjugated secondary antibodies using a chemiluminescent substrate (Bio-Rad). Densitometry was performed for semi-quantification of signals on films on a GS-700 imaging densitometer (Bio-Rad).
Aconitase activity assay
Aconitase activity was assayed both in the mitochondrial and cytoplasmic fractions with minor modifications to the Bioxytech Aconitase- 340 assay (Oxis Research, Foster City, CA). 0.6 mM MnCl2 was included in the extract preparation buffer and also in the reaction to limit the inactivation of aconitase by [19]. Aconitase activity was determined by a coupled assay which monitors the formation of NADPH from NADP+ concomitant with the conversion of citrate to isocitrate through cis-aconitate. We monitored the formation of NAPDH by the increase in absorbance at 340 nm at 37 °C.
Immunoblot analysis of carbonylated proteins
About 2 × 10⁶ cells were harvested and lysed in the lysis buffer (10 mM Tris–HCl, pH 7.5, 150 mM NaCl, 1% Triton X-100, 0.25% Na-deoxycholate, 0.1% SDS, 1 mMPMSF, 1 μg/ml each of aprotinin, leupeptin and pepstatin). Fifty millimolar DTT was included in the lysis buffer to prevent the oxidation of proteins that may occur after cell lysis. Oxyblot analysis was performed to detect the carbonyl groups with a commercial kit (Chemicon, Temecula, CA). Briefly, 20 μg protein was derivatized with 2,4-dinitrophenylhydrazine (DNPH) for each sample. Another aliquot with the same amount of protein was added with Derivatization-Control Solution instead of the DNPH solution and used as negative control. Afterwards, the derivative that is produced by reaction with DNPH was immunodetected by an antibody specific to the attached DNP moiety of proteins and was developed with HRP-conjugated secondary antibody using enhanced chemiluminescence reagents (Amersham Biosciences, Piscataway, NJ).
Spectrophotometric assay of carbonylated proteins
The carbonyl groups of oxidized proteins was further quantified spectrophotometrically with a commercial kit (Cayman chemical, Ann Arbor, MI), according to the manual. The absorbance of proteinhydrozone produced by the reaction between DNPH and protein carbonyls was measured at 370 nm. The carbonyl content was calculated as nmol/mg protein.
Iron measurements
Mitochondrial and whole cell iron concentration were measured by the ferrozine-based colorimetric assay.
Results
Cytoplasmic frataxin turns over threefold faster than mitochondrial frataxin
The time-dependent depletion of cytoplasmic and mitochondrial frataxin pools by siRNA produced upon the tetracycline induction was measured. Total RNA was isolated from hFxnRNAi cells after incubating with or without tetracycline induction for the indicated time. Similarly, mitochondrial and cytoplasmic protein fractions were extracted from these same cells. The half-depletion for frataxin mRNA, which encodes both cytoplasmic and mitochondrial forms, was observed to be 1.5 days (Fig. 1A). As frataxin message declined monotonically, cytoplasmic frataxin protein expression declined with parallel kinetics, and the residual protein level was about 50% at 1.5 days (Fig. 1A). By contrast, the rate of mitochondrial frataxin protein expression declined threefold more slowly: the half-depletion for the mitochondrial frataxin pool occurred at 4.5 days (Fig. 1A). These results were consistent with frataxin protein levels in the whole cell lysate in hFxnRNAi cells, which showed that the maximum frataxin knockdown was reached at day 5 (Fig. 10). These data suggest that the protein turnover of mitochondrial frataxin protein is threefold slower than that of the cytoplasmic frataxin protein. Frataxin mRNA (data not shown) and protein levels (Fig. 1B) in the control clones remain unchanged at each time point.
Fig. 1.
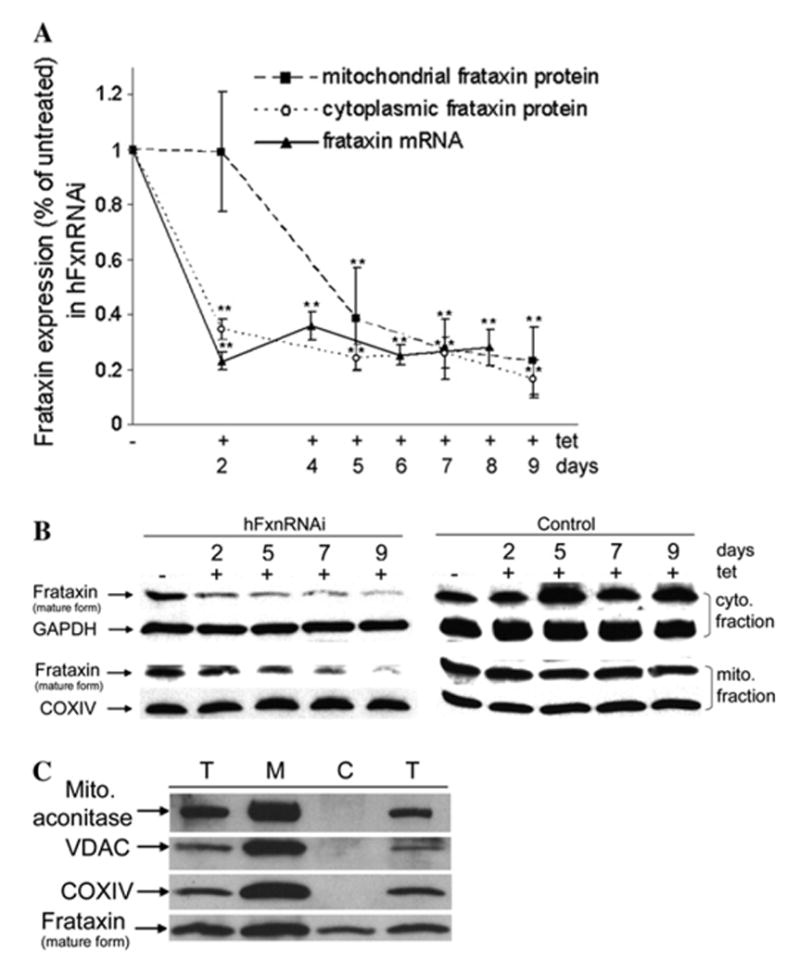
Inducible frataxin depletion in hFxnRNAi cells by siRNA upon tetracycline induction. Both hFxnRNAi and control clones were subcultured in medium without or with tetracycline for the indicated time, total RNA and protein were harvested for real-time qPCR and Western blot. (A) Frataxin mRNA levels (frataxin/GAPDH) by real-time qPCR and frataxin protein levels (frataxin/COXIV or GAPDH) by densitometry of western blots in hFxnRNAi clones. Data are presented as percentages of basal values in cells treated without tetracycline (means ± SD, n = 4–5 experiments). Asterisks indicate blocked ANOVA p < 0.01 (**) versus basal value, Dunnett post hoc test. (B) Representative Western blots of the cytoplasmic and mitochondrial frataxin protein in hFxnRNAi and control clones (GAPDH and COXIV as loading control). The mature form of frataxin was seen in cytoplasm, besides in mitochondria. The cytoplasmic and mitochondrial frataxin showed different knockdown pattern. (C) Frataxin protein levels and mitochondrial marker proteins in different cellular fractions. Frataxin and mitochondrial proteins aconitase, VDAC and COXIV were assayed by Western blots in total cell lysate (T), cytoplasmic fraction (C) and mitochondrial fraction (M) from untreated cells. Forty micrograms of total lysate, cytoplasmic fraction or mitochondrial fraction were used in each lane. Cell lysate in the first and fourth lane was obtained by using the whole cell lysis buffer described in Experimental Procedures, supplemented with or without 0.5% dodecyl maltoside.
In agreement with two recent studies, the frataxin protein we observed in the cytoplasm is the mature form (Fig. 1B). The faster kinetics of frataxin protein decline in the cytoplasmic than mitochondrial fraction (Fig. 1A and B) suggested that the mature cytoplasmic frataxin detected here is not a protein released from mitochondria during cellular fractionation. To further confirm this, cytoplasmic and mitochondrial fractions from untreated cells were subjected to Western blot analysis of frataxin and several mitochondrial proteins. The mitochondrial proteins aconitase (mitochondrial form), VDAC and COXIV were only detectable in the mitochondrial fraction and total cellular extracts (Fig. 1C), whereas frataxin was detected both in mitochondrial and cytoplasmic fractions (Fig. 1C). By densitometry we determined that the relative intensity of frataxin per 10 μg protein in mitochondrial vs. cytoplasmic fraction was 5:1, respectively (Fig. 1C); and the total protein recovered from mitochondrial vs cytoplasmic fractions was 1:8, respectively. Thus the relative amount of frataxin per cell in mitochondria vs. cytoplasm is approximately 5:8, mitochondria/cytoplasm respectively, i.e., there are approximately twice as many mature frataxin molecules in the cytoplasm as in the mitochondria per cell.
Frataxin deficiency affects cytoplasmic aconitase activity much sooner than mitochondrial aconitase activity
Frataxin has been proposed to have a primary function in the biosynthesis, protection, or repair of ISCs, and the activity of the aconitase enzyme is often used as a surrogate for ISC status [14,20]. Both cytoplasmic and mitochondrial aconitase activity were measured in hFxnRNAi cells treated with or without tetracycline. Cytoplasmic aconitase activity declined in parallel with cytoplasmic frataxin, beginning at day 2 and before mitochondrial aconitase had begun to significantly decline (Figs. 1A and 2A). There was no significant decrease in cytoplasmic aconitase protein until day 9, and no decrease in cytoplasmic aconitase mRNA at all (not shown), suggesting that the decline in cytoplasmic aconitase activity is a result in decreased iron–sulfur cluster function rather than decreased protein (Fig. 2B and C).
Fig. 2.
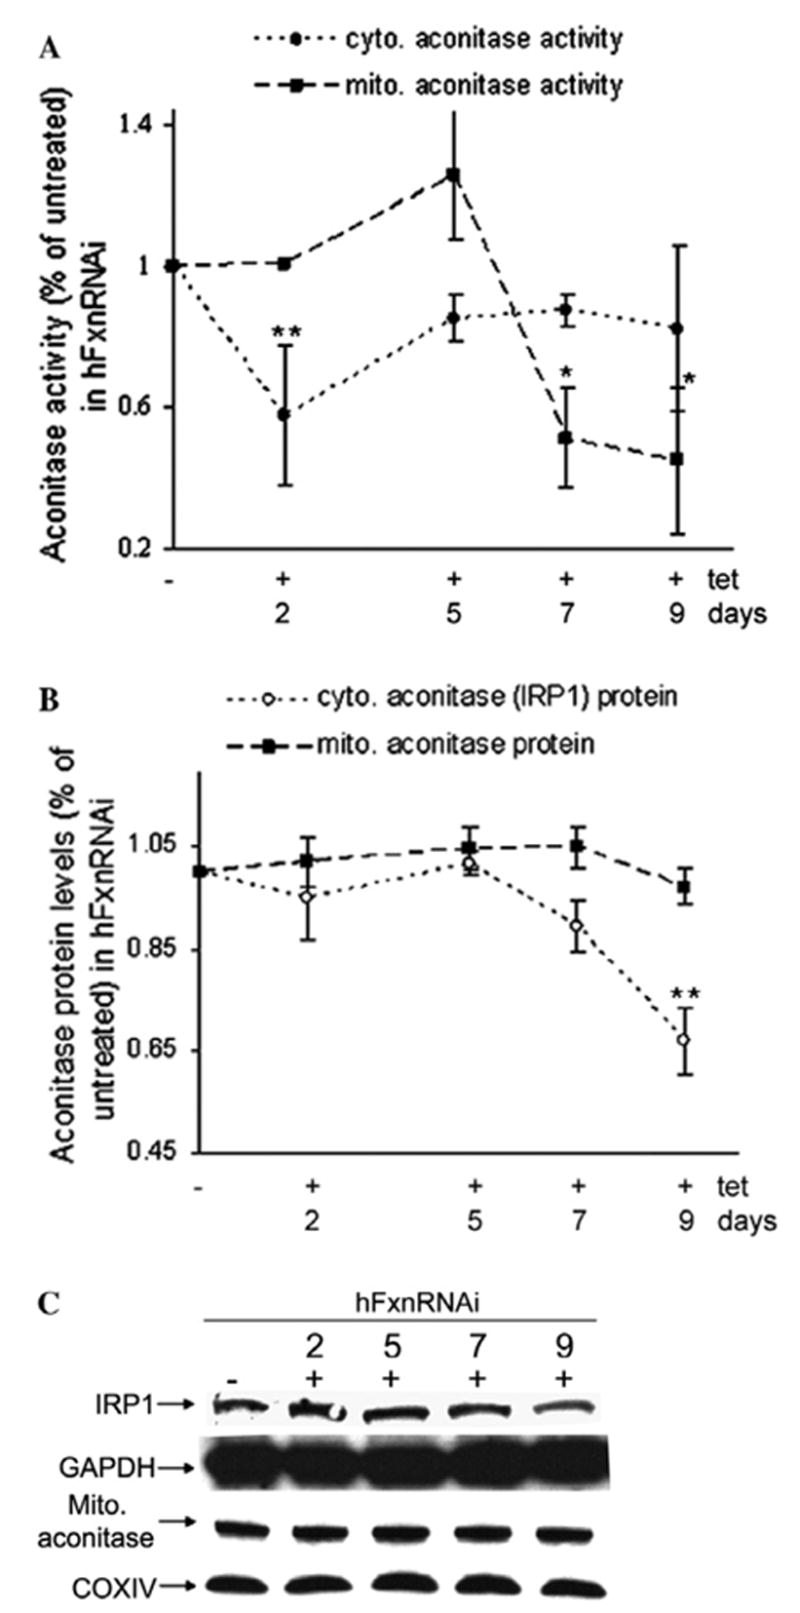
Aconitase activity and protein levels in hFxnRNAi cells. (A) Aconitase activity in mitochondrial and cytoplasmic fractions of hFxnRNAi cells. (B) Mitochondrial and cytoplasmic aconitase protein levels by densitometry of the Western blots in hFxnRNAi cells. (C) Representative Western blots of the cytoplasmic and mitochondrial aconitase protein in hFxnRNAi clones. Data in (A) and (B) are presented as percentages of basal values in cells treated without tetracycline (means ± SD, n = 2–3 experiments). Asterisks indicate blocked ANOVA p <0.01 (**) or P ≤ 0.05 (*) versus basal value, Dunnett post hoc test.
A decline in mitochondrial aconitase activity was observed at day 7 (Fig. 2A), no change in mitochondrial aconitase protein (Fig. 2B and C) or mRNA levels (data not shown) was observed. This occurred when residual mitochondrial frataxin was about 30% of the normal (Figs. 1 and 2A). The frataxin-dependent deficiencies in cytoplasmic and mitochondrial aconitase activity cannot be explained by the reduction of the mRNA or the apoprotein, suggesting a defect in their iron–sulfur cofactor. Both cytoplasmic and mitochondrial aconitase activity in control clones remain unchanged (data not shown). Thus the cytoplasmic iron–sulfur cluster defect precedes the mitochondrial one by 5 days. Said another way, the cells were subjected to a cytoplasmic iron–sulfur cluster defect from days 2 to 7, whereas the mitochondrial iron–sulfur cluster defect did not occur until day 7 and beyond.
To address the issue of whether frataxin was more important for iron concentration or iron–sulfur cluster functions, cellular and mitochondrial iron content was measured by the ferrozine assay. No differences in iron concentration were observed at day 2, 5, 7 and 9 (data not shown). Thus we observe no effects of frataxin deficiency on iron concentration in this model system.
Cytoplasmic ISU levels significantly decline rapidly after frataxin depletion, whereas mitochondrial ISU does not
We further examined the time-dependent effects of frataxin deficiency on the ISC assembly scaffold protein ISU. Cytoplasmic ISU (ISU1) protein is extremely important in that it is the scaffold on which most cytoplasmic iron–sulfur clusters are made. We have demonstrated previously that ISU expression is defective in cells from Friedreich’s ataxia patients [18], and we and others have demonstrated an irondependent interaction between frataxin and ISU [21,22]. Cytoplasmic ISU1 responded very quickly to cytoplasmic frataxin deficiency, in parallel with cytoplasmic aconitase, and began to decrease at 2 days, long before frataxin protein was depleted in mitochondria (Figs. 1A, 3A and B). The mitochondrial ISU (ISU2) did not show any alteration until day 9, two days after mitochondrial aconitase activity began to decline (Fig. 3A and B). Thus, the earliest consequences of frataxin deficiency we observed are cytoplasmic, and affect both aconitase and the scaffold upon which cytoplasmic ISCs are made. Also, the earliest consequence of frataxin deficiency we observed after the fall of mitochondrial frataxin was also a decrease in mitochondrial aconitase activity. Thus the earliest consequence of frataxin deficiency observed in both the cytoplasmic compartment and the mitochondrial compartment was a defect in iron– sulfur cluster-dependent activity.
Fig. 3.
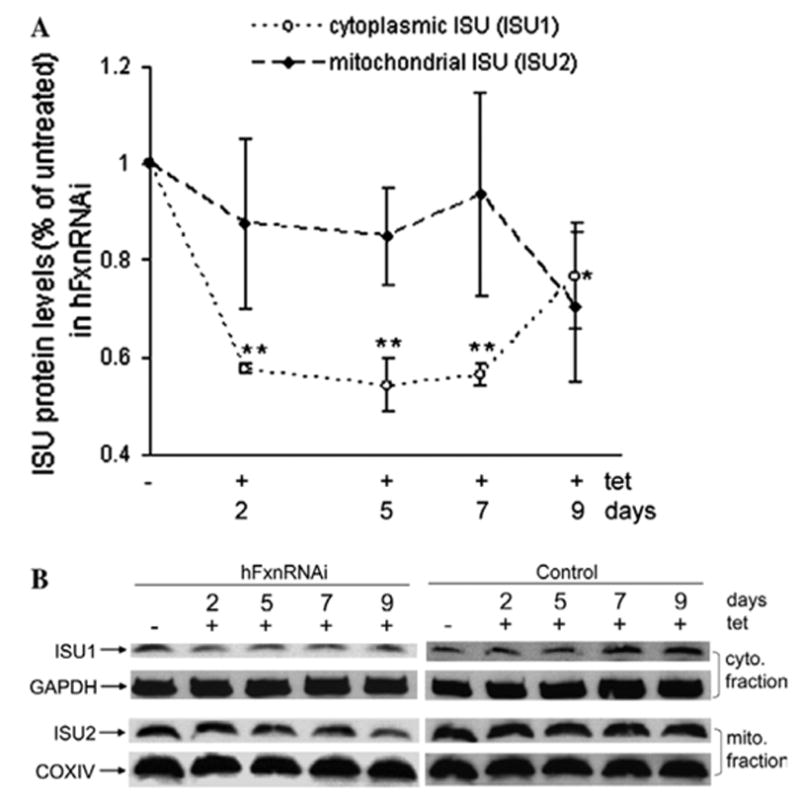
Cytoplasmic and mitochondrial iron–sulfur assembly scaffold protein (ISU1 and ISU2) levels in hFxnRNAi cells. (A) ISU1 and ISU2 protein levels (ISU1/GAPDH, ISU2/COXIV) by densitometry of Western blots in hFxnRNAi clones. Data are presented as percentages of basal values in cells treated without tetracycline (means ± SD, n = 3 experiments). Asterisks indicate blocked ANOVA p < 0.01 (**) or P ≤ 0.05 (*) versus basal value, Dunnett post hoc test. (B) Representative Western blots of the ISU1 and ISU2 protein in hFxnRNAi and control clones.
Frataxin deficiency induces transcriptional activators of the unfolded protein response
Iron–sulfur clusters are important prosthetic groups, almost always involved in electron transfer. The deficiency of cytoplasmic ISU1, should lead to a decrease in biosynthesis of ISCs, which could either cause an increase in ISC-less apoproteins and lead to more protein unfolding, or defective electron transfer from degraded ISCs and increased reactive oxygen species (ROS). Unfolded proteins induce the unfolded protein response (UPR), which has recently been implicated in multiple neurological diseases [23–28]. We observed increased transcripts for ATF4 (activating transcription factor 4) and its transcriptional targets CHOP (C/EBP homologous protein) at day 4 (Fig. 6), i.e., these occurred before mitochondrial aconitase activity began to decline at day 7, i.e., before the frataxin fall in the mitochondria had its earliest effect on mitochondrial aconitase. These data are consistent with the hypothesis that decreasing frataxin levels in the cytoplasm decreases cytoplasmic iron–sulfur cluster biosynthesis, leading to more unfolded proteins, protein damage, and the unfolded protein response.
Fig. 6.
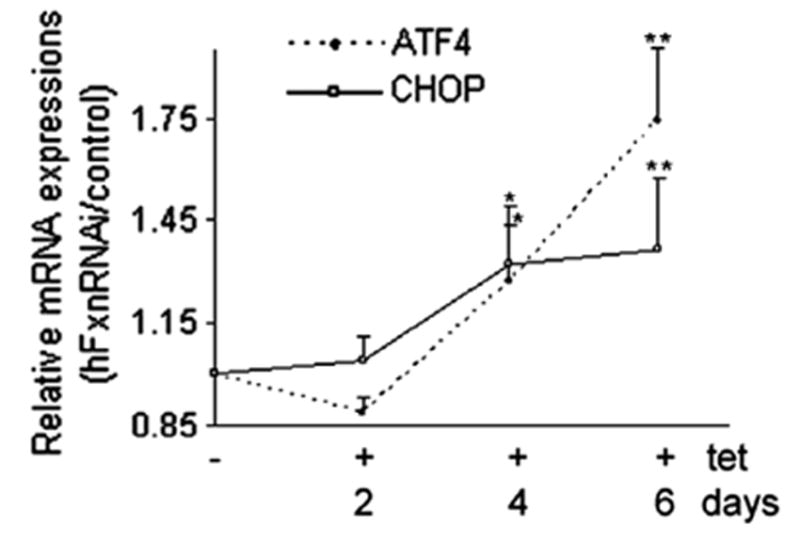
ATF4 and CHOP relative mRNA levels (hFxnRNAi/control) by real-time qPCR in hFxnRNAi clones. GAPDH was used as reference gene. Data are presented as percentages of basal values in cells treated without tetracycline (means ± SD, n = 3 experiments). Asterisks indicate blocked ANOVA p < 0.01 (**) or P ≤ 0.05 (*) versus basal value, Dunnett post hoc test.
Early induction of cytoplasmic antioxidant and protein oxidative damage upon frataxin depletion
The iron–sulfur cluster in aconitase is thought to be among the most sensitive in the cell to redox alterations [29,30]. Frataxin was shown to play a critical role in protecting aconitase from oxidative stress-induced inactivation [20]. These data suggest that one important function of frataxin is to protect ISCs from oxidative stress. Also, damaged iron–sulfur clusters within iron–sulfur proteins may lead to increased reactive oxygen species. We thus asked if the deficiency of frataxin induces antioxidant enzymes that protect against redox alterations, and if deficiency of frataxin causes protein oxidative damage. Cytoplasmic SOD (CuZnSOD) and mitochondrial SOD (MnSOD) are important antioxidant enzymes for the cytoplasmic and mitochondrial compartments, respectively, and so protein levels of CuZnSOD and MnSOD were assayed. CuZnSOD protein levels responded quickly to cytoplasmic frataxin deficiency, simultaneously with the fall in cytoplasmic aconitase and ISU1, and began to increase at day 2 (Figs. 1A, 4A and B) although mRNA levels were unchanged (data not shown). By contrast, MnSOD never exhibited a significant change (Fig. 4B). The early induction of the antioxidant enzyme CuZnSOD (before frataxin protein was depleted in mitochondria) suggests that it is cytoplasmic frataxin deficiency rather than mitochondrial frataxin deficiency that results in redox alterations. The reason for CuZnSOD being regulated at translational level but not transcriptional level was not clear. One possible interpretation is that the translational efficiency of the CuZnSOD message increases as a consequence of redox alterations.
Fig. 4.
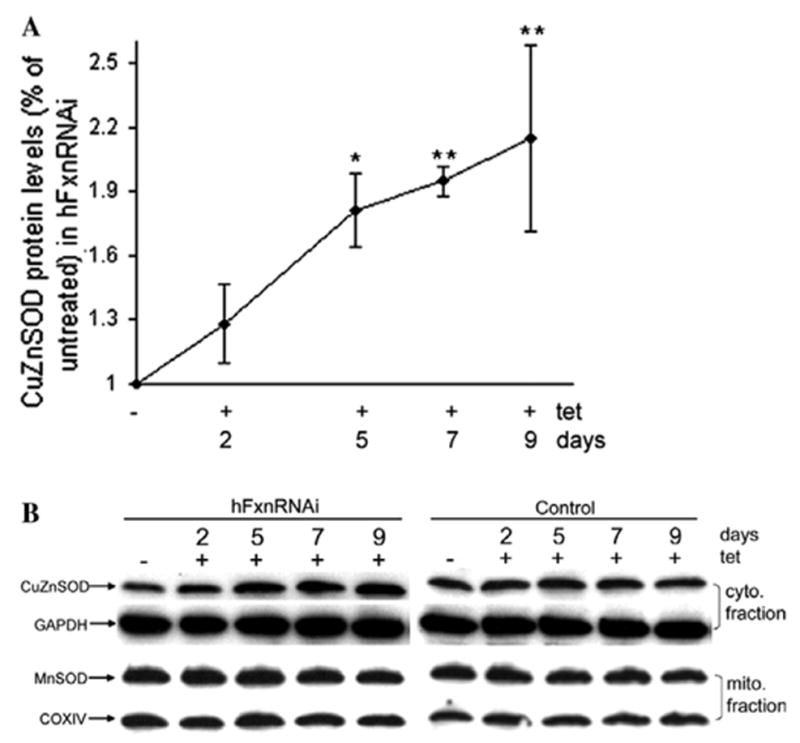
Cytoplasmic and mitochondrial SOD protein levels in hFxnRNAi cells. (A) CuZnSOD protein levels (CuZnSOD/GAPDH) by densitometry of Western blots in hFxnRNAi clones. Data are presented as percentages of basal values in cells treated without tetracycline (means ± SD, n = 3 experiments). Asterisks indicate blocked ANOVA p < 0.01 (**) or P ≤ 0.05 (*) versus basal value, Dunnett post hoc test. (B) Representative Western blots of the CuZnSOD and MnSOD protein in hFxnRNAi and control clones.
If frataxin deficiency results in oxidative damage to proteins, one measurable oxidative modification of proteins is protein carbonyl groups, which can be visualized by the immunoblot analysis of carbonylated proteins (oxyblot assay) or quantified spectrophotometrically. Both the spectrophotometric assay and densitometry of the oxyblot demonstrated a significant early increase of protein carbonyl content, long before mitochondrial aconitase activity declined (Fig. 5A and B).
Fig. 5.
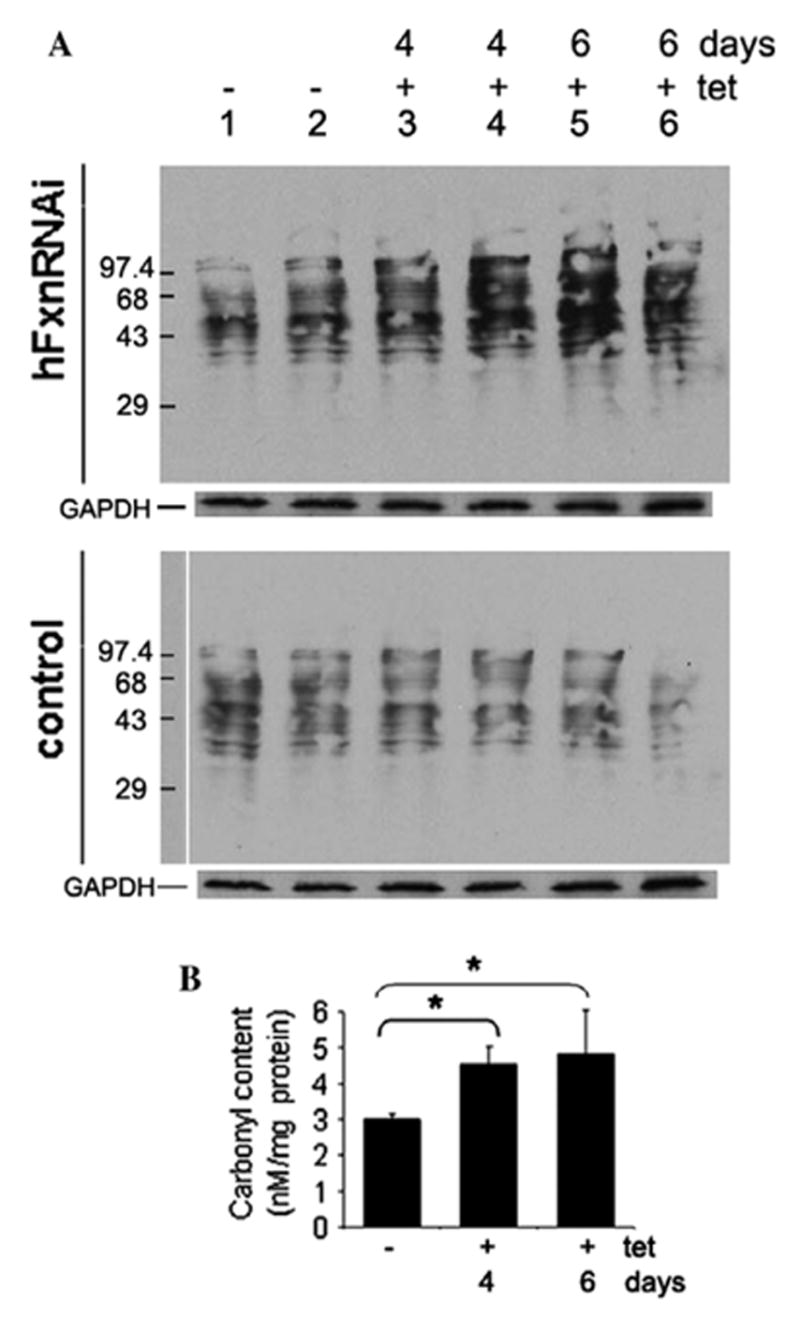
Protein carbonyl content in hFxnRNAi cells. (A) Representative immunoblot assay of carbonylated proteins in hFxnRNAi and control clones. Twenty micrograms of protein was loaded for each lane. Lanes 1– 6: DNP-derivatized protein samples, lanes 1 and 2: whole cell lysate from cells treated without tetracycline, lanes 3–6, whole cell lysate from cells treated with tetracycline for 4 or 6 days. GAPDH was used as loading control. (B) Protein carbonyl content in hFxnRNAi clones by spectrophotometric assay. Data are presented as means ± SD (n = 4 experiments) and *P ≤ 0.05 determined by Student’s t-test.
Effect of frataxin deficiency on the heme pathway and cytochrome c
Deficiency of mitochondrial heme has been shown to be one consequence of frataxin deficiency [11,31,32], and this could be a result of decreased ISC enzyme activity in the mitochondria, given that the heme biosynthetic enzymes ferrochelatase and adrenodoxin both require ISC cofactors for activity. We observed previously that mitochondrial cytochrome c protein, heme c, and heme b are deficient in cells from patients with Friedreich’s ataxia, and that cytochrome c protein and heme c decline in parallel [11]. To see if this cell model replicated the results in patients, mitochondrial cytochrome c protein was measured, and we observed that it declined from day 13 onward, suggesting a late frataxin-dependent mitochondrial heme deficiency.
If an ISC defect in the mitochondria produced a mitochondrial heme defect, then the cell should sense that defect and respond by overexpressing ALAS1, the first, mitochondrial, rate-limiting and heme-dependent step of the heme biosynthetic pathway. We observed that the mRNA of mitochondrial ALAS1 (Delta-aminolevulinate synthase 1, the house-keeping form) began to increase at day 13, in parallel with the decline in mitochondrial cytochrome c, and after the decline in mitochondrial frataxin and aconitase (Figs. 1A, 7A and B). Thus ALAS1 is induced as a consequence of frataxin inhibition, presumably as the result of an inhibition of mitochondrial heme synthesis.
Fig. 7.
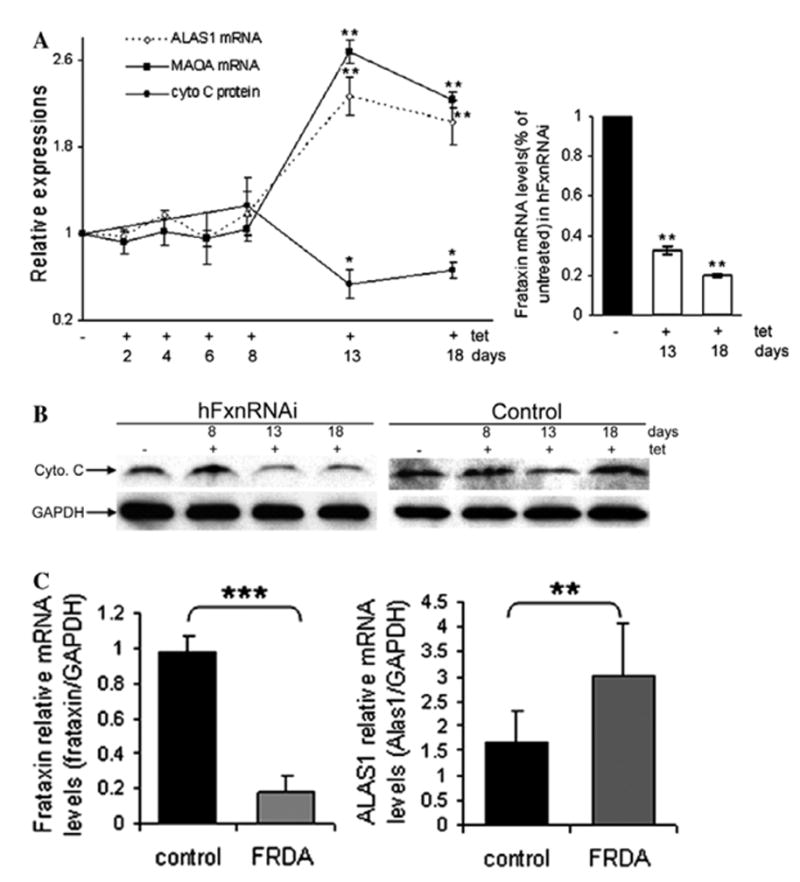
Heme-related transcripts or protein levels in hFxnRNAi cells and FRDA lymphoblasts. (A) ALAS1 and MAOA relative mRNA levels (hFxnRNAi/control) by real-time qPCR and cytochrome c protein levels by densitometry of Western blots in hFxnRNAi clones. GAPDH was used as the reference gene. Data are presented as percentages of basal values in cells treated without tetracycline (means ± SD, n = 3–4 experiments). Asterisks indicate blocked ANOVA p < 0.01 (**) or P ≤ 0.05 (*) versus basal value, Dunnett post hoc test. Frataxin mRNA levels (frataxin/GAPDH) in hFxnRNAi cells remained significantly reduced over this period of time. (B) Representative Western blots of the cytochrome c protein in hFxnRNAi and control clones. (C) Frataxin and ALAS1 relative mRNA levels in FRDA and control lymphoblasts. The error bars represent standard deviation and **P < 0.01 or ***P < 0.001 determined by Student’s t-test.
The mRNA levels of mitochondrial monoamine oxidase A (MAOA) also increased in parallel with ALAS1 at day 13 (Fig. 7A). This suggests that the increased ALAS1 levels induce MAOA expression through the heme ‘shunt’ pathway in which the condensation of glycine and acetyl-CoA can be catalyzed by ALAS1 (Fig. 8) [33], besides being catalyzed by the pyridoxyphosphate- dependent aminoacetone synthase [34,35]. We further asked if increased ALAS1 levels occurred in FRDA patient cells. Total RNA was isolated from 4 control lymphoblasts and 6 FRDA lymphoblasts. ALAS1 mRNA levels showed significant increase in FRDA lymphoblasts compared to the control lymphoblasts by realtime qPCR (Fig. 7C).
Fig. 8.
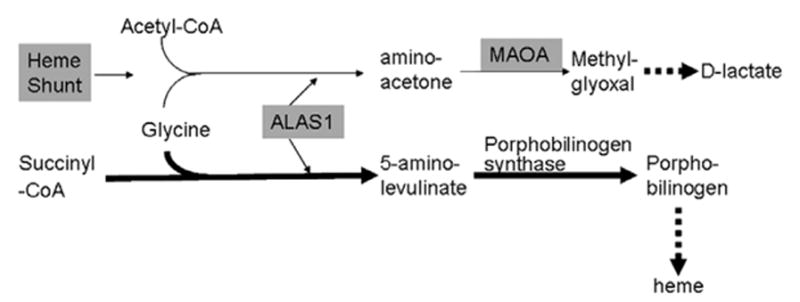
Simplified heme pathway and the shunt pathway.
An observation of the previous work in patient cells was that frataxin deficiency specified both a defect in the heme pathway and also a defect in cytochrome c [11]. In this cell model we observe that the fall in cytochrome c is a late consequence of frataxin inhibition, and parallels the induction of ALAS1 and MAOA.
Discussion
An inducible model for frataxin deficiency
Frataxin deficiency causes multiple biochemical consequences. However, both the sequence of events in FRDA cellular pathophysiology, and their relevance for the disease, are issues of substantial scientific debate. Thus, we generated an inducible model to express similar residual frataxin levels to the patients (5–35%) in an attempt to recapitulate the cellular pathophysiological changes that occur in FRDA patients, and to determine their order. The controlled onset of frataxin deficiency in this model allows a study of the time course of biochemical changes in cells with identical genetic backgrounds. In the course of this study, we observed that the cytoplasmic consequences of frataxin deficiency precede the mitochondrial ones, and so should be considered in the context of pathophysiology.
Frataxin occurs in cytosol and turns over more rapidly than in mitochondria
Until recently frataxin was thought to reside only in mitochondria. However, a cytoplasmic pool of mature frataxin has been demonstrated in several different cell types including HEK293 [16,17]. We demonstrated that the cytoplasmic frataxin pool responds about threefold more rapidly to siRNA knockdown than the mitochondrial frataxin pool. This suggests that the turnover of the cytoplasmic frataxin protein is about threefold faster than that of the mitochondrial frataxin pool. Furthermore, we demonstrate that while the density of frataxin protein per 10 μg protein is about fivefold lower in cytoplasm than mitochondria, that in aggregate there are more mature frataxin molecules in cytoplasm than mitochondria. Thus, because of their number and relatively rapid turnover, the consequences of frataxin deficiency in cytoplasm should be considered in the pathogenetic mechanism of FRDA.
Cytoplasmic frataxin protein, aconitase activity and ISU1 levels decline in parallel long before depletion of mitochondrial frataxin
One popular hypothesis for frataxin’s function is that it stimulates ISC biosynthesis, or protects ISCs from oxidative damage [20]. Another role proposed for frataxin is that it is an iron chaperone, and provides iron for ISC assembly and heme biosynthesis [22,31,32,36–38]. Consistent with the former view, we observed that frataxin deficiency caused a rapid decline in cytoplasmic aconitase activity at 2 days, in parallel with cytoplasmic frataxin depletion. There was a rapid decline in mitochondrial aconitase activity at 7 days, but only after mitochondrial frataxin was depleted at 5 days. By contrast, there was no significant alteration in mitochondrial or total cellular iron concentration at 2, 5, 7 and 9 days. Thus the earliest effects we could observe of frataxin deficiency were on ISC proteins, not on iron. These observations were consistent with the finding that frataxin depletion affected both cytoplasmic and mitochondrial aconitase activity [14]. Neither the aconitase mRNA nor protein levels were significantly altered at the time of activity decrease, consistent with the idea that the aconitase activity defect is caused by the defect in the iron–sulfur cofactor.
Cytoplasmic ISU (ISU1) protein, the scaffold upon which most cytoplasmic ISCs are made, began to decrease at day 2, in parallel with decreasing cytoplasmic frataxin levels and cytoplasmic aconitase activity, whereas the mitochondrial ISU protein (ISU2) did not show any significant change within the time period specified. We have previously demonstrated that ISU protein is deficient in cells from patients with Friedreich ataxia [18], and Frataxin has also been found to bind ISU [21,22]. ISU1 is a major scaffold on which cytoplasmic iron–sulfur clusters are built. Thus, these results demonstrate that ISU1 deficiency, along with cytosolic aconitase deficiency, are the earliest observed consequences of frataxin deficiency in the cell, and that there is no significant decrease in ISU2 level as a consequence of frataxin deficiency. These data suggest that defects in cytoplasmic ISC biosynthesis may precede other (mitochondrial) problems, and lead to cytoplasmic ISC deficiency and protein damage.
Frataxin deficiency induces the unfolded protein response
A deficiency of ISU1, which is the earliest cytoplasmic consequence of frataxin deficiency along with the decrease in aconitase activity, should lead to deficiency in the biosynthesis of cytoplasmic ISCs, and more unfolded ISC-dependent apoproteins, which should lead to defects in the folding of ISC proteins. Also, redox alterations (discussed below) triggers UPR [39–41]. We thus investigated if and when the UPR was activated by frataxin deficiency. The UPR transcripts ATF4 and CHOP were induced at 4 days (Fig. 6), after the fall of the cytoplasmic frataxin protein and aconitase activity, but long before mitochondrial aconitase activity had declined at all at 7 days, i.e., before an ISC disturbance was apparent in the mitochondria. It is interesting that the induction of MTHFD2 (methylenetetrahydrofolate dehydrogenase 2) transcript, a known transcriptional target of ATF4, was found to be one of the earliest molecular changes in frataxin-deficient mouse heart tissues by microarray analysis [42]. These data suggest that the rise in UPR transcripts is predominantly or exclusively the consequence of cytoplasmic frataxin deficiency, i.e., cytoplasmic frataxin → ISU1/aconitase (→ ISC protein misfolding) → UPR.
The UPR has recently been implicated in two neurological demyelinating diseases, i.e., Pelizaeus–Merzbacher disease (PMD) [25] and Childhood Ataxia with Central nervous system Hypomyelinization (CACH) [26]. Unmyelinated axons were observed in a series of necropsied and biopsied FRDA cases [43]. Recently, demyelination has been reported in a mouse model of Friedreich’s ataxia [44]. Thus, the induction of the UPR stress response could contribute to demyelination in Friedreich’s ataxia.
CuZnSOD and oxidative damage are induced early, before mitochondrial frataxin is depleted
There is debate over whether redox alterations play a role in the pathogenesis of FRDA. Increased oxidative damage was observed in FRDA patients [45,46] and occurs after frataxin disruption in murine hepatocytes or pancreatic cells [47,48], and the antioxidant idebenone is cardioprotective in frataxin knockout mice [49]. However, other studies in the frataxin knockouts show no protection by the MnSOD mimetic (MnTBAP) or CuZnSOD overexpression [42].
We observed that defects in cytoplasmic ISU1 and cytoplasmic aconitase activity are the earliest consequences of frataxin deficiency. Defects in cytoplasmic ISC biosynthesis are expected to lead to deficiencies in cytoplasmic ISC proteins, many or all of which are redox-active. Thus, there are two ways in which cytoplasmic frataxin deficiency may lead to redox alterations. First, if frataxin is involved in ISC biogenesis, then as a consequence of decreased cytoplasmic ISCs, there may be increased ROS generation by redox-active proteins with damaged iron–sulfur clusters. Alternatively, if frataxin’s normal role is to protect ISCs from oxidative damage, and if frataxin is decreased, then the cell may perceive redox alterations as a consequence of ISC defects. Whether the increase in oxidative damage is a direct consequence of an increase in the number of unfolded redox-active apoproteins, or an indirect consequence of cell sensing of decreased ISCs which is interpreted by the cell as the result of an oxidative attack, we observed a strong induction of CuZnSOD protein (but not MnSOD) at a very early time, 2 days. The induction of CuZnSOD is coincident with the decline in cytoplasmic ISU1 protein level and aconitase activity, suggesting that the deficiency in cytoplasmic ISCs caused alterations in redox status. The induction of CuZnSOD at day 2 occurred long before the fall in mitochondrial aconitase activity at day 7, so it cannot be the result of some mitochondrial ISC defect. Consistent with redox status alterations, we observed increased levels of carbonyl-modified proteins as a consequence of frataxin depletion. The formation of carbonyl groups is the most general and widely used biomarker of protein oxidation [50]. Another good indicator of redox alteration is the GSSG/GSH ratio. In an earlier study, we observed that frataxin deficiency results in a higher level of peroxide and a higher GSSG/GSH ratio (decreased GSH and increased GSSG) [18]. It was intriguing that increased CuZnSOD and oxidized proteins were also observed in FRDA mouse models with GAA repeat expansion mutation [44]. Taken together, these data support the idea that defects in cytoplasmic frataxin cause defects in cytoplasmic ISC proteins which triggers redox alterations and CuZnSOD induction, i.e., cytoplasmic frataxin → ISC → ISU1/aconitase → redox alterations → CuZnSOD induction, and also that cytoplasmic frataxin → ISC → ISU1/aconitase → UPR.
Thus we infer that frataxin deficiency in the cytoplasm causes decreased cytoplasmic ISC biosynthesis in the first phase, which causes both redox alterations and the unfolded protein response. If induction of the UPR is a root cause of neurodegeneration in FRDA, as it is in CACH and PMD, then treatments which inhibit the UPR may be relevant for FRDA patients.
Induction of the heme pathway is a late consequence of frataxin deficiency
We showed previously that frataxin deficiency in patient FRDA lymphoblasts decreases mitochondrial hemes c and a and cytochrome c protein [11] patients, and that knockout mice and cell models also have defects in particular heme transcripts. The current cell model recapitulates the heme response that was observed in other models, and shows that this is a late consequence of frataxin deficiency and begins at 13 days, coincident with cytochrome c deficiency. Thus, frataxin deficiency does result in defects in cytochrome c and induce heme pathway transcripts, but much later than the ISC protein defects, which seems more likely to be a consequence of the late ISC deficiency in the mitochondria, rather than the early depletion of ISCs in the cytoplasm. In contrast to the early changes in cytoplasmic frataxin, cytoplasmic ISCs, and cytoplasmic UPR and redox alterations, the decline in mitochondrial aconitase was quite late, and began at 7 days. Mitochondrial heme synthesis includes two ISC enzymes, ferrochelatase and adrenodoxin, and frataxin has been demonstrated to bind to ferrochelatase [32]. Thus it may be that the later iron– sulfur cluster defect in the mitochondria causes the defect in heme biosynthesis, which the cell tries to overcome by inducing ALAS1 at day 13.
ALAS1 regulates two pathways, the heme biosynthetic pathway, and a ‘shunt’ pathway that produces D-lactate [33], and one step on the shunt pathway is the conversion of aminoacetone to methyglyoxal by monoamine oxidase. As expected, the rise in ALAS1 transcript was paralleled by the rise in MAOA transcript. High MAOA activity is associated with schizophrenia, psychosis and bipolar disorders, and MAOA inhibitors have been used as antidepressants [51]. Friedreich ataxia has been reported to be associated with a number of psychiatric manifestations including cognitive impairment, depression, emotional lability and schizophrenia-like psychosis [52–54]. The association of neuropsychiatric signs with porphyrias has also been long-recognized [55,56], but never understood, and we propose that defects in the heme pathway feed back to stimulate ALAS1, (and thus necessarily MAOA through the heme shunt) to cause the neuropsychiatric symptoms. The parallel induction of ALAS1 and MAOA provides a novel hypothesis for the acknowledged fact that porphyrias are associated with psychiatric symptoms, and has the potential to explain some psychiatric symptoms in FRDA patients. Since approved, non-toxic pharmacological MAOA inhibitors exist, FRDA patients with neuropsychiatric symptoms may benefit from their use.
Summary and prospects
The data presented herein evaluate the time- and compartment- dependent consequences of frataxin deficiency. The data demonstrate that cytoplasmic frataxin turns over threefold faster than mitochondrial frataxin, and that the earliest consequences of frataxin deficiency are cytoplasmic. The consequences of cytoplasmic frataxin deficiency include defects in ISU1 and aconitase, which apparently cause induction of CuZnSOD and protein oxidative damage and the induction of the unfolded protein response, whose persistent induction has been demonstrated to cause other glial neurological diseases. If UPR induction is the cause of neurodegeneration and diabetes in FRDA, inhibition of UPR could be of benefit to FRDA patients. Later, the mitochondrial frataxin deficiency caused a deficiency in mitochondrial iron-sulfur cluster enzymes, and later still a coincident deficiency in heme-containing cytochrome c, and induction of ALAS1. Taken together these data suggest a model for FRDA in that cytoplasmic frataxin defects are primary, i.e., cytoplasmic frataxin → cytoplasmic ISCs → redox alterations and UPR → negative consequences. A second observation is that frataxin deficiency in the mitochondria → ISC defects → mitochondrial heme defects→ heme induction. The parallel induction of MAOA with ALAS1 suggests a biochemical basis for psychiatric symptoms in FRDA patients in particular and the porphyrias in general, and for those patients, MAOA-inhibitors may be of benefit.
Acknowledgments
We thank R. Schoenfeld, Y. Shan and M. Britton for critical review of the manuscript. This work was supported by USPHS Grants AG11967, AG16719, EY12245 and AG23311.
Abbreviations used
- UPR
unfolded protein response
- FRDA
Friedreich ataxia
- ISC
iron–sulfur cluster
- PBS
phosphate-buffered saline
- DNPH
2,4-dinitrophenylhydrazine
- ROS
reactive oxygen species
- ATF4
activating transcription factor 4
- CHOP
C/EBP homologous protein
- ALAS1
Delta-aminolevulinate synthase 1
- MAOA
monoamine oxidase A
- MTHFD2
methylenetetrahydrofolate dehydrogenase 2
- PMD
Pelizaeus –Merzbacher disease
References
- 1.Harding AE. The Hereditary Ataxias and Related Disorders. Churchill Livingstone: Edinburgh; 1984. [Google Scholar]
- 2.Harding AE. The inherited ataxias. Adv Neurol. 1988;48:37–46. [PubMed] [Google Scholar]
- 3.Johnson WG. Friedreich ataxia. Clin Neurosci. 1995;3:33–38. [PubMed] [Google Scholar]
- 4.Campuzano V, Montermini L, Molto MD, Pianese L, Cossee M, Cavalcanti F, Monros E, Rodius F, Duclos F, Monticelli A, Zara F, Canizares J, Koutnikova H, Bidichandani SI, Gellera C, Brice A, Trouillas P, De Michele G, Filla A, De Frutos R, Palau F, Patel PI, Di Donato S, Mandel JL, Cocozza S, Koenig M, Pandolfo M. Friedreich’s ataxia: autosomal recessive disease caused by an intronic GAA triplet repeat expansion. Science. 1996;271:1423–1427. doi: 10.1126/science.271.5254.1423. [DOI] [PubMed] [Google Scholar]
- 5.Campuzano V, Montermini L, Lutz Y, Cova L, Hindelang C, Jiralerspong S, Trottier Y, Kish SJ, Faucheux B, Trouillas P, Authier FJ, Durr A, Mandel JL, Vescovi A, Pandolfo M, Koenig M. Frataxin is reduced in Friedreich ataxia patients and is associated with mitochondrial membranes. Hum Mol Genet. 1997;6:1771–1780. doi: 10.1093/hmg/6.11.1771. [DOI] [PubMed] [Google Scholar]
- 6.Pianese L, Turano M, Lo Casale MS, De Biase I, Giacchetti M, Monticelli A, Criscuolo C, Filla A, Cocozza S. Real time PCR quantification of frataxin mRNA in the peripheral blood leucocytes of Friedreich ataxia patients and carriers. J Neurol Neurosurg Psychiatry. 2004;75:1061–1063. doi: 10.1136/jnnp.2003.028605. [DOI] [PMC free article] [PubMed] [Google Scholar]
- 7.Foury F, Cazzalini O. Deletion of the yeast homologue of the human gene associated with Friedreich’s ataxia elicits iron accumulation in mitochondria. FEBS Lett. 1997;411:373–377. doi: 10.1016/s0014-5793(97)00734-5. [DOI] [PubMed] [Google Scholar]
- 8.Wilson RB, Roof DM. Respiratory deficiency due to loss of mitochondrial DNA in yeast lacking the frataxin homologue. Nat Genet. 1997;16:352–357. doi: 10.1038/ng0897-352. [DOI] [PubMed] [Google Scholar]
- 9.Rotig A, de Lonlay P, Chretien D, Foury F, Koenig M, Sidi D, Munnich A, Rustin P. Aconitase and mitochondrial iron–sulphur protein deficiency in Friedreich ataxia. Nat Genet. 1997;17:215–217. doi: 10.1038/ng1097-215. [DOI] [PubMed] [Google Scholar]
- 10.Lamarche DSJB, Cote M, Lemieux B. Cardiac iron deposits in Friedreich’s ataxia. In: Lechtenberg R, editor. Handbook of Cerebellar Diseases. Marcel Dekker; 1993. pp. 453–458. [Google Scholar]
- 11.Schoenfeld RA, Napoli E, Wong A, Zhan S, Reutenauer L, Morin D, Buckpitt AR, Taroni F, Lonnerdal B, Ristow M, Puccio H, Cortopassi GA. Frataxin deficiency alters heme pathway transcripts and decreases mitochondrial heme metabolites in mammalian cells. Hum Mol Genet. 2005;14:3787–3799. doi: 10.1093/hmg/ddi393. [DOI] [PubMed] [Google Scholar]
- 12.Pianese L, Busino L, De Biase I, De Cristofaro T, Lo Casale MS, Giuliano P, Monticelli A, Turano M, Criscuolo C, Filla A, Varrone S, Cocozza S. Up-regulation of c-Jun N-terminal kinase pathway in Friedreich’s ataxia cells. Hum Mol Genet. 2002;11:2989–2996. doi: 10.1093/hmg/11.23.2989. [DOI] [PubMed] [Google Scholar]
- 13.Puccio H, Simon D, Cossee M, Criqui-Filipe P, Tiziano F, Melki J, Hindelang C, Matyas R, Rustin P, Koenig M. Mouse models for Friedreich ataxia exhibit cardiomyopathy, sensory nerve defect and Fe–S enzyme deficiency followed by intramitochondrial iron deposits. Nat Genet. 2001;27:181–186. doi: 10.1038/84818. [DOI] [PubMed] [Google Scholar]
- 14.Stehling O, Elsasser HP, Bruckel B, Muhlenho U, Lill R. Iron– sulfur protein maturation in human cells: evidence for a function of frataxin. Hum Mol Genet. 2004;13:3007–3015. doi: 10.1093/hmg/ddh324. [DOI] [PubMed] [Google Scholar]
- 15.Coppola G, Choi SH, Santos MM, Miranda CJ, Tentler D, Wexler EM, Pandolfo M, Geschwind DH. Gene expression profiling in frataxin deficient mice: microarray evidence for significant expression changes without detectable neurodegeneration. Neurobiol Dis. 2006;22:302–311. doi: 10.1016/j.nbd.2005.11.014. [DOI] [PMC free article] [PubMed] [Google Scholar]
- 16.Acquaviva F, De Biase I, Nezi L, Ruggiero G, Tatangelo F, Pisano C, Monticelli A, Garbi C, Acquaviva AM, Cocozza S. Extramitochondrial localisation of frataxin and its association with IscU1 during enterocyte-like differentiation of the human colon adenocarcinoma cell line Caco-2. J Cell Sci. 2005;118:3917–3924. doi: 10.1242/jcs.02516. [DOI] [PubMed] [Google Scholar]
- 17.Condo I, Ventura N, Malisan F, Tomassini B, Testi R. A pool of extramitochondrial frataxin that promotes cell survival. J Biol Chem. 2006;281:16750–16756. doi: 10.1074/jbc.M511960200. [DOI] [PubMed] [Google Scholar]
- 18.Tan G, Napoli E, Taroni F, Cortopassi G. Decreased expression of genes involved in sulfur amino acid metabolism in frataxin-deficient cells. Hum Mol Genet. 2003;12:1699–1711. doi: 10.1093/hmg/ddg187. [DOI] [PubMed] [Google Scholar]
- 19.Gardner PR, Fridovich I. Superoxide sensitivity of the Escherichia coli aconitase. J Biol Chem. 1991;266:19328–19333. [PubMed] [Google Scholar]
- 20.Bulteau AL, O’Neill HA, Kennedy MC, Ikeda-Saito M, Isaya G, Szweda LI. Frataxin acts as an iron chaperone protein to modulate mitochondrial aconitase activity. Science. 2004;305:242– 245. doi: 10.1126/science.1098991. [DOI] [PubMed] [Google Scholar]
- 21.Napoli E, Taroni F, Cortopassi GA. Frataxin, iron–sulfur clusters, heme, ROS, and aging. Antioxid Redox Signal. 2006;8:506–516. doi: 10.1089/ars.2006.8.506. [DOI] [PMC free article] [PubMed] [Google Scholar]
- 22.Yoon T, Cowan JA. Iron–sulfur cluster biosynthesis. Characterization of frataxin as an iron donor for assembly of [2Fe–2S] clusters in ISU-type proteins. J Am Chem Soc. 2003;125:6078–6084. doi: 10.1021/ja027967i. [DOI] [PubMed] [Google Scholar]
- 23.Hoozemans JJ, Veerhuis R, Van Haastert ES, Rozemuller JM, Baas F, Eikelenboom P, Scheper W. The unfolded protein response is activated in Alzheimer’s disease. Acta Neuropathol (Berl) 2005;110:165–172. doi: 10.1007/s00401-005-1038-0. [DOI] [PubMed] [Google Scholar]
- 24.Ryu EJ, Harding HP, Angelastro JM, Vitolo OV, Ron D, Greene LA. Endoplasmic reticulum stress and the unfolded protein response in cellular models of Parkinson’s disease. J Neurosci. 2002;22:10690–10698. doi: 10.1523/JNEUROSCI.22-24-10690.2002. [DOI] [PMC free article] [PubMed] [Google Scholar]
- 25.Southwood CM, Garbern J, Jiang W, Gow A. The unfolded protein response modulates disease severity in Pelizaeus–Merzbacher disease. Neuron. 2002;36:585–596. doi: 10.1016/s0896-6273(02)01045-0. [DOI] [PMC free article] [PubMed] [Google Scholar]
- 26.Kantor L, Harding HP, Ron D, Schiffmann R, Kaneski CR, Kimball SR, Elroy-Stein O. Heightened stress response in primary fibroblasts expressing mutant eIF2B genes from CACH/VWM leukodystrophy patients. Hum Genet. 2005;118:99–106. doi: 10.1007/s00439-005-0024-x. [DOI] [PubMed] [Google Scholar]
- 27.Vlug AS, Teuling E, Haasdijk ED, French P, Hoogenraad CC, Jaarsma D. ATF3 expression precedes death of spinal motoneurons in amyotrophic lateral sclerosis-SOD1 transgenic mice and correlates with c-Jun phosphorylation, CHOP expression, somato-dendritic ubiquitination and Golgi fragmentation. Eur J Neurosci. 2005;22:1881–1894. doi: 10.1111/j.1460-9568.2005.04389.x. [DOI] [PubMed] [Google Scholar]
- 28.Cortopassi G, Danielson S, Alemi M, Zhan SS, Tong W, Carelli V, Martinuzzi A, Marzuki S, Majamaa K, Wong A. Mitochondrial disease activates transcripts of the unfolded protein response and cell cycle and inhibits vesicular secretion and oligodendrocyte- specific transcripts. Mitochondrion. 2006;6:161–175. doi: 10.1016/j.mito.2006.05.002. [DOI] [PubMed] [Google Scholar]
- 29.Djaman O, Outten FW, Imlay JA. Repair of oxidized iron–sulfur clusters in Escherichia coli. J Biol Chem. 2004;279:44590–44599. doi: 10.1074/jbc.M406487200. [DOI] [PubMed] [Google Scholar]
- 30.Gardner PR. Aconitase: sensitive target and measure of superoxide. Methods Enzymol. 2002;349:9–23. doi: 10.1016/s0076-6879(02)49317-2. [DOI] [PubMed] [Google Scholar]
- 31.Lesuisse E, Santos R, Matzanke BF, Knight SA, Camadro JM, Dancis A. Iron use for haeme synthesis is under control of the yeast frataxin homologue (Yfh1) Hum Mol Genet. 2003;12:879–889. doi: 10.1093/hmg/ddg096. [DOI] [PubMed] [Google Scholar]
- 32.Yoon T, Cowan JA. Frataxin-mediated iron delivery to ferrochelatase in the final step of heme biosynthesis. J Biol Chem. 2004;279:25943–25946. doi: 10.1074/jbc.C400107200. [DOI] [PubMed] [Google Scholar]
- 33.Urata G, Granick S. Biosynthesis of alpha-aminoketones and the metabolism of aminoacetone. J Biol Chem. 1963;238:811–820. [PubMed] [Google Scholar]
- 34.Fubara B, Eckenrode F, Tressel T, Davis L. Purification and properties of aminoacetone synthetase from beef liver mitochondria. J Biol Chem. 1986;261:12189–12196. [PubMed] [Google Scholar]
- 35.Tong H, Davis L. 2-Amino-3-ketobutyrate-CoA ligase from beef liver mitochondria. Purification and partial sequence. J Biol Chem. 1994;269:4057–4064. [PubMed] [Google Scholar]
- 36.Muhlenho U, Richhardt N, Ristow M, Kispal G, Lill R. The yeast frataxin homolog Yfh1p plays a specific role in the maturation of cellular Fe/S proteins. Hum Mol Genet. 2002;11:2025–2036. doi: 10.1093/hmg/11.17.2025. [DOI] [PubMed] [Google Scholar]
- 37.Cavadini P, O’Neill HA, Benada O, Isaya G. Assembly and ironbinding properties of human frataxin, the protein deficient in Friedreich ataxia. Hum Mol Genet. 2002;11:217–227. doi: 10.1093/hmg/11.3.217. [DOI] [PubMed] [Google Scholar]
- 38.Park S, Gakh O, O’Neill HA, Mangravita A, Nichol H, Ferreira GC, Isaya G. Yeast frataxin sequentially chaperones and stores iron by coupling protein assembly with iron oxidation. J Biol Chem. 2003;278:31340–31351. doi: 10.1074/jbc.M303158200. [DOI] [PubMed] [Google Scholar]
- 39.Harding HP, Zhang Y, Zeng H, Novoa I, Lu PD, Calfon M, Sadri N, Yun C, Popko B, Paules R, Stojdl DF, Bell JC, Hettmann T, Leiden JM, Ron D. An integrated stress response regulates amino acid metabolism and resistance to oxidative stress. Mol Cell. 2003;11:619–633. doi: 10.1016/s1097-2765(03)00105-9. [DOI] [PubMed] [Google Scholar]
- 40.Xue X, Piao JH, Nakajima A, Sakon-Komazawa S, Kojima Y, Mori K, Yagita H, Okumura K, Harding H, Nakano H. Tumor necrosis factor alpha (TNFalpha) induces the unfolded protein response (UPR) in a reactive oxygen species (ROS)-dependent fashion, and the UPR counteracts ROS accumulation by TNFalpha. J Biol Chem. 2005;280:33917–33925. doi: 10.1074/jbc.M505818200. [DOI] [PubMed] [Google Scholar]
- 41.Hayashi T, Saito A, Okuno S, Ferrand-Drake M, Dodd RL, Chan PH. Damage to the endoplasmic reticulum and activation of apoptotic machinery by oxidative stress in ischemic neurons. J Cereb Blood Flow Metab. 2005;25:41–53. doi: 10.1038/sj.jcbfm.9600005. [DOI] [PubMed] [Google Scholar]
- 42.Seznec H, Simon D, Bouton C, Reutenauer L, Hertzog A, Golik P, Procaccio V, Patel M, Drapier JC, Koenig M, Puccio H. Friedreich ataxia: the oxidative stress paradox. Hum Mol Genet. 2005;14:463–474. doi: 10.1093/hmg/ddi042. [DOI] [PubMed] [Google Scholar]
- 43.Hughes JT, Brownell B, Hewer RL. The peripheral sensory pathway in Friedreich’s ataxia. An examination by light and electron microscopy of the posterior nerve roots, posterior root ganglia, and peripheral sensory nerves in cases of Friedreich’s ataxia. Brain. 1968;91:803–818. doi: 10.1093/brain/91.4.803. [DOI] [PubMed] [Google Scholar]
- 44.Al-Mahdawi S, Pinto RM, Varshney D, Lawrence L, Lowrie MB, Hughes S, Webster Z, Blake J, Cooper JM, King R, Pook MA. GAA repeat expansion mutation mouse models of Friedreich ataxia exhibit oxidative stress leading to progressive neuronal and cardiac pathology. Genomics. 2006;88:580–590. doi: 10.1016/j.ygeno.2006.06.015. [DOI] [PMC free article] [PubMed] [Google Scholar]
- 45.Schulz JB, Dehmer T, Schols L, Mende H, Hardt C, Vorgerd M, Burk K, Matson W, Dichgans J, Beal MF, Bogdanov MB. Oxidative stress in patients with Friedreich ataxia. Neurology. 2000;55:1719–1721. doi: 10.1212/wnl.55.11.1719. [DOI] [PubMed] [Google Scholar]
- 46.Emond M, Lepage G, Vanasse M, Pandolfo M. Increased levels of plasma malondialdehyde in Friedreich ataxia. Neurology. 2000;55:1752–1753. doi: 10.1212/wnl.55.11.1752. [DOI] [PubMed] [Google Scholar]
- 47.Thierbach R, Schulz TJ, Isken F, Voigt A, Mietzner B, Drewes G, von Kleist-Retzow JC, Wiesner RJ, Magnuson MA, Puccio H, Pfeiffer AF, Steinberg P, Ristow M. Targeted disruption of hepatic frataxin expression causes impaired mitochondrial function, decreased life span and tumor growth in mice. Hum Mol Genet. 2005;14:3857–3864. doi: 10.1093/hmg/ddi410. [DOI] [PubMed] [Google Scholar]
- 48.Ristow M, Mulder H, Pomplun D, Schulz TJ, Muller-Schmehl K, Krause A, Fex M, Puccio H, Muller J, Isken F, Spranger J, Muller-Wieland D, Magnuson MA, Mohlig M, Koenig M, Pfeiffer AF. Frataxin deficiency in pancreatic islets causes diabetes due to loss of beta cell mass. J Clin Invest. 2003;112:527–534. doi: 10.1172/JCI18107. [DOI] [PMC free article] [PubMed] [Google Scholar]
- 49.Seznec H, Simon D, Monassier L, Criqui-Filipe P, Gansmuller A, Rustin P, Koenig M, Puccio H. Idebenone delays the onset of cardiac functional alteration without correction of Fe–S enzymes deficit in a mouse model for Friedreich ataxia. Hum Mol Genet. 2004;13:1017–1024. doi: 10.1093/hmg/ddh114. [DOI] [PubMed] [Google Scholar]
- 50.Stadtman ER, Oliver CN. Metal-catalyzed oxidation of proteins. Physiological consequences. J Biol Chem. 1991;266:2005–2008. [PubMed] [Google Scholar]
- 51.Amrein R, Martin JR, Cameron AM. Moclobemide in patients with dementia and depression. Adv Neurol. 1999;80:509–519. [PubMed] [Google Scholar]
- 52.Chan YC. Aripiprazole treatment for psychosis associated with Friedreich’s ataxia. Gen Hosp Psychiatry. 2005;27:372. doi: 10.1016/j.genhosppsych.2005.05.004. [DOI] [PubMed] [Google Scholar]
- 53.Lishman WA. Organic psychiatry, the psychological consequences of cerebral disorder. Blackwell Scientific Publications; Oxford: 1998. [Google Scholar]
- 54.Singh G, Binstadt BA, Black DF, Corr AP, Rummans TA. Electroconvulsive therapy and Friedreich’s ataxia. J Ect. 2001;17:53–54. doi: 10.1097/00124509-200103000-00011. [DOI] [PubMed] [Google Scholar]
- 55.Crimlisk HL. The little imitator—porphyria: a neuropsychiatric disorder. J Neurol Neurosurg Psychiatry. 1997;62:319–328. doi: 10.1136/jnnp.62.4.319. [DOI] [PMC free article] [PubMed] [Google Scholar]
- 56.Massey EW. Neuropsychiatric manifestations of porphyria. J Clin Psychiatry. 1980;41:208–213. [PubMed] [Google Scholar]